Enhanced Archaerhodopsin Fluorescent Protein Voltage Indicators
Enhanced Archaerhodopsin Fluorescent Protein Voltage Indicators
Enhanced Archaerhodopsin Fluorescent Protein Voltage Indicators

Create successful ePaper yourself
Turn your PDF publications into a flip-book with our unique Google optimized e-Paper software.
<strong>Enhanced</strong> Arch <strong>Voltage</strong> Sensors<br />
Arch during the application of the excitation laser at the same<br />
illumination intensities (1400 mW/mm 2 ) used during imaging<br />
(Figure 2d). However, under identical optical conditions we<br />
recorded little photocurrent for a neuron transfected with Arch-<br />
EEQ. By averaging the measured photocurrent over many<br />
cells, we observed negligible photocurrent for both Arch-EEN<br />
(-0.1 pA ± 0.1 pA, n = 10 cells) and Arch-EEQ (0.2 pA ± 0.1 pA,<br />
n = 16 cells) (Figure 2e).<br />
The faster kinetics of the Arch-EEx mutants also improved<br />
the fluorescence responses to neuronal action potentials.<br />
Typical optical traces (frame rate 440 Hz) corresponded well to<br />
simultaneously recorded traces of electrical activity, regarding<br />
both spiking and sub-threshold dynamics (Figure 3a). Notably,<br />
the Arch-EEx sensors’ fast and slow response components<br />
served distinct functions. The fast component facilitated spike<br />
detection, whereas the combination of the fast and slow<br />
components relayed the fluctuations in baseline voltage. We<br />
computed the ∆F/F of individual neurons in response to single<br />
action potentials induced by short current injections (Figure 3bc).<br />
The electrophysiological recordings for cells expressing<br />
Arch-EEQ, -EEN, and -D95N respectively revealed FWHM<br />
action potential widths of 3.5 ± 0.8 ms, 3.4 ± 0.6 ms, and 3.1 ±<br />
0.8 ms (mean ± standard deviation; n = 7–23 cells) (Figure 3b),<br />
which are typical values for cultured neurons. Due to its faster<br />
kinetics, Arch-EEN exhibited a ~3-fold increase in peak ∆F/F in<br />
response to neural spikes as compared to Arch-D95N, despite<br />
Arch-EEN’s reduced steady-state dynamic range. Similarly,<br />
Arch-EEQ had a 4-fold increase in peak ∆F/F response to<br />
spikes versus Arch-D95N, with ∆F/F values as high as 17% for<br />
single cells. It is likely that improved pixel selection and<br />
background subtraction could yield even higher ∆F/F values.<br />
Arch mutations improved spike detection fidelity<br />
We characterized the new Arch mutants using various<br />
measures of SNR and spike detection capabilities, and found<br />
that the sensors outperformed Arch-D95N. A simplistic notion<br />
of SNR is the peak response divided by the standard deviation<br />
of the baseline fluorescence in one time bin (Methods). We<br />
compared the shot-noise limited performance of the various<br />
sensors using this metric, all at the same imaging conditions<br />
(440 Hz frame rate; 1400 mW/mm 2 illumination) (Figure 4a).<br />
Because of the similar brightness of all three mutants under<br />
633 nm excitation, the new Arch mutants had similar increases<br />
in SNR, as predicted from the increases in peak ∆F/F<br />
responses.<br />
We also used a signal detection theoretic framework to<br />
quantify the fidelity of spike detection [26]. The spike<br />
discriminability described in Ref. 26, denoted here as d’,<br />
indexes the receiver-operating characteristic (ROC) curve for<br />
spike detection and quantifies the degree to which spikes can<br />
be correctly identified within fluorescence data attained at the<br />
physical noise limits set by photon shot noise (Methods). This<br />
figure of merit takes into consideration a neuron’s<br />
experimentally determined fluorescence baseline, the peak<br />
∆F/F response to a spike, and the temporal duration of the<br />
sensor’s response to a spike. By aggregating photons over<br />
multiple frames and accounting for sensor kinetics, this<br />
framework provides a far more realistic measure of spike<br />
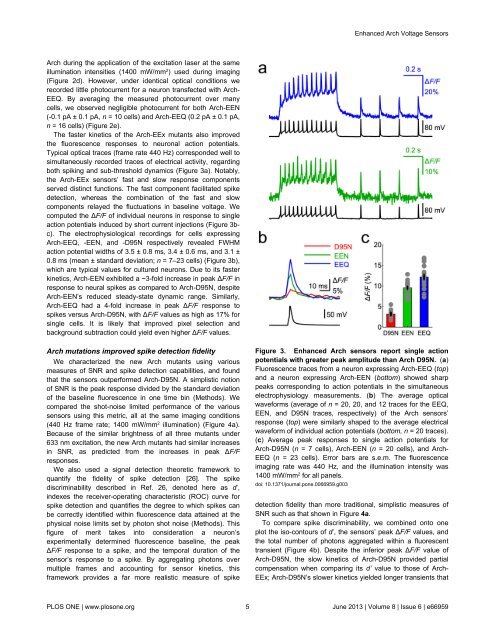
Figure 3. <strong>Enhanced</strong> Arch sensors report single action<br />
potentials with greater peak amplitude than Arch D95N. (a)<br />
Fluorescence traces from a neuron expressing Arch-EEQ (top)<br />
and a neuron expressing Arch-EEN (bottom) showed sharp<br />
peaks corresponding to action potentials in the simultaneous<br />
electrophysiology measurements. (b) The average optical<br />
waveforms (average of n = 20, 20, and 12 traces for the EEQ,<br />
EEN, and D95N traces, respectively) of the Arch sensors’<br />
response (top) were similarly shaped to the average electrical<br />
waveform of individual action potentials (bottom, n = 20 traces).<br />
(c) Average peak responses to single action potentials for<br />
Arch-D95N (n = 7 cells), Arch-EEN (n = 20 cells), and Arch-<br />
EEQ (n = 23 cells). Error bars are s.e.m. The fluorescence<br />
imaging rate was 440 Hz, and the illumination intensity was<br />
1400 mW/mm 2 for all panels.<br />
doi: 10.1371/journal.pone.0066959.g003<br />
detection fidelity than more traditional, simplistic measures of<br />
SNR such as that shown in Figure 4a.<br />
To compare spike discriminability, we combined onto one<br />
plot the iso-contours of d’, the sensors’ peak ∆F/F values, and<br />
the total number of photons aggregated within a fluorescent<br />
transient (Figure 4b). Despite the inferior peak ∆F/F value of<br />
Arch-D95N, the slow kinetics of Arch-D95N provided partial<br />
compensation when comparing its d’ value to those of Arch-<br />
EEx; Arch-D95N’s slower kinetics yielded longer transients that<br />
PLOS ONE | www.plosone.org 5 June 2013 | Volume 8 | Issue 6 | e66959