Freezing and Melting of Water.pdf
Freezing and Melting of Water.pdf
Freezing and Melting of Water.pdf

Create successful ePaper yourself
Turn your PDF publications into a flip-book with our unique Google optimized e-Paper software.
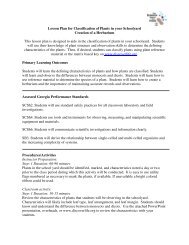
<strong>Freezing</strong> <strong>and</strong> <strong>Melting</strong> <strong>of</strong> <strong>Water</strong><br />
The cooling <strong>and</strong> warming behavior <strong>of</strong> water is investigated. With the use <strong>of</strong> technology, water<br />
temperature data is collected, graphed <strong>and</strong> analyzed. The freezing <strong>and</strong> melting points <strong>of</strong> water are<br />
determined <strong>and</strong> compared.<br />
Hypothesis<br />
The freezing <strong>and</strong> melting points <strong>of</strong> a substance may be determined by observing the warming<br />
<strong>and</strong> cooling behavior <strong>of</strong> that substance.<br />
Primary Learning Outcomes<br />
At the end <strong>of</strong> this lesson, students will be able to:<br />
• Be familiarized with data collection using the Vernier LabPro <strong>and</strong> TI calculator<br />
• Be familiarized with the use <strong>of</strong> the Vernier LabPro temperature probe<br />
• Collect, graph, display <strong>and</strong> make inferences from data<br />
• Determine the freezing <strong>and</strong> melting point <strong>of</strong> water using temperature readings <strong>of</strong> cooling <strong>and</strong><br />
warming water samples<br />
Assessed GPS<br />
SCSh2. Students will use st<strong>and</strong>ard safety practices for all classroom laboratory <strong>and</strong> field<br />
investigations.<br />
a. Follow correct procedures for use <strong>of</strong> scientific apparatus.<br />
SCSh3. Students will identify <strong>and</strong> investigate problems scientifically.<br />
c. Collect, organize <strong>and</strong> record appropriate data.<br />
d. Graphically compare <strong>and</strong> analyze data points <strong>and</strong>/or summary statistics.<br />
e. Develop reasonable conclusions based on data collected.<br />
f. Evaluate whether conclusions are reasonable by reviewing the process <strong>and</strong> checking<br />
against other available information.<br />
SCSh4. Students will use tools <strong>and</strong> instruments for observing, measuring, <strong>and</strong> manipulating<br />
scientific equipment <strong>and</strong> materials.<br />
a. Develop <strong>and</strong> use systematic procedures for recording <strong>and</strong> organizing information.<br />
b. Use technology to produce tables <strong>and</strong> graphs.<br />
c. Use technology to develop, test, <strong>and</strong> revise experimental or mathematical models.<br />
SCSh5. Students will demonstrate the computation <strong>and</strong> estimation skills necessary for<br />
analyzing data <strong>and</strong> developing reasonable scientific explanations.<br />
b. Consider possible effects <strong>of</strong> measurement errors on calculations.<br />
c. Recognize the relationship between accuracy <strong>and</strong> precision.<br />
d. Express appropriate numbers <strong>of</strong> significant figures for calculated data, using scientific<br />
notation where appropriate.
SC6. Students will underst<strong>and</strong> the effects motion <strong>of</strong> atoms <strong>and</strong> molecules in chemical <strong>and</strong><br />
physical processes.<br />
a. Compare <strong>and</strong> contrast atomic/molecular motion in solids, liquids, gases, <strong>and</strong> plasmas.<br />
b. Collect data <strong>and</strong> calculate the amount <strong>of</strong> heat given <strong>of</strong>f or taken in by chemical or<br />
physical processes.<br />
c. Analyzing (both conceptually <strong>and</strong> quantitatively) flow <strong>of</strong> energy during change <strong>of</strong><br />
state (phase).<br />
Duration<br />
90 minutes<br />
Materials <strong>and</strong> Equipment<br />
400-mL beaker<br />
10-mL graduated cylinder<br />
test tube<br />
salt<br />
ice<br />
water<br />
ring st<strong>and</strong><br />
utility clamp<br />
Technology Connection<br />
Vernier LabPro interface<br />
TI Graphing Calculator<br />
Vernier DataMate program<br />
Vernier Temperature Probe<br />
Procedures<br />
Step 1: Introduction/Motivation, 20 minutes<br />
If necessary, prep temperature probes, including calibration as outlined in the manual<br />
accompanying temperature probes.<br />
Put some ice cubes in a beaker containing warm water for the students to see. Elicit responses as<br />
to what is “really” happening (emphasis on the molecular level). Lead a discussion as to what<br />
happens to molecules <strong>of</strong> H 2 O in a given phase when in contact with other H 2 O molecules in a<br />
different phase (e.g., water vapor <strong>and</strong> ice, water <strong>and</strong> water vapor, water <strong>and</strong> ice).<br />
Molecules <strong>of</strong> a substance exhibit increasing disorder as phase changes from solid to liquid to<br />
gas. As disorder increases, so does the frequency <strong>of</strong> molecules <strong>of</strong> a substance colliding with each<br />
other <strong>and</strong> with their surroundings. Thus, the kinetic energy <strong>of</strong> molecules in a substance increases<br />
as disorder increases. Conversely, the potential energy <strong>of</strong> the molecules in a substance increases<br />
as the tendency <strong>of</strong> molecules to become disordered increases.<br />
Irrespective <strong>of</strong> the method <strong>of</strong> temperature observation (e.g., thermometer, temperature probe<br />
attached to electronic data collection device, etc.), graphs <strong>of</strong> temperature vs. time for water that<br />
is warming <strong>and</strong> for water that is cooling will have a characteristic appearance:
Cooling <strong>Water</strong><br />
Temperature<br />
Time<br />
Warming <strong>Water</strong><br />
Temperature<br />
Time<br />
Draw these graphs on the board for students to see <strong>and</strong> record. In both graphs, there is a region<br />
(bounded by the red bars) that represents the phase change <strong>of</strong> the water. In these intervals, there<br />
is no kinetic energy. However, potential energy is either increasing (as in the case during<br />
melting) or decreasing (as in the case during freezing) in these intervals.<br />
In this activity, students will record the cooling <strong>and</strong> warming <strong>of</strong> water for 15 minutes each using<br />
the LabPro with attached temperature probe. Using their calculators <strong>and</strong> the Vernier<br />
DATAMATE program, students will then select the region shown above as bounded by the red<br />
bars <strong>and</strong> take the mean <strong>of</strong> the range <strong>of</strong> values spanning this interval. These two mean values are<br />
to be interpreted as the freezing <strong>and</strong> melting points <strong>of</strong> water, respectively.<br />
Given this information as well as prior knowledge about the properties <strong>of</strong> water, ask students to<br />
share <strong>and</strong> record their hypotheses regarding the following:<br />
• What is the freezing point <strong>of</strong> water? the melting point?<br />
• Why would temperature stay stable for a given time as seen in the graphs (above, drawn<br />
on the board)?
Show students what the setup is supposed to look like, including initialization <strong>and</strong> preparation <strong>of</strong><br />
the probe, LabPro device, <strong>and</strong> calculator. Refer to the student activity h<strong>and</strong>out for visual. Have<br />
students look over the student activity h<strong>and</strong>out to anticipate the sequence <strong>of</strong> data entry <strong>and</strong><br />
button combinations on the TI calculators. Ask if there are any questions about the procedure (5<br />
minutes max).<br />
Step 2: Activity, 50 minutes<br />
Students will break up into groups <strong>and</strong> conduct activity “<strong>Freezing</strong> <strong>and</strong> <strong>Melting</strong> <strong>of</strong> <strong>Water</strong>” as<br />
outlined in student activity h<strong>and</strong>out.<br />
Recommendations:<br />
• It is recommended that 20 x 150 mm, 25 x 150 mm or 18 x 150 mm test tubes be used.<br />
<strong>Water</strong> samples <strong>of</strong> 5 mL work <strong>and</strong> 5 teaspoons <strong>of</strong> salt are recommended.<br />
• Students whose solutions are slow to reach the 0˚C plateau at the start <strong>of</strong> Trial 1 or slow<br />
to drop below 0˚C near the end <strong>of</strong> the trial may not have added enough salt or used<br />
adequate stirring to dissolve it.<br />
• Many samples will supercool. Stirring will bring the super-cooled water to the melting<br />
temperature plateau.<br />
• Remind students to collect data for the entire 15 minutes <strong>of</strong> each trial. If data collection is<br />
prematurely stopped, students will not be able to see both graphs simultaneously as<br />
described in Step 16 <strong>of</strong> the student activity h<strong>and</strong>out.<br />
Step 3: Review, 20 minutes<br />
Gather students as a class <strong>and</strong> discuss results, answers to the review questions given at the end <strong>of</strong><br />
the student h<strong>and</strong>out, <strong>and</strong> any problems or questions with the procedure. A brief mention should<br />
be made <strong>of</strong> the concepts <strong>of</strong> precision (repeatability <strong>of</strong> results) <strong>and</strong> accuracy (proximity to the<br />
“true” value) if there is an issue with the calculated freezing <strong>and</strong> melting points <strong>of</strong> water not<br />
being 32˚F/0˚C.<br />
Assessment<br />
Completed student worksheets will be collected <strong>and</strong> graded.<br />
Student underst<strong>and</strong>ing <strong>of</strong> activity components may be assessed by unit examination.<br />
Student affect <strong>and</strong> work ethic may be assessed by affect/ethic rubric.<br />
References<br />
Holmquist, D.D., R<strong>and</strong>all, J. & Volz, D. (2000). Chemistry with Calculators. pp. 1-1 – 1-T3.<br />
Vernier S<strong>of</strong>tware & Technology: Beaverton, Oregon.
<strong>Freezing</strong> <strong>and</strong> <strong>Melting</strong> <strong>of</strong> <strong>Water</strong><br />
<strong>Freezing</strong> temperature, the temperature at which a substance turns from liquid to solid, <strong>and</strong><br />
melting temperature, the temperature at which a substance turns from a solid to a liquid, are<br />
characteristic physical properties. In this experiment, the cooling <strong>and</strong> warming behavior <strong>of</strong> a<br />
familiar substance, water, will be investigated. By examining graphs <strong>of</strong> the data, the freezing <strong>and</strong><br />
melting temperatures <strong>of</strong> water will be determined <strong>and</strong> compared.<br />
Figure 1<br />
MATERIALS<br />
LabPro or CBL 2 interface<br />
TI Graphing Calculator<br />
DataMate program<br />
Temperature Probe<br />
ring st<strong>and</strong><br />
utility clamp<br />
400-mL beaker<br />
10-mL graduated cylinder<br />
test tube<br />
salt<br />
ice<br />
water<br />
PROCEDURE<br />
Part I <strong>Freezing</strong><br />
1. Put about 100 mL <strong>of</strong> water <strong>and</strong> 6 ice cubes into a 400-mL beaker.<br />
2. Put 5 mL <strong>of</strong> water into a test tube <strong>and</strong> use a utility clamp to fasten the test tube to a ring<br />
st<strong>and</strong>. The test tube should be situated above the water bath. Place the Temperature Probe<br />
into the water inside the test tube.<br />
3. Plug the Temperature Probe into Channel 1 <strong>of</strong> the LabPro or CBL 2 interface. Use the link<br />
cable to connect the TI Graphing Calculator to the interface. Firmly press in the cable ends.<br />
4. Turn on the calculator <strong>and</strong> start the DATAMATE program. Press CLEAR to reset the program.<br />
5. Set up the calculator <strong>and</strong> interface for the Temperature Probe.
a. Select SETUP from the main screen.<br />
b. If the calculator displays a Temperature Probe in CH 1, proceed directly to Step 6. If it<br />
does not, continue with this step to set up your sensor manually.<br />
c. Press ENTER to select CH 1.<br />
d. Select TEMPERATURE from the SELECT SENSOR menu.<br />
e. Select the Temperature Probe you are using (in °C) from the TEMPERATURE menu.<br />
6. Set up the data-collection mode.<br />
a. To select MODE, press once <strong>and</strong> press ENTER .<br />
b. Select TIME GRAPH from the SELECT MODE menu.<br />
c. Select CHANGE TIME SETTINGS from the TIME GRAPH SETTINGS menu.<br />
d. Enter “10” as the time between samples in seconds.<br />
e. Enter “90” as the number <strong>of</strong> samples. The length <strong>of</strong> the data collection will be 15 minutes.<br />
f. Select OK to return to the setup screen.<br />
g. Select OK again to return to the main screen.<br />
7. When everything is ready, select START to begin collecting data. Lower the test tube into the<br />
ice-water bath.<br />
8. Soon after lowering the test tube, add 5 spoons <strong>of</strong> salt to the beaker <strong>and</strong> stir with a stirring<br />
rod. Continue to stir the ice-water bath throughout the remainder <strong>of</strong> Part I.<br />
9. Slightly, but continuously, move the Temperature Probe during the first 10 minutes <strong>of</strong> Part I.<br />
Be careful to keep the probe in, <strong>and</strong> not above, the ice as it forms. When 10 minutes have<br />
gone by, stop moving the probe <strong>and</strong> allow it to freeze into the ice. Add more ice cubes to the<br />
beaker as the original ice cubes get smaller.<br />
10. Data collection will stop after 15 minutes. Keep the test tube submerged in the ice-water bath<br />
until Step 13.<br />
11. Analyze the flat part <strong>of</strong> the graph to determine the freezing temperature <strong>of</strong> water. To do this:<br />
a. Press ENTER to return to the main screen, then select ANALYZE.<br />
b. Select STATISTICS from the ANALYZE OPTIONS menu.<br />
c. Use to move the cursor to the beginning <strong>of</strong> the flat section <strong>of</strong> the curve. Press ENTER<br />
to select the left boundary <strong>of</strong> the flat section.<br />
d. Move the cursor to the end <strong>of</strong> the flat section <strong>of</strong> the graph, <strong>and</strong> press ENTER to select the<br />
right boundary <strong>of</strong> the flat section. The program will now calculate <strong>and</strong> display the<br />
statistics for the data between the two boundaries.<br />
e. Record the MEAN value as the freezing temperature in your data table (round to the<br />
nearest 0.1°C).<br />
f. Press ENTER to return to the ANALYZE OPTIONS menu, then select RETURN TO MAIN<br />
SCREEN.<br />
12. Store the data from the first run so that it can be used later. To do this:<br />
a. Select TOOLS from the main screen.<br />
b. Select STORE LATEST RUN from the TOOLS MENU.<br />
Part II <strong>Melting</strong>
13. Choose START to begin data collection, then raise the test tube <strong>and</strong> fasten it in a position<br />
above the ice-water bath. Do not move the Temperature Probe during Part II.<br />
14. Dispose <strong>of</strong> the ice water as directed by your teacher. Obtain 250 mL <strong>of</strong> warm tap water in the<br />
beaker. When 12 minutes have passed, lower the test tube <strong>and</strong> its contents into this warmwater<br />
bath.<br />
15. Data collection will stop after 15 minutes. Analyze the flat part <strong>of</strong> the graph to determine the<br />
melting temperature <strong>of</strong> water. To do this:<br />
a. Press ENTER to return to the main screen, then select ANALYZE.<br />
b. Select STATISTICS from the ANALYZE OPTIONS menu.<br />
c. Use to move the cursor to the beginning <strong>of</strong> the flat section <strong>of</strong> the curve. Press ENTER<br />
to select the left boundary <strong>of</strong> the flat section.<br />
d. Move the cursor to the end <strong>of</strong> the flat section <strong>of</strong> the graph, <strong>and</strong> press ENTER to select the<br />
right boundary <strong>of</strong> the flat section. The program will now calculate <strong>and</strong> display the<br />
statistics for the data between the two boundaries.<br />
e. Record the MEAN value as the freezing temperature in your data table (round to the<br />
nearest 0.1°C).<br />
f. Press ENTER to return to the ANALYZE OPTIONS menu, then select RETURN TO MAIN<br />
SCREEN.<br />
16. A good way to compare the freezing <strong>and</strong> melting curves is to view both sets <strong>of</strong> data on one<br />
graph.<br />
a. Select GRAPH from the main screen, then press ENTER .<br />
b. Select MORE, then select L2 AND L3 VS L1 from the MORE GRAPHS menu.<br />
c. Both temperature runs should now be displayed on the same graph. Each point <strong>of</strong> Part I<br />
(freezing) is plotted with a box, <strong>and</strong> each point <strong>of</strong> Part II (melting) is plotted with a dot.<br />
17. Print a graph <strong>of</strong> temperature vs. time (with two curves displayed). Label each curve as<br />
“freezing <strong>of</strong> water” or “melting <strong>of</strong> ice.”
Name_____________________________________________<br />
Data Table <strong>and</strong> Review Questions<br />
DATA TABLE<br />
<strong>Freezing</strong> temperature <strong>of</strong> water °C<br />
<strong>Melting</strong> temperature <strong>of</strong> water °C<br />
PROCESSING THE DATA<br />
1. What happened to the water temperature during freezing? During melting?<br />
2. According to your data <strong>and</strong> graph, what is the freezing temperature <strong>of</strong> water? The melting<br />
temperature? Express your answers to the nearest 0.1°C.<br />
3. How does the freezing temperature <strong>of</strong> water compare to its melting temperature?<br />
4. Tell if the kinetic energy <strong>of</strong> the water in the test tube increases, decreases, or remains the<br />
same in each <strong>of</strong> these time segments during the experiment when:<br />
a. the temperature is changing at the beginning <strong>and</strong> end <strong>of</strong> Part I<br />
b. the temperature remains constant in Part I<br />
c. the temperature is changing at the beginning <strong>and</strong> end <strong>of</strong> Part II<br />
d. the temperature remains constant in Part II<br />
5. In those parts <strong>of</strong> Question 4 in which there was no kinetic energy change, tell if potential<br />
energy increased or decreased.