Traffic Analysis and model synthesis of remote instrumentation - dorii
Traffic Analysis and model synthesis of remote instrumentation - dorii
Traffic Analysis and model synthesis of remote instrumentation - dorii

Create successful ePaper yourself
Turn your PDF publications into a flip-book with our unique Google optimized e-Paper software.
11 2001:760:2000::8 (2001:760:2000::8) 47.167 ms 47.023 ms 46.995 ms<br />
12 2001:760:2000:2000::28 (2001:760:2000:2000::28) 46.591 ms 46.575 ms 46.534 ms<br />
Browser<br />
Instrument element<br />
(EUCENTRE)<br />
2001:760:2000:2000::28<br />
Virtual control room<br />
(GRNET)<br />
2001:648:2320:7:250:56FF:FE9B:4806<br />
VCR<br />
Ipv6 connection<br />
Seismic<br />
Network<br />
Unversity <strong>of</strong><br />
Genoa through<br />
GARR<br />
Ipv4 connection<br />
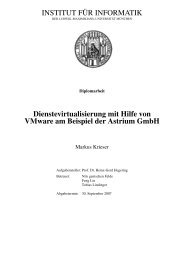
Figure 23 Test bed Setup<br />
Figure 23 summarizes the basic components <strong>of</strong> the DORII middleware <strong>and</strong> how they interact in this<br />
application. The web portal in the VCR acts as the user interface in order to perform all the<br />
operations. The IE is the gateway to the instrument that in this case is a seismic sensors network.<br />
The IE is in charge <strong>of</strong> the monitoring <strong>and</strong> local storage <strong>of</strong> seismograms, in case that a potential<br />
seismic event is detected.<br />
The user launches the following computation procedure: the files are moved to a SE in order to be<br />
accessed from everywhere in the grid domain. The executable is passed to a CE, which then stores<br />
the results back to the SE. The results are the input seismic data in binary format provided with the<br />
P-wave onset time reference. Moreover, the details <strong>of</strong> the event <strong>and</strong> the P wave are shown to the<br />
user through the VCR. It is clear that the workflow is made up <strong>of</strong> two different parts: interaction<br />
with instrument <strong>and</strong> computation.<br />
Furthermore, Figure 24 shows a snapshot concerning the monitoring <strong>of</strong> the IPv6 traffic between<br />
EUCENTRE <strong>and</strong> GRNET during a testing period.<br />
Finally, Figure 25 highlights a traffic trace between the VCR <strong>and</strong> the IE captured by using<br />
TCPDUMP.<br />
DSA1.5 PUBLIC 24