Advanced Python notes - Structural Bioinformatics Group
Advanced Python notes - Structural Bioinformatics Group
Advanced Python notes - Structural Bioinformatics Group

Create successful ePaper yourself
Turn your PDF publications into a flip-book with our unique Google optimized e-Paper software.
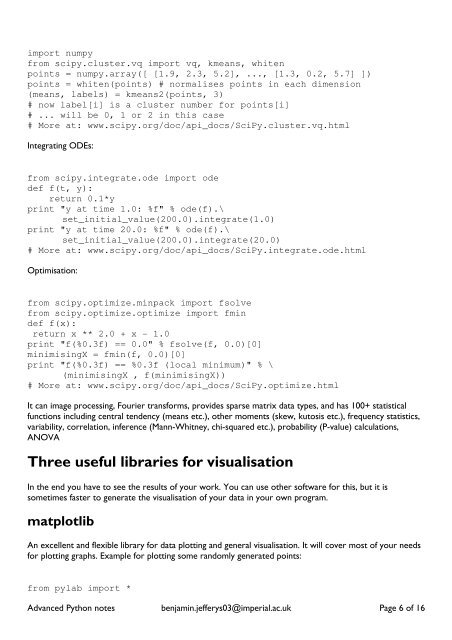
import numpy<br />
from scipy.cluster.vq import vq, kmeans, whiten<br />
points = numpy.array([ [1.9, 2.3, 5.2], ..., [1.3, 0.2, 5.7] ])<br />
points = whiten(points) # normalises points in each dimension<br />
(means, labels) = kmeans2(points, 3)<br />
# now label[i] is a cluster number for points[i]<br />
# ... will be 0, 1 or 2 in this case<br />
# More at: www.scipy.org/doc/api_docs/SciPy.cluster.vq.html<br />
Integrating ODEs:<br />
from scipy.integrate.ode import ode<br />
def f(t, y):<br />
return 0.1*y<br />
print "y at time 1.0: %f" % ode(f).\<br />
set_initial_value(200.0).integrate(1.0)<br />
print "y at time 20.0: %f" % ode(f).\<br />
set_initial_value(200.0).integrate(20.0)<br />
# More at: www.scipy.org/doc/api_docs/SciPy.integrate.ode.html<br />
Optimisation:<br />
from scipy.optimize.minpack import fsolve<br />
from scipy.optimize.optimize import fmin<br />
def f(x):<br />
return x ** 2.0 + x - 1.0<br />
print "f(%0.3f) == 0.0" % fsolve(f, 0.0)[0]<br />
minimisingX = fmin(f, 0.0)[0]<br />
print "f(%0.3f) == %0.3f (local minimum)" % \<br />
(minimisingX , f(minimisingX))<br />
# More at: www.scipy.org/doc/api_docs/SciPy.optimize.html<br />
It can image processing, Fourier transforms, provides sparse matrix data types, and has 100+ statistical<br />
functions including central tendency (means etc.), other moments (skew, kutosis etc.), frequency statistics,<br />
variability, correlation, inference (Mann-Whitney, chi-squared etc.), probability (P-value) calculations,<br />
ANOVA<br />
Three useful libraries for visualisation<br />
In the end you have to see the results of your work. You can use other software for this, but it is<br />
sometimes faster to generate the visualisation of your data in your own program.<br />
matplotlib<br />
An excellent and flexible library for data plotting and general visualisation. It will cover most of your needs<br />
for plotting graphs. Example for plotting some randomly generated points:<br />
from pylab import *<br />
<strong>Advanced</strong> <strong>Python</strong> <strong>notes</strong> benjamin.jefferys03@imperial.ac.uk Page 6 of 16