Physical, Chemical and Biological Properties of Submerged ...
Physical, Chemical and Biological Properties of Submerged ...
Physical, Chemical and Biological Properties of Submerged ...

You also want an ePaper? Increase the reach of your titles
YUMPU automatically turns print PDFs into web optimized ePapers that Google loves.
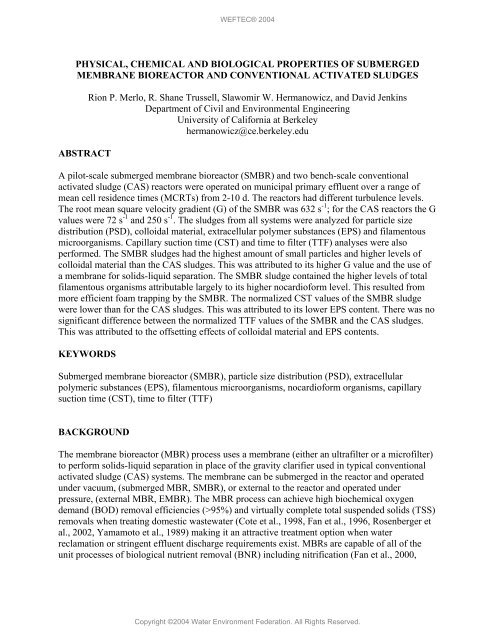
PHYSICAL, CHEMICAL AND BIOLOGICAL PROPERTIES OF SUBMERGED<br />
MEMBRANE BIOREACTOR AND CONVENTIONAL ACTIVATED SLUDGES<br />
ABSTRACT<br />
Rion P. Merlo, R. Shane Trussell, Slawomir W. Hermanowicz, <strong>and</strong> David Jenkins<br />
Department <strong>of</strong> Civil <strong>and</strong> Environmental Engineering<br />
University <strong>of</strong> California at Berkeley<br />
hermanowicz@ce.berkeley.edu<br />
A pilot-scale submerged membrane bioreactor (SMBR) <strong>and</strong> two bench-scale conventional<br />
activated sludge (CAS) reactors were operated on municipal primary effluent over a range <strong>of</strong><br />
mean cell residence times (MCRTs) from 2-10 d. The reactors had different turbulence levels.<br />
The root mean square velocity gradient (G) <strong>of</strong> the SMBR was 632 s -1 ; for the CAS reactors the G<br />
values were 72 s -1 <strong>and</strong> 250 s -1 . The sludges from all systems were analyzed for particle size<br />
distribution (PSD), colloidal material, extracellular polymer substances (EPS) <strong>and</strong> filamentous<br />
microorganisms. Capillary suction time (CST) <strong>and</strong> time to filter (TTF) analyses were also<br />
performed. The SMBR sludges had the highest amount <strong>of</strong> small particles <strong>and</strong> higher levels <strong>of</strong><br />
colloidal material than the CAS sludges. This was attributed to its higher G value <strong>and</strong> the use <strong>of</strong><br />
a membrane for solids-liquid separation. The SMBR sludge contained the higher levels <strong>of</strong> total<br />
filamentous organisms attributable largely to its higher nocardi<strong>of</strong>orm level. This resulted from<br />
more efficient foam trapping by the SMBR. The normalized CST values <strong>of</strong> the SMBR sludge<br />
were lower than for the CAS sludges. This was attributed to its lower EPS content. There was no<br />
significant difference between the normalized TTF values <strong>of</strong> the SMBR <strong>and</strong> the CAS sludges.<br />
This was attributed to the <strong>of</strong>fsetting effects <strong>of</strong> colloidal material <strong>and</strong> EPS contents.<br />
KEYWORDS<br />
<strong>Submerged</strong> membrane bioreactor (SMBR), particle size distribution (PSD), extracellular<br />
polymeric substances (EPS), filamentous microorganisms, nocardi<strong>of</strong>orm organisms, capillary<br />
suction time (CST), time to filter (TTF)<br />
BACKGROUND<br />
The membrane bioreactor (MBR) process uses a membrane (either an ultrafilter or a micr<strong>of</strong>ilter)<br />
to perform solids-liquid separation in place <strong>of</strong> the gravity clarifier used in typical conventional<br />
activated sludge (CAS) systems. The membrane can be submerged in the reactor <strong>and</strong> operated<br />
under vacuum, (submerged MBR, SMBR), or external to the reactor <strong>and</strong> operated under<br />
pressure, (external MBR, EMBR). The MBR process can achieve high biochemical oxygen<br />
dem<strong>and</strong> (BOD) removal efficiencies (>95%) <strong>and</strong> virtually complete total suspended solids (TSS)<br />
removals when treating domestic wastewater (Cote et al., 1998, Fan et al., 1996, Rosenberger et<br />
al., 2002, Yamamoto et al., 1989) making it an attractive treatment option when water<br />
reclamation or stringent effluent discharge requirements exist. MBRs are capable <strong>of</strong> all <strong>of</strong> the<br />
unit processes <strong>of</strong> biological nutrient removal (BNR) including nitrification (Fan et al., 2000,
Trouve et al., 1994), denitrification (Adham et al., 2000, Cote et al., 1997, Murakami et al.,<br />
2000) <strong>and</strong> enhanced biological phosphorus removal (EBPR) (Adam et al., 2002).<br />
In the SMBR, membrane fouling is controlled by using coarse bubble aeration <strong>of</strong> the membrane<br />
fibers to provide the cross-flow needed to prevent solids accumulation (Ueda et al., 1997). The<br />
use <strong>of</strong> the coarse bubble aeration for fouling control <strong>and</strong> a membrane for solids-liquid separation<br />
may influence the SMBR sludge properties. An underst<strong>and</strong>ing <strong>of</strong> sludge properties is needed to<br />
predict the behaviour <strong>of</strong> waste SMBR sludge thickening, digestion <strong>and</strong> dewatering processes.<br />
In this study, the physical, chemical <strong>and</strong> biological characteristics <strong>of</strong> CAS <strong>and</strong> SMBR sludges<br />
grown on municipal wastewater were evaluated. <strong>Properties</strong> evaluated were: particle size<br />
distribution (PSD), colloidal material content, extracellular polymeric substances (EPS)<br />
concentration, filamentous bacteria content, capillary suction time (CST) <strong>and</strong> time to filter<br />
(TTF).<br />
MATERIALS AND METHODS<br />
Wastewater characteristics<br />
All reactors were fed with primary effluent from the Southeast Water Pollution Control Plant<br />
(SEP), San Francisco, CA. The SMBR pilot plant was fed continuously through a line that took<br />
primary effluent directly from the SEP primary clarifier effluent channel. The CAS reactors were<br />
fed in the same way during the 10-d MCRT testing period. At all other times, the CAS reactors<br />
were fed from a tank that was filled <strong>and</strong> emptied daily to minimize seeding the reactors with<br />
filamentous organisms that grow on piping walls (Gabb et al., 1989). Reactor influent<br />
characteristics are presented in Table 1.<br />
Measurement <strong>of</strong> turbulence<br />
The root mean square velocity gradient (G) has been used as a measure <strong>of</strong> turbulence in several<br />
activated sludge studies (Das et al., 1993, Parker 1970). The G value for the SMBR <strong>and</strong> CAS<br />
reactors was calculated from:<br />
G ≅<br />
Q air Hγ w<br />
Vµ<br />
(1)<br />
where: G = root mean square velocity, s -1<br />
Q air = air flow, m 3 /s<br />
H = depth <strong>of</strong> water column, m<br />
γ w = specific weight <strong>of</strong> water, N/m 3<br />
µ = viscosity <strong>of</strong> water, Pa⋅s<br />
V = reactor volume, m 3
The viscosity <strong>and</strong> the specific weight <strong>of</strong> sludge were assumed to be the same as water at 20ºC<br />
(10 -3 Pa⋅s <strong>and</strong> 9800 N/m 3 , respectively). For the intermittently-aerated SMBR membrane tank,<br />
Q air was the air flow during aeration.<br />
Reactor Operation<br />
The reactors were operated at several MCRTs in the range <strong>of</strong> 2-10 d. Data collection for a given<br />
MCRT commenced only after at least 3 MCRT values at the target MCRT had elapsed. The<br />
dissolved oxygen (DO) concentration was always ≥2 mg/L in all reactors. For the SMBR, the<br />
MLSS concentration was held constant at 8 ± 2 g/L <strong>and</strong> the hydraulic retention time (HRT) was<br />
varied from 1.1 to 3.6 h. The HRT <strong>of</strong> the CAS reactors was held constant at 7.1 h, <strong>and</strong> the MLSS<br />
concentrations were varied from 0.7-3.0 g/L.<br />
SMBR pilot plant<br />
The SMBR was a pilot-scale ZenoGem ® (Zenon Environmental Services Inc., Burlington, ONT,<br />
Canada), submerged membrane system (Figure 1) containing one full-scale membrane module<br />
(60.4 m 2 surface area Zenon OCP ultrafilter, 0.035 µm nominal pore size). Solids are retained on<br />
the outside <strong>of</strong> the membrane, <strong>and</strong> permeate passes through the membrane into the interior <strong>of</strong> the<br />
hollow fibers. The SMBR consisted <strong>of</strong> an aeration tank <strong>and</strong> a membrane tank. Influent<br />
wastewater was pumped through a 3-mm screen to the aeration tank (757 L working volume),<br />
which was aerated through membrane diffusers fed with either compressed air or pure oxygen at<br />
a flow rate <strong>of</strong> 85 L/min. The membrane was submerged in the membrane tank (833 L working<br />
volume). Mixed liquor was pumped from the bottom <strong>of</strong> the aeration tank to the bottom <strong>of</strong> the<br />
membrane tank using either a high-shear centrifugal pump (Teel Model 1P70, W.W. Grainger<br />
Inc., Northbrook, IL) or a low-shear, lobe pump (Boerger LLC, Minneapolis, MN). When using<br />
the centrifugal pump, the SMBR is said to be under “higher shearing conditions” (SMBR H);<br />
when the lobe pump was in service, the SMBR is said to be under “lower shearing conditions”<br />
(SMBR L). Return mixed liquor flowed by gravity from the surface <strong>of</strong> the membrane tank back<br />
to the aeration tank surface. A vacuum pump downstream <strong>of</strong> the membrane provided transmembrane<br />
pressure to maintain a constant permeate flux <strong>of</strong> 30 L/m 2 ⋅h. Intermittent (10 s on/10 s<br />
<strong>of</strong>f) coarse bubble aeration at a flow <strong>of</strong> 850 L/min (G = 632 s -1 ) was used to control membrane<br />
fouling. The permeate vacuum pump was automatically turned <strong>of</strong>f for 30 s every 9 min. A<br />
portion <strong>of</strong> the membrane permeate could be returned to the membrane tank so that HRT could be<br />
controlled without changing either the tank volume or membrane flux. Waste SMBR sludge was<br />
removed continuously from the membrane tank using a peristaltic pump.<br />
Bench-scale CAS reactors<br />
The CAS reactors consisted <strong>of</strong> an aeration basin (10-L working volume) <strong>and</strong> a gravity clarifier<br />
(4-L working volume). Mixed liquor flowed by gravity from an aeration basin surface overflow<br />
to the gravity clarifier. Secondary effluent flowed over an unbaffled weir; settled sludge was<br />
continuously pumped back to the aeration basin. Waste sludge was removed from the aeration<br />
basin once per day at the 10, 5 <strong>and</strong> 4-d MCRT conditions <strong>and</strong> more frequently at the 3 <strong>and</strong> 2-d<br />
MCRT conditions. CAS A (G = 250 s -1 ) used coarse bubble aeration at a flow rate <strong>of</strong> 4.7 L/min.<br />
CAS B (G = 72 s -1 ) used fine bubble aeration at a flow rate <strong>of</strong> 0.5 L/min.
Particle size distribution (PSD)<br />
A sludge sample (5 mL for CAS reactors <strong>and</strong> 1 mL for the SMBR) was removed from each<br />
reactor with a wide-mouth pipette <strong>and</strong> placed in 1 L <strong>of</strong> particle-free SMBR effluent. The diluted<br />
sample was gently mixed with a magnetic stir bar to disperse the sludge evenly. The mounting<br />
<strong>and</strong> Methylene Blue staining procedures were adapted from Parker (1970). Samples were viewed<br />
under a light microscope at 200x magnification for the SMBR sludge, 100x for the CAS A<br />
sludge <strong>and</strong> 50x for the CAS B sludge. Digital photographs were taken <strong>of</strong> 20 r<strong>and</strong>om fields <strong>and</strong><br />
stored as TIF files (2048 by 1536 pixels, 24 bits/pixel) for image analysis. Each image was<br />
converted into an 8 bit gray image by extracting the green component <strong>of</strong> the original RGB color<br />
image then further scaled down to 1024 by 768 pixels to enhance contrast. The particles<br />
deposited on the filter appeared as dark objects on a lighter background. A suitable image<br />
threshold was selected from the maximum <strong>of</strong> the second derivative <strong>of</strong> the grayscale image<br />
histogram. After selecting a threshold, the selected objects were eroded <strong>and</strong> dilated to separate<br />
individual particles, <strong>and</strong> their geometric features were measured. Only particles completely<br />
visible in each image were counted <strong>and</strong> analyzed. Image processing was performed using Mocha<br />
s<strong>of</strong>tware (J<strong>and</strong>el Scientific, San Rafael, CA). Initial file conversion employed a procedure<br />
written in IDL (Research Systems Inc., Boulder, CO). Frequency distributions were reported as<br />
number <strong>of</strong> particles, <strong>and</strong> characteristic length was reported as the square root <strong>of</strong> the projected<br />
area. Other definitions <strong>of</strong> characteristic length (such as geometric mean <strong>of</strong> maximum <strong>and</strong><br />
minimum lengths, feret diameter) were also considered. They yielded identical trends. The lower<br />
particle size detection limit <strong>of</strong> the PSD analysis was 2 µm for CAS B sludge <strong>and</strong> 1 µm for the<br />
SMBR <strong>and</strong> CAS A sludges.<br />
Colloidal material<br />
Particles smaller than the detection limit <strong>of</strong> the PSD analysis (colloidal material) were assessed<br />
by turbidity measurements. Mixed liquor from each reactor was centrifuged for 2 min at 1000g<br />
<strong>and</strong> supernatant turbidity was measured using a Hach 2100N Turbidimeter (Hach Company,<br />
Lovel<strong>and</strong>, CO) following Wilen et al. (2000). This method measured the turbidity due to<br />
particles with diameters <strong>of</strong> approximately
the SMP concentration <strong>and</strong> the centrifuge supernatant <strong>of</strong> the sample after CER addition<br />
represented the sum <strong>of</strong> the SMP <strong>and</strong> EPS concentrations. The difference between these<br />
measurements was the EPS concentrations. Bovine serum albumin (BSA) was used as a protein<br />
st<strong>and</strong>ard, <strong>and</strong> dextrose was used as a carbohydrate st<strong>and</strong>ard.<br />
Total filamentous microorganisms<br />
The filament counting procedure <strong>of</strong> Pitt <strong>and</strong> Jenkins (1990) was modified to include all rather<br />
than only extended filamentous organisms. Intersections were counted on a Gram-stained<br />
preparation. Separate counts for nocardi<strong>of</strong>orm bacteria <strong>and</strong> for all other filamentous<br />
microorganisms were conducted. Results were expressed as “number <strong>of</strong> intersections/gTSS”.<br />
Capillary suction time (CST) <strong>and</strong> time to filter (TTF)<br />
CST was determined using a CST apparatus (Triton Electronics, Dunmow, Essex, UK) following<br />
St<strong>and</strong>ard Methods, Method 2710G (APHA et al., 1992). TTF was determined by St<strong>and</strong>ard<br />
Methods, Method 2710H (APHA et al., 1992). A 90-mm Buchner funnel was used to measure<br />
the time required to filter 100 mL <strong>of</strong> a 200 mL sample through Whatman No. 1 paper. CST <strong>and</strong><br />
TTF values were both normalized to MLSS concentration <strong>and</strong> expressed in units <strong>of</strong> s⋅L/gTSS.<br />
TSS, <strong>and</strong> chemical oxygen dem<strong>and</strong>(COD)<br />
TSS <strong>and</strong> total COD were measured by St<strong>and</strong>ard Methods, Methods 2540D <strong>and</strong> 5220D,<br />
respectively (APHA et al., 1992). Soluble COD was determined on samples filtered through a<br />
0.45 µm filter (St<strong>and</strong>ard Methods, Method 5220D (APHA et al., 1992)).<br />
RESULTS<br />
Reactor Performance<br />
Effluent characteristics from each reactor are shown in Table 2. The median SMBR effluent total<br />
CODs (18-32 mg/L) were much lower than for the CAS systems (65-86 mg/L) because the<br />
SMBR effluent, which is membrane filtered, contained undetectable (
detected the presence <strong>of</strong> an abundance <strong>of</strong> small particles (Choo <strong>and</strong> Lee 1998, Cicek et al., 1999,<br />
Luxmy et al., 2000, Shimizu et al., 1996, Wisniewski <strong>and</strong> Grasmick 1998, Wisniewski et al.,<br />
2000, Zhang et al., 1997). This likely results from the efficient retention by the membrane <strong>of</strong> the<br />
small particles produced by the high shear conditions in MBRs (in our SMBR the G value was<br />
632 s -1 ).<br />
The CAS B sludge (G = 72 s -1 ) had the typical bimodal PSD <strong>of</strong> activated sludge with peaks at 2-<br />
4 µm <strong>and</strong> 20-40 µm (Figures 2a <strong>and</strong> 2c). The highly-sheared CAS A sludge (G= 250 s -1 ) did not<br />
exhibit the bimodal distribution; its PSD was similar to those <strong>of</strong> the SMBR sludges (Figure 2d).<br />
Colloidal material content for all sludges is shown in Table 3. The SMBR sludges contained<br />
colloidal material levels (25-83 NTU) that were approximately one order <strong>of</strong> magnitude higher<br />
than either <strong>of</strong> the CAS sludges (2.6-5.9 NTU). There was no significant difference in the<br />
colloidal material content <strong>of</strong> the CAS A sludge (3.2-4.4 NTU) <strong>and</strong> the CAS B sludge (2.6-5.9<br />
NTU). The large difference in the colloidal material content <strong>of</strong> the SMBR <strong>and</strong> CAS sludges can<br />
be attributed to the difference in solids-liquid separation method used in these two reactor types.<br />
In the CAS reactors, the gravity settling used for solids separation does not retain colloidal<br />
material efficiently so it escapes in the secondary effluent. In the SMBR, the membrane pores are<br />
small enough to retain significant amounts <strong>of</strong> colloidal material so that most colloids (either<br />
those present in the influent that remain un-flocculated or those produced by floc dispersion)<br />
remain in the mixed liquor.<br />
<strong>Chemical</strong> <strong>Properties</strong><br />
The variation with MCRT <strong>of</strong> the total EPS, protein EPS <strong>and</strong> carbohydrate EPS contents <strong>of</strong> all<br />
sludges are shown in Figure 3. The EPS content (total, protein <strong>and</strong> carbohydrate) <strong>of</strong> the SMBR<br />
sludges was consistently lower than that <strong>of</strong> the CAS sludges. This difference increased as the<br />
MCRT decreased <strong>and</strong> was especially noticeable at the 3 <strong>and</strong> 2 d MCRTs (Figure 3). In the CAS<br />
sludges the increase in EPS content at the lower MCRTs was due to increases in both<br />
carbohydrate <strong>and</strong> protein EPS; in the SMBR sludges the carbohydrate EPS varied much more<br />
with MCRT than the protein EPS (Figures 3b <strong>and</strong> 3c). Liao et al. (2001), working with synthetic<br />
wastewater, found no relationship between MCRT (4-20 d) <strong>and</strong> total EPS although the<br />
carbohydrate content <strong>of</strong> the EPS increased at MCRT
<strong>Biological</strong> <strong>Properties</strong><br />
The SMBR sludges always contained about one order <strong>of</strong> magnitude more total filamentous<br />
organisms than the CAS sludges (Table 4). This difference could be just about completely<br />
accounted for by the presence <strong>of</strong> much higher nocardi<strong>of</strong>orm organism levels in the SMBR<br />
sludge. Of the total filamentous organism levels in the SMBR, >80% were nocardi<strong>of</strong>orms while<br />
in the CAS sludges an average <strong>of</strong> >80% were filamentous organisms other than nocardi<strong>of</strong>orms.<br />
High nocardi<strong>of</strong>orm levels in activated sludge require the presence <strong>of</strong> features that trap floating<br />
solids (including nocardi<strong>of</strong>orm foams) (Jenkins et al., 2003). Membrane separation <strong>of</strong> solids in<br />
SMBRs provided extremely efficient foam trapping while in the CAS units there was a free flow<br />
<strong>of</strong> surface material into the secondary effluent.<br />
Capillary Suction Time (CST)<br />
The normalized CSTs <strong>of</strong> the CAS sludges were higher than those <strong>of</strong> the SMBR sludges at all<br />
MCRTs tested (Figure 4). The normalized CSTs <strong>of</strong> both sludges increased at approximately the<br />
same constant rate over the MCRT ranges from 10 to 3d (CAS) <strong>and</strong> from 5 to 2 d (SMBR).<br />
Between a 3 <strong>and</strong> a 2 d MCRT the normalized CST <strong>of</strong> the CAS sludges increased dramatically.<br />
The normalized CSTs <strong>of</strong> both the CAS <strong>and</strong> SMBR sludges seem to be linearly related to the total<br />
EPS content <strong>of</strong> the sludges (Figure 5). There was not a similar positive correlation between the<br />
normalized CST <strong>of</strong> the sludges <strong>and</strong> their colloidal material contents. If colloidal material were<br />
important in determining normalized CST then one would expect that the normalized CSTs <strong>of</strong><br />
the SMBR sludges would be higher than those <strong>of</strong> the CAS sludges because the SMBR sludges<br />
contained much higher colloidal material levels than the CAS sludges (Table 3). In fact the<br />
opposite occurs. Figure 5 shows that the normalized CSTs for the SMBR sludges were lower<br />
than most <strong>of</strong> the CSTs for the CAS sludges.<br />
The CST test measures the time that it takes for water to move a given distance through a<br />
Whatman No. 17 chromatographic paper from a sludge sample under capillary suction. The<br />
relationships discussed above could be explained as follows “The EPS acts to bind the water to<br />
the sludge particles but the colloidal particles in the sludge do not interfere with the rate <strong>of</strong> the<br />
water movement through the filter paper pores.” Houghton et al., (2001), working with<br />
municipal activated sludges from multiple CAS plants, found a similar trend <strong>of</strong> normalized CST<br />
with total EPS concentration. The Houghton et al. (2001) work did not evaluate the effect <strong>of</strong><br />
colloidal material on normalized CST. In another study, Houghton <strong>and</strong> Stephenson (2002)<br />
measured EPS <strong>and</strong> particle size in anaerobic digester sludges <strong>and</strong> concluded it was the higher<br />
concentration <strong>of</strong> EPS <strong>and</strong> not the amount <strong>of</strong> small particles that increased the normalized CST<br />
values.<br />
Time to Filter (TTF)<br />
The normalized TTF results (Table 5) did not show a significant trend with MCRT. A single<br />
factor ANOVA analysis (α=0.05) <strong>of</strong> the data did not detect a significant difference between the<br />
normalized TTF values <strong>of</strong> the SMBR <strong>and</strong> CAS sludges for any condition tested. The TTF test<br />
measures the time required to filter (under suction) a given volume <strong>of</strong> water through a cake <strong>of</strong><br />
the sludge solids retained on a filter paper. Several workers have shown that high levels <strong>of</strong>
smaller particles decrease filtration rate (measured by the specific resistance to filtration, SRF)<br />
(Higgins <strong>and</strong> Novak 1997, Karr <strong>and</strong> Keinath 1978, Lawler et al., 1986, Mikkelsen <strong>and</strong> Keiding<br />
2002). Other workers showed that EPS content had an important influence on sludge filterability<br />
(Kang et al., 1989, Pere et al., 1993). We propose that both the EPS <strong>and</strong> colloidal material<br />
content <strong>of</strong> the sludge affect TTF. EPS binds water <strong>and</strong> makes it more difficult to remove by<br />
suction. Colloidal material blocks pores <strong>and</strong> makes it more difficult for water to pass through the<br />
cake (<strong>and</strong> the filter paper) into the filtrate. We propose that the normalized TTFs <strong>of</strong> the SMBR<br />
<strong>and</strong> CAS sludges did not differ because the effects <strong>of</strong> their colloidal material <strong>and</strong> EPS contents<br />
on normalized TTF <strong>of</strong>fset each other (Table 6).<br />
CONCLUSIONS<br />
1. SMBR effluent total COD concentrations were much lower than CAS effluent total COD<br />
concentrations at all MCRTs tested because <strong>of</strong> the absence <strong>of</strong> TSS in the SMBR effluent<br />
<strong>and</strong> because the SMBR effluent contained much lower soluble CODs than the CAS<br />
effluents, possibly because <strong>of</strong> the retention <strong>of</strong> some soluble <strong>and</strong> colloidal organic material<br />
by the membrane.<br />
2. At a 5-d MCRT, the SMBR <strong>and</strong> the high-shear CAS sludges had similar PSDs with high<br />
numbers <strong>of</strong> small particles (
to be a more rapid increase <strong>of</strong> normalized CST in the CAS sludge than in the SMBR<br />
sludge.<br />
7. The normalized CST values <strong>of</strong> both sludges were positively <strong>and</strong> linearly related to the<br />
total EPS content <strong>of</strong> the sludges. No such correlation existed between normalized CST<br />
<strong>and</strong> the colloidal material content <strong>of</strong> the sludges. In fact, the sludges with the highest<br />
colloidal material levels have the lowest normalized CST values. These results suggest<br />
that EPS was important in determining the value <strong>of</strong> the normalized CST but that colloidal<br />
material content was not.<br />
8. There did not appear to be any difference in normalized TTF for any <strong>of</strong> the sludges<br />
tested. It is postulated that this was because <strong>of</strong> the <strong>of</strong>fsetting effects <strong>of</strong> the high colloidal<br />
material/low EPS contents <strong>of</strong> the SMBR sludge <strong>and</strong> the low colloidal material/high EPS<br />
contents <strong>of</strong> the CAS sludges.<br />
ACKNOWLEDGEMENTS<br />
The project was funded in part by the Water Environment Research Foundation (WERF) project<br />
No. 01-CTS-19-UR. The authors thank Zenon Environmental Services, Inc. for the pilot SMBR<br />
<strong>and</strong> technical support; the City <strong>and</strong> County <strong>of</strong> San Francisco SEP- Engineering, Operations,<br />
Maintenance <strong>and</strong> Laboratory staff for support <strong>and</strong> technical assistance; <strong>and</strong> Ms. Eileen Deng for<br />
research assistance. At the time this work was conducted, Rion Merlo <strong>and</strong> Shane Trussell were<br />
doctoral c<strong>and</strong>idates, Slawomir Hermanowicz was Associate Pr<strong>of</strong>essor <strong>and</strong> David Jenkins was<br />
Pr<strong>of</strong>essor in the Graduate School, all at the Department <strong>of</strong> Civil <strong>and</strong> Environmental Engineering,<br />
University <strong>of</strong> California at Berkeley.
TABLES AND FIGURES<br />
Table 1. Influent characteristics.<br />
Analyte Units Median Range<br />
Total Alkalinity mg CaCO 3 /L 188 89 - 248<br />
Ammonia mg N/L 27 14 - 33<br />
COD mg/L 345 78 - 695<br />
TKN mg N/L 30 20 - 34<br />
TSS mg/L 99 57 - 242<br />
Table 2.<br />
Effluent characteristics <strong>of</strong> CAS <strong>and</strong> SMBR reactors.<br />
Soluble COD,<br />
mg/L<br />
TSS, mg/L Total COD, mg/L<br />
Ammonia, mg N/L<br />
MCRT,<br />
d Median Range Median Range Median Range Median Range<br />
Reactor<br />
CAS A 5 35 9 - 230 84 51 - >165 54 35 - 71 0.5 0.0 - 12<br />
4 18 7 - 31 76 59 - 99 55 47 - 69 1.5 0.5 - 14.<br />
3 19 9 - 38 81 58 - 98 51 44 - 111 1.4 0.8 - 6.8<br />
2 13 10 - 15 78 77 - 78 52 50 - 53 6.9 3.7 - 10<br />
-<br />
CAS B 10 31 9 - 134 83 48 - >165 49 34 - 116 0.1 0.0 - 0.8<br />
5 21 9 - 76 65 45 - 126 47 38 - 62 0.4 0.0 - 3.1<br />
4 22 12 - 83 78 65 - 140 54 42 - 66 1.5 0.8 - 13<br />
3 28 15 - 67 86 53 - 128 44 36 - 72 2.1 0.8 - 6.2<br />
2 15 10 - 17 80 76 - 83 52 51 - 54 8.2 6.5 - 9.9<br />
SMBR H 10 ND 23 17 - 45 23 17 - 45 0.1 0.0 - 0.5<br />
5 ND 24 10 - 30 24 10 - 30 0.2 0.0 - 1.6<br />
4 ND 24 19 - 39 24 19 - 39 0.5 0.4 - 0.8<br />
3 ND 22 19 - 27 22 19 - 27 0.5 0.2 - 0.5<br />
2 ND 32 25 - 35 32 25 - 35 7.7 0.4 - 13<br />
SMBR L 10 ND 18 17 - 22 18 17 - 22 0.3 0.1 - 0.5<br />
5 ND --- --- ---<br />
4 ND 24 20 - 32 24 20 - 32 0.6 0.4 - 3.3<br />
3 ND 23 21 - 29 23 21 - 29 0.6 0.4 - 0.7<br />
ND = non-detectable; detection limit = 2 mg/L
Table 3. Colloidal material content <strong>of</strong> CAS <strong>and</strong> SMBR sludges.<br />
Turbidity, NTU<br />
Reactor MCRT, d Median Range<br />
CAS A 5 3.2 1.9 -3.8<br />
4 4.4 3.2 -5.1<br />
3 4.0 1.6 -5.4<br />
2 3.3 3.2 -3.3<br />
CAS B 5 4.7 --- ---<br />
4 5.9 2.1 -13<br />
3 5.0 3.3 -6.7<br />
2 2.6 2.2 -3.1<br />
SMBR H 5 83 68 -84<br />
4 35 --- ---<br />
3 26 24 -28<br />
2 50 40 -56<br />
SMBR L 10 73 72 -98<br />
5 29 23 35<br />
4 29 8.9 -58<br />
3 25 --- ---<br />
Table 4. Filamentous microorganism levels in CAS <strong>and</strong> SMBR sludges.<br />
CAS A CAS B SMBR H SMBR L<br />
Filamentous organisms, log(intersections/gTSS)<br />
Nocardi<strong>of</strong>orm organisms 1.1x10 5 5.7x10 5 1.5x10 7 1.5x10 7<br />
Other filamentous organisms 7.0x10 5 1.6x10 6 3.1x10 6 2.8x10 6<br />
Total filamentous organisms 8.1x10 5 2.2x10 6 1.9x10 7 1.7x10 7<br />
Fraction <strong>of</strong> total filamentous organisms, %<br />
Nocardi<strong>of</strong>orm organisms 13 26 83 84<br />
Other filamentous organisms 87 74 17 16
Table 5. Normalized TTF values for CAS <strong>and</strong> SMBR sludges.<br />
Normalized TTF, s⋅L/gTSS<br />
Reactor MCRT, d Median Range<br />
CAS A 5 46 18 - 55<br />
4 24 16 - 43<br />
3 31 20 - 33<br />
2 26 25 - 35<br />
CAS B 10 15 9 - 55<br />
5 15 14 - 15<br />
4 19 10 - 58<br />
3 39 30 - 56<br />
2 36 29 - 51<br />
SMBR H 10 30 23 - 97<br />
5 35 28 - 44<br />
4 23 21 - 25<br />
3 27 22 - 28<br />
2 44 40 - 47<br />
SMBR L 10 60 57 - 60<br />
5 11 11 - 14<br />
4 27 21 - 35<br />
3 37 31 - 45<br />
Table 6. Offsetting effects <strong>of</strong> EPS <strong>and</strong> colloidal material on TTF.<br />
Colloidal Material<br />
Total EPS<br />
Sludge Type Content, NTU Effect on TTF Content, mg/gVSS Effect on TTF<br />
CAS Low (1.6-13) Small High (94-346) Large<br />
SMBR High (8.9-98) Large Low (79-130) Small
Figure 1.<br />
SMBR pilot plant schematic.<br />
Influent<br />
3-mm Screen<br />
3-Way Valve<br />
Effluent<br />
Membrane Tank<br />
WAS<br />
Aerobic Tank<br />
Compressed<br />
Air/Pure Oxygen<br />
High- or Low-<br />
Shear Pump<br />
Blower
Figure 2. PSD based on number frequency at 5-d MCRT for: a. all sludges; b. SMBR<br />
sludges; c. CAS sludges; <strong>and</strong> d. CAS A <strong>and</strong> SMBR sludges.<br />
a.<br />
CAS A CAS B SMBR H SMBR L b.<br />
SMBR H SMBR L<br />
0.5<br />
0.5<br />
0.4<br />
0.4<br />
Frequency<br />
0.3<br />
0.2<br />
0.3<br />
0.2<br />
c.<br />
0.1<br />
0.0<br />
1-2<br />
2-4<br />
4-6<br />
6-8<br />
8-10<br />
10-20<br />
20-40<br />
CAS A<br />
CAS B<br />
40-60<br />
60-80<br />
80-100<br />
100-1000<br />
d.<br />
0.1<br />
0.0<br />
1-2<br />
2-4<br />
4-6<br />
6-8<br />
8-10<br />
10-20<br />
20-40<br />
40-60<br />
60-80<br />
80-100<br />
100-1000<br />
CAS A SMBR H SMBR L<br />
0.5<br />
0.5<br />
0.4<br />
0.4<br />
0.3<br />
0.3<br />
0.2<br />
0.2<br />
0.1<br />
0.0<br />
1-2<br />
2-4<br />
4-6<br />
6-8<br />
Characteristic Length, µm<br />
8-10<br />
10-20<br />
20-40<br />
40-60<br />
60-80<br />
80-100<br />
100-1000<br />
0.1<br />
0.0<br />
1-2<br />
2-4<br />
4-6<br />
6-8<br />
Characteristic Length, µm<br />
8-10<br />
10-20<br />
20-40<br />
40-60<br />
60-80<br />
80-100<br />
100-1000
Figure 3.<br />
a.<br />
Median values for: a. total EPS; b. protein EPS <strong>and</strong>; c. carbohydrate EPS for<br />
CAS <strong>and</strong> SMBR sludges<br />
CAS A CAS B SMBR H SMBR L<br />
350<br />
300<br />
250<br />
200<br />
150<br />
100<br />
50<br />
0<br />
0 1 2 3 4 5 6 7 8 9 10<br />
MCRT, d<br />
b.<br />
CAS A CAS B SMBR H SMBR H<br />
300<br />
250<br />
200<br />
150<br />
100<br />
50<br />
0<br />
0 1 2 3 4 5 6 7 8 9 10<br />
MCRT, d<br />
c.<br />
CAS A CAS B SMBR H SMBR H<br />
70<br />
60<br />
50<br />
40<br />
30<br />
20<br />
10<br />
0<br />
0 1 2 3 4 5 6 7 8 9 10<br />
MCRT, d
Figure 4.<br />
Median normalized CST as a function <strong>of</strong> MCRT for CAS <strong>and</strong> SMBR<br />
sludges.<br />
CAS A CAS B SMBR H SMBR L<br />
30<br />
25<br />
20<br />
15<br />
10<br />
5<br />
0<br />
0 1 2 3 4 5 6 7 8 9 10<br />
MCRT, d<br />
Figure 5.<br />
30<br />
25<br />
Relationship between the normalized CST <strong>and</strong> total EPS for all sludges.<br />
CAS SMBR<br />
R 2 = 0.83<br />
20<br />
15<br />
10<br />
5<br />
0<br />
0 50 100 150 200 250 300 350<br />
Total EPS, mg/gVSS
REFERENCES<br />
Adam, C., Gnirss, R., Lesjean, B., Buisson, H. <strong>and</strong> Kraume, M. (2002) Enhanced biological<br />
phosphorus removal in membrane bioreactors. Water Sci. Technol., 46, 281.<br />
Adham, S., Merlo, R. <strong>and</strong> Gagliardo, P. (2000) Membrane Bioreactors for Water Reclamation-<br />
Phase II. Desalination Research <strong>and</strong> Development Program Report No. 60, Bureau <strong>of</strong><br />
Reclamation.<br />
APHA, AWWA <strong>and</strong> WEF (1992) St<strong>and</strong>ard Methods for the Examination <strong>of</strong> Water <strong>and</strong><br />
Wastewater 18th Ed. American Public Health Association, Washington DC.<br />
Choo, K. H. <strong>and</strong> Lee, C. H. (1998) Hydrodynamic behavior <strong>of</strong> anaerobic biosolids during<br />
crossflow filtration in the membrane anaerobic bioreactor. Water Res., 32, 3387.<br />
Cicek, N., Franco, J. P. <strong>and</strong> Suidan, M. T. (1999) Characterization <strong>and</strong> comparison <strong>of</strong> a<br />
membrane bioreactor <strong>and</strong> a conventional activated sludge system in the treatment <strong>of</strong><br />
wastewater containing high molecular weight compounds. Water Environ. Res., 71, 64.<br />
Cote, P., Buisson, H., Pound, C. <strong>and</strong> Arakaki, G. (1997) Immersed membrane activated sludge<br />
for the reuse <strong>of</strong> municipal wastewater. Desalination, 113, 189.<br />
Cote, P., Buisson, H. <strong>and</strong> Praderie, M. (1998) Immersed membranes activated sludge process<br />
applied to the treatment <strong>of</strong> municipal wastewater. Water Sci. Technol., 38, 437.<br />
Das, D., Keinath, T. M., Parker, D. S. <strong>and</strong> Wahlberg, E. J. (1993) Floc breakup in activated<br />
sludge plants. Water Environ. Res., 65, 138.<br />
Dubois, M., Gilles, K. A., Hamilton, J. K., Rebers, P. A. <strong>and</strong> Smith, F. (1956) Colorimetric<br />
method for determination <strong>of</strong> sugars <strong>and</strong> related substances. Anal. Chem., 28, 350.<br />
Fan, X. J., Urbain, V., Qian, Y. <strong>and</strong> Manem, J. (1996) Nitrification <strong>and</strong> mass balance with a<br />
membrane bioreactor for municipal wastewater treatment. Water Sci. Technol., 34, 129.<br />
Fan, X. J., Urbain, V., Qian, Y., Manem, J., Ng, W. J. <strong>and</strong> Ong, S. L. (2000) Nitrification in a<br />
membrane bioreactor (MBR) for wastewater treatment. Water Sci. Technol., 42, 289.<br />
Frolund, B., Palmgren, R., Keiding, K. <strong>and</strong> Nielsen, P. H. (1996) Extraction <strong>of</strong> extracellular<br />
polymers from activated sludge using a cation exchange resin. Water Res., 30, 1749.<br />
Gabb, D. M. D., Ekama, G. A., Jenkins, D. <strong>and</strong> Marais, G. V. (1989) Incidence <strong>of</strong> Sphaerotilus<br />
natans in laboratory scale activated sludge systems. Water Sci. Technol., 21, 29.<br />
Higgins, M. J. <strong>and</strong> Novak, J. T. (1997) The effect <strong>of</strong> cations on the settling <strong>and</strong> dewatering <strong>of</strong><br />
activated sludges: Laboratory results. Water Environ. Res., 69, 215.<br />
Houghton, J. I., Quarmby, J. <strong>and</strong> Stephenson, T. (2001) Municipal wastewater sludge<br />
dewaterability <strong>and</strong> the presence <strong>of</strong> microbial extracellular polymer. Water Sci. Technol.,<br />
44, 373.<br />
Houghton, J. I. <strong>and</strong> Stephenson, T. (2002) Effect <strong>of</strong> influent organic content on digested sludge<br />
extracellular polymer content <strong>and</strong> dewaterability. Water Res., 36, 3620.<br />
Jenkins, D., Richard, M. G. <strong>and</strong> Daigger, G. T. (2003) Manual on the Causes <strong>and</strong> Control <strong>of</strong><br />
Activated Sludge Bulking <strong>and</strong> Foaming <strong>and</strong> Other Solids Separation Problems. CRC<br />
Press/Lewis Publishers, Boca Raton, FL.<br />
Kang, S., Kishimoto, M., Shioya, S., Yoshida, T., Suga, K. <strong>and</strong> Taguchi, H. (1989) Dewatering<br />
characteristics <strong>of</strong> activated sludges <strong>and</strong> effect <strong>of</strong> extracellular polymer. J. Ferment.<br />
Bioeng., 68, 117.<br />
Karr, P. R. <strong>and</strong> Keinath, T. M. (1978) Influence <strong>of</strong> particle size on sludge dewaterability. J.<br />
Water Pollut. Control Fed., 50, 1911.
Lawler, D. F., Chung, Y. J., Hwang, S. J. <strong>and</strong> Hull, B. A. (1986) Anaerobic digestion: effects on<br />
particle size <strong>and</strong> dewaterability. J. Water Pollut. Control Fed., 58, 1107.<br />
Li, D. H. <strong>and</strong> Ganczarczyk, J. J. (1990) Structure <strong>of</strong> activated sludge flocs. Biotechnol. Bioeng.,<br />
35, 57.<br />
Lowry, O. H., Rosebrough, N. J., Farr, A. L. <strong>and</strong> R<strong>and</strong>all, R. J. (1951) Protein measurement with<br />
the folin phenol reagent. J. Biol. Chem., 193, 265.<br />
Luxmy, B. S., Nakajima, F. <strong>and</strong> Yamamoto, K. (2000) Predator grazing effect on bacterial size<br />
distribution <strong>and</strong> floc size variation in membrane-separation activated sludge. Water Sci.<br />
Technol., 42, 211.<br />
Mikkelsen, L. H. <strong>and</strong> Keiding, K. (2002) Physico-chemical characteristics <strong>of</strong> full scale sewage<br />
sludges with implications to dewatering. Water Res., 36, 2451.<br />
Murakami, T., Usui, J., Takamura, K. <strong>and</strong> Yoshikawa, T. (2000) Application <strong>of</strong> immersed-type<br />
membrane separation activated sludge process to municipal wastewater treatment. Water<br />
Sci. Technol., 41, 295.<br />
Pere, J., Alen, F., Viikari, L. <strong>and</strong> Eriksson, L. (1993) Characterization <strong>and</strong> dewatering <strong>of</strong><br />
activated sludge from the pulp <strong>and</strong> paper industry. Water Sci. Technol., 28, 193.<br />
Pitt, P. A. <strong>and</strong> Jenkins, D. (1990) Causes <strong>and</strong> control <strong>of</strong> Nocardia in activated sludge. J. Water<br />
Pollut. Control Fed., 62, 143.<br />
Rosenberger, S., Kruger, U., Witzig, R., Manz, W., Szewzyk, U. <strong>and</strong> Kraume, M. (2002)<br />
Performance <strong>of</strong> a bioreactor with submerged membranes for aerobic treatment <strong>of</strong><br />
municipal waste water. Water Res., 36, 413.<br />
Shimizu, Y., Uryu, K., Okuno, Y. <strong>and</strong> Watanabe, A. (1996) Cross-flow micr<strong>of</strong>iltration <strong>of</strong><br />
activated sludge using submerged membrane with air bubbling. J. Ferment. Bioeng., 81,<br />
55.<br />
Trouve, E., Urbain, V. <strong>and</strong> Manem, J. (1994) Treatment <strong>of</strong> municipal waste-water by a<br />
membrane bioreactor - results <strong>of</strong> a semiindustrial pilot-scale study. Water Sci. Technol.,<br />
30, 151.<br />
Ueda, T., Hata, K., Kikuoka, Y. <strong>and</strong> Seino, O. (1997) Effects <strong>of</strong> aeration on suction pressure in a<br />
submerged membrane bioreactor. Water Res., 31, 489.<br />
Urbain, V., Block, J. C. <strong>and</strong> Manem, J. (1993) Bi<strong>of</strong>locculation in activated sludge: an analytical<br />
approach. Water Res., 27, 829.<br />
Wilen, B. M., Keiding, K. <strong>and</strong> Nielsen, P. H. (2000) Anaerobic deflocculation <strong>and</strong> aerobic<br />
reflocculation <strong>of</strong> activated sludge. Water Res., 34, 3933.<br />
Wisniewski, C. <strong>and</strong> Grasmick, A. (1998) Floc size distribution in a membrane bioreactor <strong>and</strong><br />
consequences for membrane fouling. Colloid Surf. A-Physicochem. Eng. Asp., 138, 403.<br />
Wisniewski, C., Grasmick, A. <strong>and</strong> Cruz, A. L. (2000) Critical particle size in membrane<br />
bioreactors - Case <strong>of</strong> a denitrifying bacterial suspension. J. Membr. Sci., 178, 141.<br />
Yamamoto, K., Hiasa, M., Mahmood, T. <strong>and</strong> Matsuo, T. (1989) Direct solid-liquid separation<br />
using hollow fiber membrane in an activated-sludge aeration tank. Water Sci. Technol.,<br />
21, 43.<br />
Zhang, B., Yamamoto, K., Ohgaki, S. <strong>and</strong> Kamiko, N. (1997) Floc size distribution <strong>and</strong> bacterial<br />
activities in membrane separation activated sludge processes for small-scale wastewater<br />
treatment/reclamation. Water Sci. Technol., 35, 37.