Hierarchical Clustering with Concave Data Sets
Hierarchical Clustering with Concave Data Sets
Hierarchical Clustering with Concave Data Sets

Create successful ePaper yourself
Turn your PDF publications into a flip-book with our unique Google optimized e-Paper software.
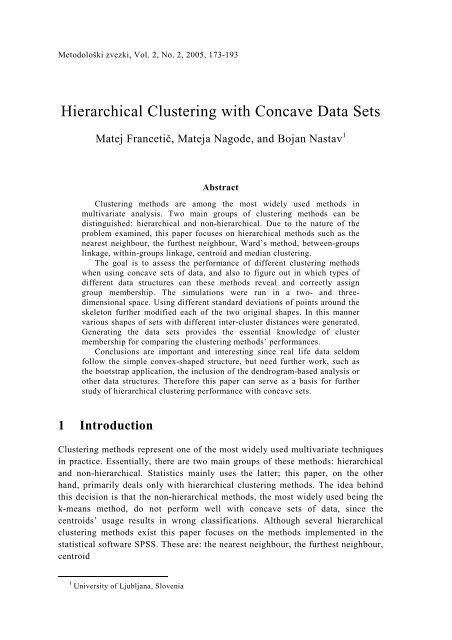
Metodološki zvezki, Vol. 2, No. 2, 2005, 173-193<br />
<strong>Hierarchical</strong> <strong>Clustering</strong> <strong>with</strong> <strong>Concave</strong> <strong>Data</strong> <strong>Sets</strong><br />
Matej Francetič, Mateja Nagode, and Bojan Nastav 1<br />
Abstract<br />
<strong>Clustering</strong> methods are among the most widely used methods in<br />
multivariate analysis. Two main groups of clustering methods can be<br />
distinguished: hierarchical and non-hierarchical. Due to the nature of the<br />
problem examined, this paper focuses on hierarchical methods such as the<br />
nearest neighbour, the furthest neighbour, Ward’s method, between-groups<br />
linkage, <strong>with</strong>in-groups linkage, centroid and median clustering.<br />
The goal is to assess the performance of different clustering methods<br />
when using concave sets of data, and also to figure out in which types of<br />
different data structures can these methods reveal and correctly assign<br />
group membership. The simulations were run in a two- and threedimensional<br />
space. Using different standard deviations of points around the<br />
skeleton further modified each of the two original shapes. In this manner<br />
various shapes of sets <strong>with</strong> different inter-cluster distances were generated.<br />
Generating the data sets provides the essential knowledge of cluster<br />
membership for comparing the clustering methods’ performances.<br />
Conclusions are important and interesting since real life data seldom<br />
follow the simple convex-shaped structure, but need further work, such as<br />
the bootstrap application, the inclusion of the dendrogram-based analysis or<br />
other data structures. Therefore this paper can serve as a basis for further<br />
study of hierarchical clustering performance <strong>with</strong> concave sets.<br />
1 Introduction<br />
<strong>Clustering</strong> methods represent one of the most widely used multivariate techniques<br />
in practice. Essentially, there are two main groups of these methods: hierarchical<br />
and non-hierarchical. Statistics mainly uses the latter; this paper, on the other<br />
hand, primarily deals only <strong>with</strong> hierarchical clustering methods. The idea behind<br />
this decision is that the non-hierarchical methods, the most widely used being the<br />
k-means method, do not perform well <strong>with</strong> concave sets of data, since the<br />
centroids’ usage results in wrong classifications. Although several hierarchical<br />
clustering methods exist this paper focuses on the methods implemented in the<br />
statistical software SPSS. These are: the nearest neighbour, the furthest neighbour,<br />
centroid<br />
1 University of Ljubljana, Slovenia
174 Matej Francetič, Mateja Nagode, and Bojan Nastav<br />
method, median clustering, linkage between groups and <strong>with</strong>in linkage groups, and<br />
Ward’s method. Due to high discrepancies in naming the methods, we will follow<br />
the SPSS wording.<br />
The primary aim of this paper is to assess the performance of different<br />
clustering methods when using concave sets of data and also to figure out in which<br />
types of different data structures these methods can reveal and correctly assign<br />
group membership. <strong>Sets</strong> of points differing in shape (skeleton) and inter-point<br />
distance were used in the analysis: the simulations were run in a two and threedimensional<br />
space <strong>with</strong> different standard deviations of points around the skeleton.<br />
Generating the sets of points gave an advantage, since the knowledge of cluster<br />
membership is essential in comparing the performances of clustering methods<br />
(perhaps better “in comparing”). In this manner various shapes of sets <strong>with</strong><br />
different inter-cluster distances were generated. Certain limitations were imposed<br />
since the used parameters can lead to a vast number of generated sets. Applying<br />
different hierarchical clustering methods to these generated sets was the basis for<br />
assessing clustering accuracy and by this the performance of different hierarchical<br />
clustering methods for concave sets of data. We have not come across any studies<br />
dealing <strong>with</strong> hierarchical clustering on concave data; the latter are however,<br />
mainly dealt <strong>with</strong> other, “modern” methods, such as the fuzzy or wave clustering<br />
(see section five).<br />
The paper consists of two parts. First we introduce the research methodology<br />
and briefly outline the methods used (section two). In the second part, a report of<br />
generating data sets is presented in section three and presentation of the results of<br />
successfulness of different clustering methods performed on the generated data in<br />
section four. Section five concludes the work and presents suggestions for possible<br />
further research.<br />
2 <strong>Clustering</strong><br />
<strong>Clustering</strong> is believed to be one of the mental activities that human beings have<br />
been using for centuries. Classifying objects into classes has improved the control<br />
over objects classified and deepened the understanding of different classes.<br />
Gathering and accumulation of knowledge would be of no practical use <strong>with</strong>out<br />
clustering (perhaps better “<strong>with</strong>out clustering”). Besides the spread of knowledge<br />
base time has also brought an advance in clustering methods. Nowadays, despite<br />
the mathematical and statistical primacy over the methods, other fields, especially<br />
medicine and marketing, find clustering as a very useful tool.<br />
The goal of clustering is to merge objects (units or variables) <strong>with</strong> regard to<br />
their characteristics and, by doing so, obtain internal homogeneity and external<br />
heterogeneity (isolation) of classes (clusters) produced. Characteristics, or better,<br />
the criteria according to which the objects are clustered, are usually, depending on<br />
the method used, based on the proximity matrix, which measures the objects’
<strong>Hierarchical</strong> <strong>Clustering</strong> With <strong>Concave</strong> <strong>Data</strong> <strong>Sets</strong> 175<br />
distances or similarities. Our work was based on hierarchical clustering in SPSS<br />
(see description of methods below) and distance was the tool used for measuring<br />
the similarity among objects. To be more precise, we have used Euclidian distance,<br />
which can be presented by the following equation (or graphically presented in<br />
Figure 1):<br />
1/ 2<br />
2<br />
⎛ p<br />
⎟ ⎞<br />
D ⎜<br />
ij<br />
=∑ X<br />
ik<br />
− X<br />
(2.1)<br />
jk<br />
⎝<br />
k = 1<br />
⎠<br />
Figure 1: Euclidian distance for two points A and B.<br />
Euclidian distance measures the actual (spatial) distance between two objects<br />
(Figure 1 gives a presentation of two-dimensional space, but can be applied to p<br />
variables using Equation (2.1)). Other distances could be used as well, such as<br />
Mahalonobis distance, which is a statistical distance (taking into account the<br />
standardization of units) between two points and includes covariances or<br />
correlations between variables (Sharma, 1996: 44). Applying this distance to our<br />
concave data sets would blur the picture: data would be “stretched” along some<br />
line in space and due to interlaced data its use would not lead to better results. The<br />
data used were generated (see chapter three) <strong>with</strong> no additional standardization<br />
and the Euclidian distance was applied. Choosing the tool to measure the distance<br />
is the first step. The second step is defined by the method and refers to the way<br />
this tool (distance) is applied among objects.<br />
2.1 <strong>Hierarchical</strong> clustering<br />
<strong>Hierarchical</strong> clustering is an iterative procedure for clustering objects. The starting<br />
point of hierarchical cluster analysis is a data matrix containing proximities<br />
between separate objects. At each hierarchical step, the two objects that are most<br />
similar, given certain criteria, depending on the method applied, are joined. A
176 Matej Francetič, Mateja Nagode, and Bojan Nastav<br />
joined pair is again called an object or a cluster. This means that at any<br />
hierarchical step (1) two single items may be clustered to form one new cluster, (2)<br />
a single item may be added to an existing cluster of items, or (3) two clusters may<br />
be combined into a single larger cluster. This process continues until all items are<br />
joined into only one cluster (Abswoude et al, 2004:337)<br />
2.1.1 Nearest neighbour 2<br />
The nearest neighbour method measures distance between clusters as the distance<br />
between two points in the clusters nearest to each other. It tends to cause clusters<br />
to merge, even when they are naturally distinct, as long as proximity between their<br />
outliers is short (Wolfson et al, 2004: 610). The effect of the algorithm that it<br />
tends to merge clusters is sometimes undesirable because it prevents the detection<br />
of clusters that are not well separated. On the other hand, the criteria might be<br />
useful to detect outliers in the data set (Mucha and Sofyan, 2003). This method<br />
turns out to be unsuitable when the clusters are not clearly separated but it is very<br />
useful when detecting chaining structured data (chaining effect).<br />
2.1.2 Furthest neighbour 3<br />
This method proceeds like the nearest neighbour method except that at the crucial<br />
step of revising the distance matrix, the maximum instead of the minimum<br />
distance is used to look for the new item (Mucha and Sofyan, 2003). That means<br />
that this method measures the distance between clusters through the distance<br />
between the two points in the clusters furthest from one another. Furthest<br />
neighbour results in separate clusters, even if the clusters fit together naturally, by<br />
maintaining clusters where outliers are far apart (Wolfson et al, 2004: 610). This<br />
method tends to produce very tight clusters of similar cases.<br />
2.1.3 Centroid method<br />
The centroid is defined as the centre of a cloud of points (Joining Clusters:<br />
<strong>Clustering</strong> Algorithms). Centroid linkage techniques attempt to determine the<br />
‘centre’ of the cluster. One issue is that the centre will move as clusters are<br />
merged. As a result, the distance between merged clusters may actually decrease<br />
between steps, making the analysis of results problematic. This is not the issue<br />
<strong>with</strong> single and complete linkage methods (Wolfson et al, 2004: 610). A problem<br />
<strong>with</strong> the centroid method is that some switching and reversal may take place, for<br />
2 Also called Single Linkage Method or Minimum Distance Method.<br />
3 Also called Complete Linkage or Maximum Distance Method.
<strong>Hierarchical</strong> <strong>Clustering</strong> With <strong>Concave</strong> <strong>Data</strong> <strong>Sets</strong> 177<br />
example as the agglomeration proceeds some cases may need to be switched from<br />
their original clusters (Joining Clusters: <strong>Clustering</strong> Algorithms).<br />
2.1.4 Median method<br />
This method is similar to the previous one. If the sizes of two groups are very<br />
different, then the centroid of the new group will be very close to that of the larger<br />
group and may remain <strong>with</strong>in that group. This is the disadvantage of the centroid<br />
method. For that reason, Gover (1967) suggests an alternative strategy, called the<br />
median method, because this method could be made suitable for both similarity<br />
and distance measures (Mucha and Sofyan, 2003). This method takes into<br />
consideration the size of a cluster, rather than a simple mean (Schnittker, 2000: 3).<br />
2.1.5 Linkage between groups 4<br />
The distance between two clusters is calculated as the average distance between all<br />
pairs of objects in the two different clusters. This method is also very efficient<br />
when the objects form naturally distinct ‘clumps’, however, it performs equally<br />
well <strong>with</strong> elongated, ‘chain’ type clusters (Cluster Analysis).<br />
2.1.6 Linkage <strong>with</strong>in groups 5<br />
This method is identical to the previous one, except that in the computations the<br />
size of the respective clusters (i.e. the number of objects contained in them) is<br />
used as a weight. Thus, this method should be used when the cluster sizes are<br />
suspected to be greatly uneven (Cluster Analysis).<br />
2.1.7 Ward's method<br />
The main difference between this method and the linkage methods is in the<br />
unification procedure. This method does not join groups <strong>with</strong> the smallest<br />
distance, but it rather joins groups that do not increase a given measure of<br />
heterogeneity by too much. The aim of Ward’s method is to unify the groups such<br />
that variation inside these groups does not increase too drastically. This results in<br />
clusters that are as homogenous as possible (Mucha and Sofyan, 2003). Ward’s<br />
method is based on the sum-of-squares approach and tends to create clusters of<br />
similar size. The only method to rely on analysis of variance, its underlying basis<br />
4 Unweighted Pair-Groups Method Average (UPGMA).<br />
5 Weighted Pair-Groups Method Average (WPGMA).
178 Matej Francetič, Mateja Nagode, and Bojan Nastav<br />
is closer to regression analysis than the other methods. It tends to produce clearly<br />
defined clusters (Wolfson et al, 2004: 610).<br />
3 <strong>Data</strong> generation<br />
The analysis is based on concave sets of points. For the purposes of this paper the<br />
data are generated in two and three-dimensional space, however, it is easy to<br />
extend this process to a more dimensional space. This process consists of three<br />
steps.<br />
The first step is the construction of the skeleton. The skeleton is an arbitrary<br />
curve in a more dimensional space. The curve is represented as the finite set of<br />
ordered points. The points that lie on the curve between these selected points can<br />
be approximated <strong>with</strong> linear or cubic interpolation.<br />
(a)<br />
(b)<br />
Figure 2: Linear (a) and cubic (b) interpolation.<br />
The use of linear interpolation in this paper is due to simplification of the<br />
calculations that are needed for further analysis. A better approximation of the<br />
target curve can also be achieved <strong>with</strong> a larger set of ordered points.<br />
(a)<br />
Figure 3: Chosen points before (a) and after (b) shifting.<br />
(b)
<strong>Hierarchical</strong> <strong>Clustering</strong> With <strong>Concave</strong> <strong>Data</strong> <strong>Sets</strong> 179<br />
The second step is choosing the sample points. In order to do this we have<br />
normalized the length of the curve so that an arbitrary point on the curve is given<br />
by S(t), where 0
180 Matej Francetič, Mateja Nagode, and Bojan Nastav<br />
2 2<br />
2<br />
Using this ( x + x + + x ) = σ<br />
E . ( h )<br />
2 3<br />
...<br />
n<br />
⎛ 1 ⎞<br />
( h ) ≅ σ ⎜ n −1<br />
+ ⎟<br />
⎠<br />
E is approximated <strong>with</strong>:<br />
σ E<br />
(3.3)<br />
⎝ 2 n −1<br />
The dispersion of points around the skeleton, r, is defined<br />
r<br />
S<br />
⎛ 1 ⎞ 2n<br />
−1<br />
= σ<br />
S<br />
⎜ n −1<br />
+ ⎟ = σ<br />
(3.4)<br />
S<br />
⎝ 2 n −1<br />
⎠ 2 n −1<br />
where σ S is standard deviation used in generating the points and n is the dimension<br />
of space, where skeleton S is situated.<br />
Lastly, some number is needed to represent the degree of separation of data<br />
separation. Regarding this number, each case could be assigned the troublesome<br />
(or not) classification of objects into clusters. Furthermore, this number will serve<br />
as a degree of admissibility <strong>with</strong> each of the clustering methods used, when, if at<br />
all, some of the methods will have higher tolerance or will be able to separate data<br />
and correctly assign objects to classes. This number will be called the degree of<br />
separation of data, marked by SLP.<br />
slp<br />
( S , S )<br />
1<br />
2<br />
( S , S )<br />
mr<br />
r S<br />
+ r S<br />
1 2<br />
= (3.5)<br />
1<br />
2<br />
where S 1 and S 2 are skeletons of groups of points, mr is their minimal distance, r S1<br />
and r S2 are respective dispersion of points.<br />
The paper tests hierarchical clustering methods on ten examples of concave<br />
data sets. Each of the examples has two groups of points and examples are<br />
different <strong>with</strong> regard to skeleton and used standard deviations of points around the<br />
skeleton. We have limited our work to two different pairs of skeletons. One pair is<br />
defined in two, the other in three-dimensional space (see Figure 4). Furthermore,<br />
to briefly test the stability of the methods applied, some of the examples have been<br />
re-run using subsampling (of 50%).
<strong>Hierarchical</strong> <strong>Clustering</strong> With <strong>Concave</strong> <strong>Data</strong> <strong>Sets</strong> 181<br />
(a)<br />
Figure 4: Pairs of two (a) and three-dimensional (b) skeletons.<br />
For further analysis, the minimal distance between the skeletons in the above<br />
examples has to be known. In case a), this is equal to 1. It is interesting that in this<br />
case the minimal distance is achieved in almost all of the points on the skeleton. In<br />
case b) the minimal distance equals 1 3 (approximately 0.58) and is achieved<br />
only four times (from 0.58 to 1). From this structure of the skeletons one might<br />
expect that clustering would, in the first case, be harder along the whole skeleton,<br />
whereas in the second case this harder clustering would occur only at the place<br />
where rings reach their minimal distance between the skeletons.<br />
In generating the data in each case the same standard deviation around the<br />
skeletons has been used. This was defined in a way to suit previously determined<br />
degree of separation of the data (SLP), which were chosen from the 1 – 2.5<br />
interval. The standard deviations used <strong>with</strong> each pair of the skeletons are given in<br />
the following table.<br />
With degree of separation of the data 2.5, the structures are well separated<br />
(there is practically no probability, that any of the points from one group would be<br />
closer to other skeleton); <strong>with</strong> SLP 1, the interlacing of the data is extreme. The<br />
following figure (Figure 5) shows the data <strong>with</strong> SLP 2 and 1.2.<br />
(b)<br />
4 Results<br />
The estimation and successfulness of the methods included is possible on the basis<br />
of the percentage of correctly assigned group membership that is known in<br />
advance. This, however, is almost never the case in real life. Therefore, in real<br />
data the performance of the method is seldom accurately assessed. This paper<br />
deals <strong>with</strong> generated data, which means that the real situation is known and<br />
measuring performances of different methods is therefore a rather easy task. Using<br />
the percentage of correctly assigned units (to the correct cluster) is the key<br />
indicator used in the analysis. Further on, when performing the methods <strong>with</strong><br />
statistical package SPSS classification into two groups was chosen. This produced<br />
the results <strong>with</strong> percentages from 50% (all cases were correctly classified just in
182 Matej Francetič, Mateja Nagode, and Bojan Nastav<br />
one group and the other group remained 'empty') to 100% (all cases were correctly<br />
classified in both groups) of correctly assigned group membership. Tables<br />
separated for two- and three-dimensional space present the results. The marginal<br />
examples (SLP=2.5 and SLP=1) together <strong>with</strong> the central (SLP=1.5) have been<br />
additionally subsampled and used on the methods more times (50) in order to<br />
obtain the notion of the methods’ stability. Thus, the method in this context<br />
appears to be stable if the average percentage of correctly assigned group<br />
membership of all subsamples does not vary much among different degrees of<br />
separation of the data.<br />
Table 1: Used standard deviations.<br />
SLP value 2.5 2 1.5 1.2 1<br />
a) 0.11 0.17 0.22 0.28 0.33<br />
b) 0.07 0.08 0.11 0.13 0.16<br />
a) b)<br />
c) d)<br />
Figure 5: Pictures of the data: a) 2D, SLP=2; b) 2D, SLP=1.2; c) 3D, SLP=2; d) 3D,<br />
SLP=1.2.<br />
The results of two-dimensional data gave the following conclusions. When the<br />
points are clearly separated, the only method that classifies all the cases correctly<br />
is the nearest neighbour. This method is the only method that is suitable for these
<strong>Hierarchical</strong> <strong>Clustering</strong> With <strong>Concave</strong> <strong>Data</strong> <strong>Sets</strong> 183<br />
types of data. Even when the groups are not (internally) cohesive but are isolated<br />
from each other the nearest neighbour method can produce correct results. Other<br />
methods do not fulfil the criterion of correctly assigned group membership <strong>with</strong><br />
such a high percentage. Nevertheless, the percentages are not so low and this is the<br />
consequence of great degree of separation of data.<br />
Table 2: Results of clustering <strong>with</strong> two-dimensional data.<br />
Correctly<br />
classified<br />
units (%)<br />
SLP=2,5 SLP=2 SLP=1,5<br />
1 2 Total 1 2 Total 1 2 Total<br />
METHOD<br />
Between 76,4 69,4 72,9 81,1 76,8 78,95 71,8 72,1 71,95<br />
Within 69,9 80,5 75,2 65,2 56,6 60,9 61,9 50,5 56,2<br />
Nearest 100 100 100 100 0,1 50,05 100 0,1 50,05<br />
Furthest 73,3 76,9 75,1 73,5 44,9 59,2 62,9 70,1 66,5<br />
Centroid 76,3 66,5 71,4 54,2 78,1 66,15 54,9 56,9 55,9<br />
Median 31,6 100 65,8 51,6 52,2 51,9 91,0 66,7 78,85<br />
Ward’s 72,5 48 60,25 77,6 68,2 72,9 73,2 78,6 75,9<br />
K-means 61,5 57,8 59,65 59 57 58 62,3 62,6 62,45<br />
Correctly<br />
classified<br />
units (%)<br />
SLP=1,2<br />
SLP=1<br />
1 2 Total 1 2 Total<br />
METHOD<br />
Between 74,2 73,6 73,9 50,7 50,6 50,65<br />
Within 49,7 61,9 55,8 77,9 69,6 73,75<br />
Nearest 100 0,1 50,05 100 0,1 50,05<br />
Furthest 41,2 92,7 66,95 66,5 86,4 76,45<br />
Centroid 100 0,1 50,05 100 0,1 50,05<br />
Median 90,7 19,9 55,3 100 0,1 50,05<br />
Ward’s 67,9 74,1 71 68,4 77,6 73<br />
K-means 59,9 59,9 59,9 66,5 63,6 65,05
184 Matej Francetič, Mateja Nagode, and Bojan Nastav<br />
Table 3: Results of clustering <strong>with</strong> three-dimensional data.<br />
Correctly<br />
classified<br />
units (%)<br />
SLP=2,5 SLP=2 SLP=1,5<br />
1 2 Total 1 2 Total 1 2 Total<br />
METHOD<br />
Between 100 59,3 79,65 100 74,2 87,1 100 66,9 83,45<br />
Within 100 53,3 76,65 55,8 100 77,9 99,9 60,5 80,2<br />
Nearest 100 100 100 100 0,1 50,05 100 0,1 50,05<br />
Furthest 100 75 87,5 100 63,6 81,8 55,2 94,1 74,65<br />
Centroid 100 52,1 76,05 100 51,6 75,8 100 0,1 50,05<br />
Median 100 31,3 65,65 100 44,5 72,25 100 2,4 51,2<br />
Ward’s 100 51,9 75,95 100 53,1 76,55 100 42,8 71,4<br />
K-means 75 74,1 74,55 71 77,7 74,35 74,7 75,5 75,1<br />
Correctly<br />
classified<br />
units (%)<br />
SLP=1,2<br />
SLP=1<br />
1 2 Total 1 2 Total<br />
METHOD<br />
Between 100 49,3 74,65 42,5 99,4 70,95<br />
Within 100 50,6 75,3 56,5 89,2 72,85<br />
Nearest 100 0,1 50,05 100 0,1 50,05<br />
Furthest 45,7 83,7 64,7 77,4 98,2 87,8<br />
Centroid 100 0,1 50,05 100 23,2 61,6<br />
Median 100 65,4 82,7 100 0,1 50,05<br />
Ward’s 100 49,7 74,85 100 42,2 71,1<br />
K-means 72,9 75,6 74,25 73,4 75,5 74,45<br />
Note: With SLP3 and SLP4, 75% and 60% samples, respectively, were used, due to technical<br />
problems <strong>with</strong> the software.<br />
Results obtained by using methods <strong>with</strong> next degree of separation are different<br />
from results obtained <strong>with</strong> the highest degree of separation. In this step the nearest<br />
neighbour method is completely unsuccessful. The average method performs <strong>with</strong><br />
a quite high percentage of correctly assigned units. For all further degrees of<br />
separation of the data the results are quite similar, except when observing the data<br />
<strong>with</strong> SLP=1. In that case there is no internal cohesion and no isolation between<br />
groups. With the smallest degree of separation of the data in a two-dimensional<br />
space the best performance is assigned to the furthest neighbour method, average
100 90<br />
90<br />
<strong>Hierarchical</strong> <strong>Clustering</strong> With <strong>Concave</strong> <strong>Data</strong> <strong>Sets</strong> 185<br />
method (between groups) and Ward's method. Ward's method seems to be the most<br />
stable method among the observed hierarchical methods. In almost all cases<br />
(except when the groups are clearly separated, but not cohesive) the successfulness<br />
of correctly assigned group membership is around 70%. This is not surprising<br />
since it is known that this method performs well and presents a compromise<br />
between chaining and compact data. However, the clusters formed are not “in line”<br />
<strong>with</strong> the skeletons generated, but rather compact clusters.<br />
50 60 70 80<br />
40<br />
100<br />
(a) 2-dimensional space<br />
Within Nearest Furthest Centroid Median Ward’s K-means slp0 slp1 slp2 slp3 slp4 Between<br />
50 60 70 80<br />
40<br />
(b) 3-dimensional space<br />
Figure 6: Results of all the methods used.<br />
Similar conclusions can be drawn when observing data and methods in a threedimensional<br />
space. Again, certainly the best method <strong>with</strong> the highest degree of<br />
data separation is nearest neighbour and we can conclude that it is the only method<br />
suitable for that kind of data. However, this is only the case when the data are<br />
clearly separated. When the degree of separation decreases, the method is no<br />
longer successful. The opposite holds for the lowest degree of data separation,<br />
where its performance turns out to be completely unsuccessful. In this case the<br />
average method (between and <strong>with</strong>in groups) performs better. Ward's method gives<br />
similar results and consequently similar conclusions as in a two-dimensional<br />
Within Nearest Furthest Centroid Median Ward’s K-means slp0 slp1 slp2 slp3 slp4 Between
186 Matej Francetič, Mateja Nagode, and Bojan Nastav<br />
space. In a three-dimensional space the furthest neighbour method gives the<br />
highest percentage (87.8%) of correctly assigned group membership <strong>with</strong> the<br />
lowest degree of data separation. With very similar percentage it performs also in<br />
the case of the highest degree of data separation. In both extreme cases the furthest<br />
neighbour performs <strong>with</strong> similar successfulness. This is to some extent surprising,<br />
since this method is believed to be the most successful <strong>with</strong> compact clusters and<br />
not <strong>with</strong> skeletons like this. At the same time, the results reveal that the clusters<br />
this method (and others) tend to produce are compact and do not follow the<br />
skeletons generated.<br />
5 Conclusions<br />
This paper is based on generated data and software (SPSS) usage. The latter was<br />
used to run and test all of the seven hierarchical clustering methods implemented<br />
in this software on previously generated data. These were obtained by dispersing<br />
points around two basic shapes of skeleton, both in two and three-dimensional<br />
space. In the paper, only one data set was used and in some examples further<br />
subsampling of these data was constructed in order to obtain some idea about the<br />
methods’ stability. The skeletons used represent rather hard-to-separate shapes<br />
and we have intentionally used such skeletons – if the method can work and be<br />
successful <strong>with</strong> such structures, it can be successful elsewhere as well.<br />
Unfortunately, very seldom can we come across less “tricky” data in real life<br />
problems. Despite this, using the generated data has given us the power to see<br />
which methods perform well and which do not and, relying on this, some<br />
conclusions can be drawn.<br />
Results in the form of tables (previous section) and figures (appendix) speak<br />
for themselves. Nevertheless, Figure 6 sums up the results of clustering.<br />
When implementing some of the variability obtained from the subsampling and<br />
rerunning the methods several (50) times, the methods appear to be more stable<br />
<strong>with</strong>in the given degrees of separation of the data. Based on these results, it is<br />
hard to recommend instructions on how to deal <strong>with</strong> such data, since no method<br />
used performs particularly well <strong>with</strong> the generated data. Some, i.e. the centroid,<br />
and the median methods appear to be more variable <strong>with</strong>in the given SLP, whereas<br />
the nearest neighbour method completely fails when the data are more interlaced<br />
(but it is stable given the other levels of SLP). Other methods are thus more<br />
appropriate regarding stability. Bearing in mind the fact that real life does not<br />
follow simple, homogeneous and isolated groups, only brief outlines can be put<br />
forward at this point.<br />
1. Check the data skeleton. This task seems rather simple for two or threedimensional<br />
data, but is otherwise virtually impossible. With several<br />
variables one can first use a data-reduction technique, such as the principal
<strong>Hierarchical</strong> <strong>Clustering</strong> With <strong>Concave</strong> <strong>Data</strong> <strong>Sets</strong> 187<br />
component analysis, and then, using fewer variables, the task of<br />
determining the proper skeleton to the data turns out to be much easier. An<br />
example of too-many-variables problems can be found in Gordon (1999:<br />
24, 25). If the skeleton(s) can be determined, take the following step.<br />
2. Compare these skeletons <strong>with</strong> the skeletons used in this assignment and<br />
determine the most similar skeletons, and choose the most appropriate<br />
method, given the skeleton and dispersion of points.<br />
Our findings can be further backed up by the following:<br />
3. Performance of clustering methods decreases <strong>with</strong> increased dispersion of<br />
the data, which is expected. In case when the criteria, such as the degree of<br />
separation of the data (SLP) used in this paper, are high enough (dispersion<br />
is low), the method to be used is the nearest neighbour. However, when the<br />
data are not so well isolated additional attention needs to be given to<br />
choosing the right method.<br />
4. Using three variables (a three-dimensional space), as opposed to a twodimensional<br />
space gives much better results (by several percentage points),<br />
meaning that three variables can better determine the proper data structure.<br />
However, one should keep in mind the previously mentioned too-manyvariables<br />
problems (Point 1), which we can come across in reality. Using<br />
(at least) three variables is thus advised.<br />
Separate from this paper’s main focus, i.e. the hierarchical clustering methods,<br />
new methods are being developed and used. They apply to different fields and are<br />
usually custom made for each type of analysis. Intuitively speaking, they would<br />
follow point one of the above mentioned points and (algebraically) determine the<br />
skeleton; furthermore, by applying the Euclidian distance, objects would be<br />
classified. Phrases such as “fuzzy clustering” are used, describing the situation<br />
where some objects are <strong>with</strong> certainty classified to one group, while the others<br />
could be in one or the other group. Similarly, overlapping groups where objects are<br />
in one and the other groups need special attention. Wave clustering, introduced by<br />
Sheikholeslami, Chatterjec and Zhang (1998) is a method, which presumably<br />
works well <strong>with</strong> concave data sets. Our task was not to focus on such methods, but<br />
we cannot avoid mentioning them at this point. Additional reading can be found in<br />
Gordon (1999: 111-130) and a series of scientific articles using clustering methods<br />
in practise, mainly medical studies.<br />
Further improvements to this paper could be made by generating several<br />
random data sets <strong>with</strong> given parameters (skeleton, degree of separation of data)<br />
and running the methods on these data. The described process would allow to test<br />
the methods more broadly for their variability among different degrees of<br />
separation of data. We believe that observing the obtained dendrograms is a good<br />
tool to be used <strong>with</strong> clustering since to a certain degree, they can reveal the real
188 Matej Francetič, Mateja Nagode, and Bojan Nastav<br />
structure of the data. However, their usage is again limited – figures in the<br />
appendix show that only <strong>with</strong> the highest degrees of separation of the data, SLP=1<br />
in Figure 7, they can be used to determine the proper clustering. However,<br />
dendrograms were not under close inspection in this analysis and therefore, along<br />
<strong>with</strong> other data structure, this represents a point to be studied further in details.<br />
References<br />
[1] van Abswoude, A.A.H, Vermunt, J.K., Hemker, B.T., and van der Ark, L.A.<br />
(2004): Mokken Scale Analysis Using <strong>Hierarchical</strong> <strong>Clustering</strong> Procedures:<br />
Applied Psychological Measurement, 5, 332-354.<br />
[2] Aldenderfer, S.M. and Blashfield, K.R. (1984): Cluster Analysis. Series:<br />
Quantitative Applications in the Social Sciences, 44. Sage Publications.<br />
[3] CL Algorithm Details.<br />
http://ei.cs.vt.edu/~cs5604/f95/cs5604cnCL/CL-alg-details.html, 19.08.2004.<br />
[4] Cluster Analysis. http://www.statsoft.com/textbook/stcluan.html, 19.08.2004.<br />
[5] Ferligoj, A. (1989): Razvrščanje v skupine. Teorija in uporaba v<br />
družboslovju. Metodološki zvezki, 4, Ljubljana.<br />
[6] Field, A. (2000): Cluster Analysis.<br />
[7] http://www.sussex.ac.uk/Users/andyf/teaching/pg/cluster.pdf, 19.08.2004.<br />
[8] Gordon, A.D. (1999): Classification. New York: Chapman&Hall/CRC,.<br />
[9] Joining Clusters: <strong>Clustering</strong> Algorithms.<br />
http://149.170.199.144/multivar/ca_alg.htm, 19.08.2004.<br />
[10] Mucha, H-J. and Sofyan H. (2003): Cluster Analysis.<br />
http://www.xplore-stat.de/tutorials/clustnode3.html, 15.08.2004.<br />
[11] Schnittker, J. (2000): Cluster Analysis Presentation.<br />
http://www.indiana.edu/~socsrp/cluster_analysis.pdf, 15.8.2004.<br />
[12] Sharma, S. (1996): Applied Multivariate Techniques. John Wiley&Sons, Inc.,<br />
New York.<br />
[13] Sheikholeslami G., Chatterjec S., and Zhang A. (1998): WaveCluster: A<br />
Multi-Resolution <strong>Clustering</strong> Approach for Very Large Spatial <strong>Data</strong>bases.<br />
http://www.cs.sfu.ca/CourseCentral/459/han/papers/sheikholeslami98.pdf,<br />
05.10.2004.<br />
[14] SPSS Statistical Algorithms. SPSS Inc., 1985.<br />
[15] Wolfson, M., Madjd-Sadjadi, Z., and James, P. (2004): Identifying national<br />
types: A cluster analysis of politics, economics and conflict. Journal of Peace<br />
Research, 5, 607-623.
<strong>Hierarchical</strong> <strong>Clustering</strong> With <strong>Concave</strong> <strong>Data</strong> <strong>Sets</strong> 189<br />
Appendix<br />
Figure 7: Dendrogram for SLP=2. Two groups can be clearly distinguished.<br />
Figure 8: Dendrogram for SLP=1.5. Number of groups is not clearly seen.
190 Matej Francetič, Mateja Nagode, and Bojan Nastav<br />
ORIGINAL SKELETON<br />
BETWEEN<br />
3<br />
3<br />
2<br />
2<br />
1<br />
1<br />
0<br />
0<br />
-1<br />
-1<br />
X<br />
-2<br />
-3<br />
Y<br />
-2<br />
-1<br />
NEAREST<br />
0<br />
1<br />
2<br />
3<br />
X<br />
-2<br />
-3<br />
Y<br />
-2<br />
-1<br />
FURTHEST<br />
0<br />
1<br />
2<br />
3<br />
3<br />
3<br />
2<br />
2<br />
1<br />
1<br />
0<br />
0<br />
-1<br />
-1<br />
X<br />
-2<br />
-3<br />
Y<br />
-2<br />
-1<br />
MEDIAN<br />
0<br />
1<br />
2<br />
3<br />
X<br />
-2<br />
-3<br />
Y<br />
-2<br />
-1<br />
0<br />
WARD<br />
1<br />
2<br />
3<br />
3<br />
3<br />
2<br />
2<br />
1<br />
1<br />
0<br />
0<br />
-1<br />
-1<br />
X<br />
-2<br />
-3<br />
Y<br />
-2<br />
-1<br />
0<br />
WITHIN<br />
1<br />
2<br />
3<br />
X<br />
-2<br />
-3<br />
Y<br />
-2<br />
-1<br />
CENTROID<br />
0<br />
1<br />
2<br />
3<br />
3<br />
3<br />
2<br />
2<br />
1<br />
1<br />
0<br />
0<br />
-1<br />
-1<br />
X<br />
-2<br />
-3<br />
-2<br />
-1<br />
0<br />
1<br />
2<br />
3<br />
X<br />
-2<br />
-3<br />
-2<br />
-1<br />
0<br />
1<br />
2<br />
3<br />
Y<br />
Y<br />
Figure 9: Graphical representation of results for 2D <strong>with</strong> SLP=2.5.
<strong>Hierarchical</strong> <strong>Clustering</strong> With <strong>Concave</strong> <strong>Data</strong> <strong>Sets</strong> 191<br />
ORIGINAL SKELETON<br />
BETWEEN<br />
4<br />
4<br />
3<br />
3<br />
2<br />
2<br />
1<br />
1<br />
0<br />
0<br />
-1<br />
-1<br />
X<br />
-2<br />
-4<br />
Y<br />
-3<br />
-2 -1 0<br />
NEAREST<br />
1<br />
2<br />
3<br />
X<br />
-2<br />
-4<br />
Y<br />
-3<br />
-2 -1 0<br />
FURTHEST<br />
1<br />
2<br />
3<br />
4<br />
4<br />
3<br />
3<br />
2<br />
2<br />
1<br />
1<br />
0<br />
0<br />
-1<br />
-1<br />
X<br />
-2<br />
-4<br />
Y<br />
-3<br />
-2 -1 0<br />
MEDIAN<br />
1<br />
2<br />
3<br />
X<br />
-2<br />
-4<br />
Y<br />
-3<br />
-2 -1 0<br />
WARD<br />
1<br />
2<br />
3<br />
4<br />
4<br />
3<br />
3<br />
2<br />
2<br />
1<br />
1<br />
0<br />
0<br />
-1<br />
-1<br />
X<br />
-2<br />
-4<br />
Y<br />
-3<br />
-2 -1 0<br />
WITHIN<br />
1<br />
2<br />
3<br />
X<br />
-2<br />
-4<br />
Y<br />
-3<br />
-2 -1 0<br />
CENTROID<br />
1<br />
2<br />
3<br />
4<br />
4<br />
3<br />
3<br />
2<br />
2<br />
1<br />
1<br />
0<br />
0<br />
-1<br />
-1<br />
X<br />
-2<br />
-4<br />
-3<br />
-2<br />
-1<br />
0<br />
1<br />
2<br />
3<br />
X<br />
-2<br />
-4<br />
-3<br />
-2<br />
-1<br />
0<br />
1<br />
2<br />
3<br />
Y<br />
Y<br />
Figure 10: Graphical representation of results for 2D <strong>with</strong> SLP=1.
192 Matej Francetič, Mateja Nagode, and Bojan Nastav<br />
ORIGINAL SKELETON<br />
BETWEEN<br />
1.5<br />
1.5<br />
X<br />
-1<br />
0<br />
1.0<br />
1.0<br />
1<br />
2<br />
.5<br />
.5<br />
3<br />
Z<br />
Y<br />
0.0<br />
0.0<br />
-.5<br />
-.5<br />
-1.0<br />
-1.0<br />
1.5<br />
1.5<br />
X<br />
-1<br />
0<br />
1.0<br />
1.0<br />
1<br />
2<br />
.5<br />
.5<br />
3<br />
Z<br />
Y<br />
0.0<br />
0.0<br />
-.5<br />
-.5<br />
-1.0<br />
-1.0<br />
NEAREST<br />
FURTHEST<br />
1.5<br />
1.5<br />
X<br />
-1<br />
0<br />
1.0<br />
1.0<br />
1<br />
2<br />
.5<br />
.5<br />
3<br />
Z<br />
Y<br />
0.0<br />
0.0<br />
-.5<br />
-.5<br />
-1.0<br />
-1.0<br />
1.5<br />
1.5<br />
X<br />
-1<br />
0<br />
1.0<br />
1.0<br />
1<br />
2<br />
.5<br />
.5<br />
3<br />
Z<br />
Y<br />
0.0<br />
0.0<br />
-.5<br />
-.5<br />
-1.0<br />
-1.0<br />
MEDIAN<br />
WARD<br />
1.5<br />
1.5<br />
X<br />
-1<br />
0<br />
1.0<br />
1.0<br />
1<br />
2<br />
.5<br />
.5<br />
3<br />
Z<br />
Y<br />
0.0<br />
0.0<br />
-.5<br />
-.5<br />
-1.0<br />
-1.0<br />
1.5<br />
1.5<br />
X<br />
-1<br />
0<br />
1.0<br />
1.0<br />
1<br />
2<br />
.5<br />
.5<br />
3<br />
Z<br />
Y<br />
0.0<br />
0.0<br />
-.5<br />
-.5<br />
-1.0<br />
-1.0<br />
WITHIN<br />
CENTROID<br />
1.5<br />
1.5<br />
X<br />
-1<br />
0<br />
1.0<br />
1.0<br />
1<br />
2<br />
.5<br />
.5<br />
3<br />
Z<br />
Y<br />
0.0<br />
0.0<br />
-.5<br />
-.5<br />
-1.0<br />
-1.0<br />
1.5<br />
1.5<br />
X<br />
-1<br />
0<br />
1.0<br />
1.0<br />
1<br />
2<br />
.5<br />
.5<br />
3<br />
Z<br />
Y<br />
0.0<br />
0.0<br />
-.5<br />
-.5<br />
-1.0<br />
-1.0<br />
Figure 11: Graphical representation of results for 3D <strong>with</strong> SLP=2.5.
<strong>Hierarchical</strong> <strong>Clustering</strong> With <strong>Concave</strong> <strong>Data</strong> <strong>Sets</strong> 193<br />
ORIGINAL SKELETON<br />
BETWEEN<br />
3<br />
3<br />
2<br />
2<br />
X<br />
1<br />
0<br />
X<br />
1<br />
0<br />
-1<br />
-1<br />
2.0<br />
1.5<br />
1.0<br />
1.5<br />
.5<br />
1.0<br />
.5<br />
0.0<br />
0.0<br />
-.5 -1.0<br />
-.5<br />
-1.0 -1.5<br />
Y<br />
Z<br />
1.5<br />
1.0<br />
.5<br />
0.0<br />
-.5<br />
-1.0<br />
Y<br />
.5<br />
0.0<br />
-.5<br />
-1.0<br />
Z<br />
1.5<br />
1.0<br />
NEAREST<br />
FURTHEST<br />
3<br />
3<br />
2<br />
2<br />
X<br />
1<br />
0<br />
X<br />
1<br />
0<br />
-1<br />
-1<br />
1.5<br />
1.0<br />
.5<br />
0.0<br />
-.5<br />
-1.0<br />
Y<br />
.5<br />
0.0<br />
-.5<br />
-1.0<br />
Z<br />
1.0<br />
1.5<br />
1.5<br />
1.0<br />
.5<br />
0.0<br />
-.5<br />
-1.0<br />
Y<br />
.5<br />
0.0<br />
-.5<br />
-1.0<br />
Z<br />
1.5<br />
1.0<br />
MEDIAN<br />
WARD<br />
3<br />
3<br />
2<br />
2<br />
X<br />
1<br />
0<br />
X<br />
1<br />
0<br />
-1<br />
-1<br />
1.5<br />
1.0<br />
.5<br />
0.0<br />
-.5<br />
-1.0<br />
Y<br />
.5<br />
0.0<br />
-.5<br />
-1.0<br />
Z<br />
1.0<br />
1.5<br />
1.5<br />
1.0<br />
.5<br />
0.0<br />
-.5<br />
-1.0<br />
Y<br />
.5<br />
0.0<br />
-.5<br />
-1.0<br />
Z<br />
1.5<br />
1.0<br />
WITHIN<br />
CENTROID<br />
3<br />
3<br />
2<br />
2<br />
X<br />
1<br />
X<br />
1<br />
0<br />
0<br />
-1<br />
-1<br />
1.5<br />
1.0<br />
.5<br />
0.0<br />
-.5<br />
-1.0<br />
Y<br />
.5<br />
0.0<br />
-.5<br />
-1.0<br />
Z<br />
1.5<br />
1.0<br />
1.5<br />
1.0<br />
.5<br />
0.0<br />
-.5<br />
-1.0<br />
Y<br />
.5<br />
0.0<br />
-.5<br />
-1.0<br />
Z<br />
1.5<br />
1.0<br />
Figure 12: Graphical representation of results for 3D <strong>with</strong> SLP=1.