EOR Economic Analysis - Midwestern Governors Association
EOR Economic Analysis - Midwestern Governors Association
EOR Economic Analysis - Midwestern Governors Association

Create successful ePaper yourself
Turn your PDF publications into a flip-book with our unique Google optimized e-Paper software.
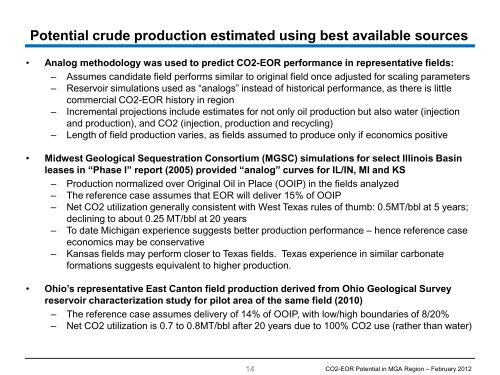
Potential crude production estimated using best available sources<br />
• Analog methodology was used to predict CO2-<strong>EOR</strong> performance in representative fields:<br />
– Assumes candidate field performs similar to original field once adjusted for scaling parameters<br />
– Reservoir simulations used as “analogs” instead of historical performance, as there is little<br />
commercial CO2-<strong>EOR</strong> history in region<br />
– Incremental projections include estimates for not only oil production but also water (injection<br />
and production), and CO2 (injection, production and recycling)<br />
– Length of field production varies, as fields assumed to produce only if economics positive<br />
• Midwest Geological Sequestration Consortium (MGSC) simulations for select Illinois Basin<br />
leases in “Phase I” report (2005) provided “analog” curves for IL/IN, MI and KS<br />
– Production normalized over Original Oil in Place (OOIP) in the fields analyzed<br />
– The reference case assumes that <strong>EOR</strong> will deliver 15% of OOIP<br />
– Net CO2 utilization generally consistent with West Texas rules of thumb: 0.5MT/bbl at 5 years;<br />
declining to about 0.25 MT/bbl at 20 years<br />
– To date Michigan experience suggests better production performance – hence reference case<br />
economics may be conservative<br />
– Kansas fields may perform closer to Texas fields. Texas experience in similar carbonate<br />
formations suggests equivalent to higher production.<br />
• Ohio’s representative East Canton field production derived from Ohio Geological Survey<br />
reservoir characterization study for pilot area of the same field (2010)<br />
– The reference case assumes delivery of 14% of OOIP, with low/high boundaries of 8/20%<br />
– Net CO2 utilization is 0.7 to 0.8MT/bbl after 20 years due to 100% CO2 use (rather than water)<br />
14<br />
CO2-<strong>EOR</strong> Potential in MGA Region – February 2012