Energy Action Paper - Midwestern Governors Association
Energy Action Paper - Midwestern Governors Association
Energy Action Paper - Midwestern Governors Association

Create successful ePaper yourself
Turn your PDF publications into a flip-book with our unique Google optimized e-Paper software.
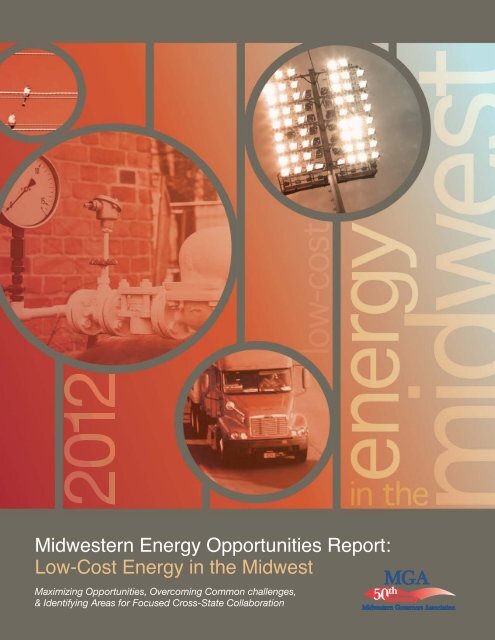
<strong>Midwestern</strong> <strong>Energy</strong> Opportunities Report:<br />
Low-Cost <strong>Energy</strong> in the Midwest<br />
Maximizing Opportunities, Overcoming Common challenges,<br />
& Identifying Areas for Focused Cross-State Collaboration<br />
50 th<br />
Anniversary
Introduction<br />
The <strong>Midwestern</strong> <strong>Governors</strong> <strong>Association</strong> (MGA) helps its member states identify and pursue<br />
common goals in the areas of energy, agriculture and economic development. As one prong of<br />
Iowa Governor Terry Branstad’s agenda as the 2012 Chair, the MGA is focusing on supporting<br />
efforts to increase domestic/<strong>Midwestern</strong> energy production across all types of energy to help<br />
maintain or achieve low-cost energy. Affordable energy is a key component of long-term economic<br />
competitiveness in a global economy. This report will focus the MGA’s attention and resources on<br />
those issues that: a) its member states have already identified as priorities and b) would benefit<br />
most from cross-state collaboration (e.g., where working together can shorten the learning curve or<br />
otherwise improve cost-effective positive outcomes throughout the region).<br />
This report lays the foundation for the MGA’s work on energy by establishing a well-grounded<br />
information base for collaborative work among the states over at least the next year. Staff from<br />
various public offices and agencies were interviewed and surveyed for this report. The information<br />
in this report does not represent the official position of any state and is the culmination of many<br />
perspectives gathered from a range of respondents.<br />
1
Summary of Key Opportunities for<br />
Productive Regional Collaboration<br />
All MGA member states identified energy opportunities that fall into one of two general<br />
categories—electricity sector or transportation. Identified opportunities cover everything<br />
from building new transmission lines and natural gas development to energy efficiency, renewable<br />
energy-related manufacturing and alternative refueling infrastructure. Drawing from the list of<br />
potential cross-state collaborations outlined later in this report, below is a summary of those that seem<br />
most ripe for action, sorted into the two broad categories of electricity sector and transportation.<br />
<strong>Energy</strong> technology investment and manufacturing is an overarching theme identified by all of the<br />
<strong>Midwestern</strong> states. All states discussed businesses within their state that are manufacturing energy<br />
technologies, including electric vehicles, solar or wind components and combined heat and power<br />
systems. In addition to supporting and growing these industries, all of the states discussed energy<br />
in the context of economic development and job creation. The reliable, low–cost and diversified<br />
generation mix necessary to fuel robust state and regional economies is a top priority for all.<br />
ELECTRICITY SECTOR<br />
This first set of opportunities for cross-state collaboration includes the impacts of a rapidly<br />
changing electric generation mix, energy efficiency, transmission, natural gas development and<br />
distributed generation. Two or more states expressed an interest in:<br />
1. Information sharing on planning for future electric generation, due to the<br />
expected changes to the Midwest’s electricity mix. Every MGA state is interested in<br />
the future electric generation mix and anticipates that some existing coal generators will be<br />
retired due to an aging fleet, rising coal prices, low natural gas prices and/or U.S.<br />
Environmental Protection Agency (EPA) air quality pollution control requirements. Falling prices<br />
for some forms of renewable energy are also expected to have an impact. <strong>Midwestern</strong> states<br />
face similar concerns regarding reliability, the cost to ratepayers of a changing electricity system<br />
and over-dependence on any one source for electricity, particularly given the likely increase in<br />
natural gas-based electric generation. These are all issues that states identified as benefitting<br />
from regional collaboration and information sharing.<br />
2. Sharing information and best practices on achieving energy efficiency. Every MGA<br />
state is working on energy efficiency, which can lead to a decrease in electric generation.<br />
States are interested in improving the energy efficiency of public buildings, commercial<br />
buildings and state facilities. Many states are also interested in industrial energy efficiency (IEE),<br />
including combined heat and power (CHP) and waste energy recovery (WER). The MGA has<br />
completed previous work on IEE and those past efforts provide a foundation for continued<br />
regional collaboration on topics ranging from financing to program designs.<br />
3
3. Continued work on a robust regional transmission system. Every MGA state<br />
identified transmission infrastructure for energy distribution as an important issue to the health<br />
of the region’s energy economy. Many states also see transmission as an economic<br />
development lever. The MGA is currently working on transmission-related efforts, so states’<br />
continued interest in this topic provides renewed momentum for this cross-state effort.<br />
4. Information exchange on distributed generation. A handful of MGA states identified<br />
distributed generation of renewable energy resources as an opportunity and an area that would<br />
benefit from regional collaboration. These states are interested in sharing their respective<br />
experiences and lessons learned from developing and implementing distributed generation<br />
policy, especially on the topics of interconnection standards, project permitting, incentives, and<br />
policies such as net metering, resource carve-outs and technology manufacturing.<br />
5. Sharing information on a wide range of issues associated with natural gas<br />
development, including lessons learned from other regions with natural gas experience.<br />
Many MGA states pointed to the challenges and opportunities associated with the natural gas<br />
boom, including an over-reliance on gas down the road. States are interested in working<br />
together on the issues of economic and workforce development, ensuring adequate<br />
infrastructure and an appropriate regulatory environment, as well as effectively managing the<br />
local impacts of natural gas development.<br />
TRANSPORTATION SECTOR<br />
Almost every state is interested in diversifying the transportation fuel mix and developing the<br />
infrastructure necessary to support the use of non-gasoline fuels. Different types of fuels are<br />
prioritized in different states according to their inherent assets, including their natural resources and<br />
manufacturing base. There is a shared interest in making sure that the efforts of individual states<br />
add up to a coherent refueling network. The main alternatives of interest are electric vehicles,<br />
compressed natural gas vehicles and renewable fuels. States are interested in:<br />
1. Working together to map alternative fuel infrastructure corridors and clusters.<br />
This could include collecting data on infrastructure deployment, identifying pilot projects in<br />
different cities, and perhaps discussing other issues that would benefit from a regional<br />
approach (e.g., common signage for various fuel types, or harmonized regulations that make<br />
the region more hospitable to fuel infrastructure developers).<br />
2. Sharing ideas that will increase the penetration of biofuels in existing markets<br />
and develop access to new markets. Related to number one (above), this cross-state<br />
effort would “go deep” in exploring a regional approach to biofuels infrastructure development<br />
that would help to increase biofuel use in the region. Share approaches and best practices for<br />
removing barriers to increased biofuel blends, such as encouraging the implementation of 15<br />
percent ethanol (E15) and 20 percent biodiesel (B20).<br />
4
<strong>Midwestern</strong> <strong>Energy</strong> Today –<br />
Background and Context<br />
The national and regional energy systems have always been dynamic, fueling the<br />
economy while also interacting in complex ways with public interests. Emerging global<br />
markets create a host of opportunities and challenges to the economics of today’s energy<br />
infrastructure. For example, relatively low energy prices have historically helped draw energyintensive<br />
industries to <strong>Midwestern</strong> states, creating economic opportunities that are increasingly<br />
challenged by international competition. Growing demands for energy in Asia are fueling high<br />
prices for petroleum and a new trend of rising U.S. coal exports, which in turn is driving up<br />
domestic prices for coal. In addition, current and proposed U.S. EPA air and water regulations will<br />
require some facilities to install new pollution controls.<br />
Even as oil and coal prices have risen in recent years, the costs of some energy sources are<br />
dropping. In particular, rapidly rising shale gas development has lowered natural gas prices to a 10-<br />
year low, undercutting all other electric power generation sources in recent months. Also, the<br />
growth of wind power, falling solar costs and expanding electric vehicle markets have contributed<br />
to a tech sector that topped $263 billion in 2011. 1 While integrating new energy resources into<br />
current infrastructure is not without its risks or costs, it creates new investment opportunities<br />
throughout affected supply chains.<br />
States and regions continue to play a central role in developing and implementing U.S. energy<br />
policy. By promoting energy diversity and efficient energy use across all sectors of the economy,<br />
<strong>Midwestern</strong> states have an opportunity to enhance national and regional energy security and keep<br />
costs down in the long-term, while attracting investments that support much-needed economic<br />
development across the region.<br />
Total <strong>Midwestern</strong> 2 <strong>Energy</strong> Use by Sector and Fuel, 2010<br />
Hydropower<br />
Wood Geothermal<br />
0%<br />
0%<br />
Wind<br />
1%<br />
Solar<br />
2%<br />
0%<br />
Ethanol<br />
1%<br />
Residential<br />
24%<br />
Transport<br />
25%<br />
Nuclear<br />
9%<br />
Coal<br />
33%<br />
Industry<br />
33%<br />
Natural Gas<br />
22%<br />
Commercial<br />
18% 32%<br />
Oil<br />
Source: U.S. <strong>Energy</strong> Information Administration<br />
1<br />
http://www.pewenvironment.org/news-room/reports/whos-winning-the-clean-energy-race-2011-edition-85899381106<br />
2<br />
In this figure, and all subsequent figures, “Midwest” refers to the nine states of the <strong>Midwestern</strong> <strong>Governors</strong> <strong>Association</strong> (Ill., Ind., Iowa,<br />
Kan., Mich., Minn., Mo., Ohio and Wis.).<br />
5
ELECTRIC GENERATION<br />
The Midwest consumes<br />
nearly 800 million megawatthours<br />
(MWh) of electricity per<br />
year to power homes,<br />
schools, businesses and<br />
industry. This is approximately<br />
22 percent of total electricity<br />
consumed in the U.S. and<br />
requires the operation of more<br />
than 1,800 power plants and tens<br />
of thousands of miles of highvoltage<br />
transmission lines. 3<br />
Bubble size<br />
represents total<br />
generation<br />
Coal<br />
Oil<br />
Natural Gas<br />
Nuclear<br />
Hydro<br />
Biomass<br />
Wind<br />
Solar<br />
Geothermal<br />
Other Fossil<br />
Other Unknown<br />
United States<br />
Kansas<br />
Midwest Power Plants, 2009<br />
Wichita<br />
Minnesota<br />
Minneapolis<br />
Iowa<br />
Missouri<br />
Wisconsin<br />
Illinois<br />
Chicago<br />
Michigan<br />
Indiana<br />
Detroit<br />
Ohio<br />
Indianapolis Columbus<br />
Source: World Resources Institute’s Power Almanac of the American Midwest<br />
Net Trade (TWh), 2010<br />
Net Interstate Electricity Trade<br />
Imports more than 15 TWh<br />
Imports 5 to 15 TWh<br />
Imports less than 5 TWh<br />
Exports less than 5 TWh<br />
Exports 5 to 15 TWh<br />
Exports more than 15 TWh<br />
Source: World Resources Institute’s Power Almanac of the American Midwest<br />
<br />
While the region is a net exporter of<br />
electricity, imports and exports<br />
varied state by state. Ohio was the<br />
largest net electricity importer in the<br />
Midwest, 20 terawatt-hours (TWh) in<br />
2010, while Illinois was the largest net<br />
electricity exporter, 45 TWh in 2010.<br />
Indiana and Illinois exported more than 15<br />
percent of their electricity, while Minnesota<br />
and Wisconsin imported more than 15<br />
percent. 4<br />
<br />
<br />
<br />
<br />
<br />
<br />
<br />
<br />
<br />
<br />
<br />
<br />
<br />
<br />
3<br />
U.S. <strong>Energy</strong> Information Administration, State Electricity Profiles<br />
4<br />
Ibid.<br />
6
<strong>Midwestern</strong> Electricity Generation (%), 2010<br />
Coal is the leading source of electric<br />
generation in the Midwest, accounting for<br />
65 percent of electricity generated in the<br />
region in 2011. Almost 30 percent of the<br />
remaining generation was natural gas and<br />
nuclear. In 2011, renewable sources accounted<br />
for 6 percent of generation region-wide. 5<br />
<strong>Midwestern</strong> Electricity Generation (%), 2010<br />
21% 21%<br />
60 years 51-60 41-50 31-40 11-30 10 or<br />
Unknown<br />
years<br />
younger age<br />
younger age<br />
Source: EPA eGRID2012 version 1.0 & EPA Air Markets Program Data, EIA Electric Power Annual<br />
Source: U.S. Environmental Protection Agency and U.S. <strong>Energy</strong> Information Administration<br />
5<br />
U.S. <strong>Energy</strong> Information Administration, Net Generation by State, Type of Producer, <strong>Energy</strong> Source<br />
6<br />
U.S. <strong>Energy</strong> Information Administration, State Electricity Profiles<br />
7<br />
Ibid.<br />
8<br />
U.S. Environmental Protection Agency, eGRID2012<br />
7
New Electric Generating Capacity in the Midwest<br />
by In-Service Year (GW)<br />
14<br />
12<br />
10<br />
8<br />
6<br />
4<br />
2<br />
0<br />
1940 1950 1960 1970 1980 1990 2000 2010<br />
Coal<br />
Oil<br />
Natural Gas<br />
Other Fossil<br />
Nuclear<br />
Hydro<br />
Other Renewable<br />
This raises the<br />
question of what<br />
will be built in its<br />
place. The vast<br />
majority of new<br />
generation since<br />
1990 has been<br />
natural gas and<br />
renewables. However,<br />
approximately four<br />
gigawatts (GW) of new<br />
coal generation has<br />
been built since 2005. 9<br />
Source: U.S. <strong>Energy</strong> Information Administration<br />
<br />
<br />
Shale Basins and Plays in the Midwest<br />
<br />
The region has been a net<br />
importer of natural gas. 10<br />
However, that could change<br />
with the spread of hydraulic<br />
fracturing. Shale gas plays<br />
underlie a number of the<br />
<strong>Midwestern</strong> states. As of<br />
January 2012, the New Albany,<br />
Devonian, Utica and Antrim<br />
plays are all being explored for<br />
commercial potential or are in<br />
varying stages of commercial<br />
development.<br />
Source: World Resources Institute; U.S. <strong>Energy</strong> Information Administration<br />
(May 2011); Google Maps, http://maps.google.com (January 2012)<br />
9<br />
U.S. <strong>Energy</strong> Information Administration, Form EIA-860<br />
10<br />
U.S. <strong>Energy</strong> Information Administration, State <strong>Energy</strong> Data System<br />
8
The Midwest produced more<br />
than a quarter of the total windpowered<br />
electricity generated in the<br />
entire United States in 2010. That<br />
amounts to 27,000 GW-hours, or 3 percent<br />
of electricity generation in the Midwest. 11<br />
The American Wind <strong>Energy</strong> <strong>Association</strong><br />
(AWEA) reported that wind power generated<br />
TWH<br />
19 percent of Iowa’s electricity in 2011 and<br />
13 percent of electricity in Minnesota. The<br />
1990 1991 1992 1993 1994 1995 1996 1997 1998 1999 2000 2001 2002 2003 2004 200<br />
Illinois 0 0 0 0 0 0 0 0 0 0 0 0 0 0.01802 0.07807 0.1411<br />
Indiana 0 0 0 0 0 0 0 0 0 0 0 0 0 0 0<br />
Iowa 0 0 0 0 5.3E-05 0.00012 0.00011 0.00012 8.9E-05 0.32635 0.49382 0.48786 0.91884 0.98197 1.04995 1.6471<br />
Kansas 4.5E-05 4.2E-05 0.00011 5.8E-05 5.5E-05 2.6E-05 0 0 0 0 0 0.03983 0.46668 0.36594 0.35863 0.4258<br />
Michigan 0 0 0 0 0 0 0 0 0 0 0 0.00028 0.00033 0.00266 0.00188 0.0018<br />
Minnesota 0.00027 0.00024 0.00015 0.00019 0.03952 0.057 0.04994 0.05395 0.14685 0.48569 0.72452 0.89702 0.90584 0.97776 0.81237 1.5824<br />
Missouri 0 0 0 0 0 0 0 0 0 0 0 0 0 0 0<br />
Ohio 0 0 0 0 0 0 0 0 0 0 0 0 0 0 0 0.0132<br />
National Renewable <strong>Energy</strong> Laboratory<br />
(NREL) estimates that the Eastern<br />
Interconnection could supply between 20 and<br />
30 percent of projected electricity demand<br />
from wind resources by 2024, with<br />
upgrades and investment in transmission<br />
infrastructure. According to a study by MISO,<br />
renewable portfolio standards in the Midwest will<br />
lead to a threefold increase from current<br />
generation.<br />
Wisconsin 4.4E-05 6E-06 0 0 0 0 0 0 0 0 0.00273 0.07228 0.04618 0.09758 0.10356 0.0925<br />
<br />
<strong>Midwestern</strong> Wind Resources<br />
Wind Generation by State (TWh)<br />
Wind Generation by State (TWh)<br />
30 30<br />
25 25<br />
20 20<br />
15 15<br />
10 10<br />
5<br />
<br />
0<br />
2005 2006 2007 2008 2009 2010<br />
Illinois<br />
Indiana<br />
Iowa<br />
Kansas<br />
Michigan<br />
Minnesota<br />
Facilities, 2009<br />
Wind<br />
Missouri<br />
Ohio<br />
Wisconsin<br />
Wind Resource<br />
Potential<br />
Class 7<br />
Class 6<br />
Class 5<br />
Class 4<br />
Class 3<br />
Class 2<br />
Power Almanac of the American Midwest (wri.org/midwest-almanac). Derived from:<br />
Source: World Resources Institute’s Power Almanac of the American Midwest<br />
U.S. <strong>Energy</strong> Information Administration, Electric Power Annual 2011<br />
Wind Manufacturing Activity in 2011<br />
1,000 MW to 10,000 MW >10,000 MW<br />
Source: AWEA U.S. Wind Industry Annual Market Report Year Ending 2011<br />
Increased use of wind<br />
energy has helped fuel<br />
manufacturing activity in<br />
the Midwest, which is<br />
currently home to at least<br />
188 companies<br />
contributing to the wind<br />
energy industry. 12 These<br />
facilities include major wind<br />
technology manufacturers, as<br />
well as smaller companies that<br />
supply the industry with<br />
components necessary for<br />
wind turbine development.<br />
11<br />
U.S. <strong>Energy</strong> Information Administration, Electric Power Annual. Net Generation by State, Type of Producer, by <strong>Energy</strong> Source<br />
12<br />
American Wind <strong>Energy</strong> <strong>Association</strong><br />
9
Solar accounts for less than 0.01 percent of total electric generation in the Midwest.<br />
<br />
However, its use has also been expanding. The entire Midwest can generate electricity from<br />
photovoltaics (PV), and portions<br />
<strong>Midwestern</strong> Solar PV Resources<br />
of Kansas have sufficient solar<br />
resources for concentrating<br />
Solar PV Resource<br />
Potential<br />
solar power. In 2010, the<br />
(kWh/m 2 /day)<br />
average installed cost of PV<br />
2.2-3.5<br />
was around $6 per watt. This<br />
3.5-4.0<br />
price is higher than wind- or<br />
4.0-4.5<br />
fossil-based generation.<br />
4.5-5.0<br />
5.0-5.5<br />
However, costs have dropped<br />
5.5-6.0<br />
by almost 40 percent over the<br />
6.0-6.5<br />
6.5-7.0<br />
past decade, and some have<br />
PV Installation<br />
projected these cost reductions<br />
to continue. 14<br />
<br />
Source: World Resources Institute’s Power Almanac of the American Midwest<br />
In addition, the<br />
Midwest also has<br />
tens of thousands of<br />
megawatts of untapped<br />
combined heat and<br />
power (CHP) resources.<br />
Conventional electricity<br />
generation wastes twothirds<br />
of the input fuel's<br />
energy potential during<br />
combustion Even the most<br />
efficient combined-cycle<br />
natural gas power plants<br />
waste about one-half of the<br />
energy it consumes.<br />
<strong>Midwestern</strong> Installed <strong>Midwestern</strong> CHP Installed and Technical CHP and Potential CHP<br />
Technical Potential per State, CHP per 2010 State (2010)<br />
Source: ICF International, Combined Heat and Power Installation Database; Hedman, 2010<br />
10,000<br />
CHP CHP Capacity Capacity (MW) (MW)<br />
8,000<br />
6,000<br />
4,000<br />
2,000<br />
0<br />
IL MI OH WI IN MN MO IA KS<br />
IL MI OH WI IN MN MO IA KS<br />
Total Remaining CHP CHP Technical Potential Potential (MW)<br />
(MW)<br />
Total Installed CHP CHP Capacity (MW) (MW)<br />
Source: ICF International, Combined Heat and Power Installation Database; Hedman, 2010<br />
13<br />
U.S. <strong>Energy</strong> Information Administration, Electric Power Annual. Net Generation by State, by Type of Producer, by <strong>Energy</strong> Source<br />
14<br />
Lawrence Berkeley National Laboratory, Tracking the Sun IV: An Historical Summary of the Installed Cost of Photovoltaics in the<br />
United States from 1998 to 2010. LBNL-5047E. September 2011.<br />
10
Combined heat and power (CHP, or cogeneration) systems capture this otherwise wasted heat<br />
energy and use it to generate electricity and/or useful thermal energy.<br />
Due to its utilization of waste heat, CHP uses approximately 40 percent less energy than<br />
conventional production of heat and electricity.<br />
Moving forward, the Midwest will need to decide how best to deploy the considerable wealth<br />
of fossil fuel and renewable resources, as well as energy efficiency opportunities. While these<br />
resources vary by state, in some cases there may be much to gain through concerted<br />
regional efforts.<br />
MIDWESTERN MANUFACTURING AND REGIONAL ENERGY USE<br />
<br />
<br />
<br />
<br />
<br />
<br />
Manufacturing Share of Total GDP, 2000 and 2010<br />
U.S.<br />
Southeast<br />
Midwest<br />
West<br />
Northeast<br />
Source: U.S. Bureau of Economic Analysis<br />
2000<br />
2010<br />
0 2% 4% 6% 8% 10% 12% 14% 16% 18% 20%<br />
<br />
The <strong>Midwestern</strong><br />
economy is rooted in<br />
manufacturing. While<br />
manufacturing’s share of<br />
total <strong>Midwestern</strong> gross<br />
domestic product (GDP)<br />
declined between 2000 and<br />
2010, it remained<br />
significantly higher than the<br />
U.S. national average. In<br />
2010, the Midwest<br />
accounted for 30<br />
percent of total U.S.<br />
manufacturing, while the<br />
regional manufacturing<br />
workforce represented 10<br />
percent of the region’s total<br />
employment, more than in<br />
any other region.<br />
<br />
11
Within <strong>Midwestern</strong><br />
manufacturing, energyintensive<br />
Midwest Manufacturing Fuel Use by Subsector, 2006<br />
subsectors<br />
Primary Metals<br />
contribute very significantly<br />
Food<br />
to total regional energy Petroleum and Coal Products<br />
use, 15 led by primary metals<br />
(iron, steel, and aluminum), food<br />
processing, petroleum and coal<br />
products (refineries), and chemical<br />
manufacturing. In 2006, energyintensive<br />
sectors generated 42<br />
percent of Midwest manufacturing<br />
value added, while those same<br />
Chemicals<br />
Nonmetallic Mineral Products<br />
<strong>Paper</strong><br />
Transportation Equipment<br />
Fabricated Metal Products<br />
Plastics and Rubber Products<br />
Wood Products<br />
Machinery<br />
Printing and Related Support<br />
subsectors accounted for 80<br />
Electrical Equipment,<br />
percent of regional manufacturing<br />
Appliances, and Components<br />
Computers and<br />
fuel use. By including industrial<br />
Electronic Products<br />
Furniture and Related Products<br />
energy efficiency (IEE) as a core<br />
Beverage and<br />
Tobacco Products<br />
component of economic<br />
Miscellaneous<br />
development strategies,<br />
Leather and Allied Products<br />
policymakers may help steer<br />
capital investments toward<br />
manufacturing process<br />
improvements and energy<br />
Source: U.S. <strong>Energy</strong> Information Administration Total Fuel Use (Trillion Btu)<br />
infrastructure that leaves U.S. manufacturers better positioned to compete in the 21st century.<br />
0 200 400 600 800 1000<br />
Between 2000 and 2010, average <strong>Midwestern</strong> industry electricity prices increased<br />
by 43 percent. This increase helps to explain the growing interest in IEE investments as a<br />
strategy for reducing energy costs. Natural gas and electricity provided more than 60 percent of<br />
the total energy consumed by <strong>Midwestern</strong> manufacturing in 2006 16 ; illustrating that energy<br />
efficiency programs run by<br />
natural gas and electric<br />
utilities could have a<br />
substantial impact on<br />
industrial energy use. Total<br />
energy consumption by<br />
Midwest manufacturing is<br />
influenced by a range of<br />
factors, including the mix of<br />
industries located in the<br />
region, the age of facility<br />
Midwest average<br />
U.S. average<br />
Annual Average Prices for <strong>Energy</strong> Delivered<br />
to Industrial Customers, 2010<br />
ELECTRICITY<br />
(cents/kWh)<br />
6.19<br />
6.77<br />
NATURAL GAS<br />
($/1,000 FT 3 )<br />
6.66<br />
5.49<br />
Source: U.S. <strong>Energy</strong> Information Administration<br />
COAL<br />
($/short ton)<br />
50.68<br />
59.28<br />
15<br />
This only includes energy used as a fuel source, not energy used as a feedstock. For example, natural gas used as a feedstock for<br />
chemical manufacturing is not included in this measure of energy use.<br />
16<br />
2006 Manufacturing <strong>Energy</strong> Consumption Survey<br />
12
equipment, the utilization of energy efficient technologies and regional energy prices. In 2010,<br />
<strong>Midwestern</strong> industry electricity and coal prices were, on average, lower than the national average.<br />
Meanwhile, <strong>Midwestern</strong> natural gas prices were higher than the<br />
national average.<br />
ALTERNATIVE TRANSPORTATION FUELS, INFRASTRUCTURE AND VEHICLES<br />
<br />
<br />
<br />
<br />
<strong>Midwestern</strong> states are increasingly at the center of national efforts to reduce oil<br />
imports through the manufacturing of cleaner, more fuel-efficient vehicles and through the<br />
production of fuels that diversify the nation’s transportation fuel mix. While these trends have been<br />
<br />
<br />
<br />
<br />
<br />
<br />
driven largely by federal policies, including vehicle emissions standards and renewable fuel<br />
<br />
<br />
standards, <strong>Midwestern</strong> states host critical agricultural, manufacturing and skilled workforce<br />
capacities that position it to lead in the global competition to develop next-generation<br />
<br />
vehicles and fuels.<br />
<br />
<br />
<br />
<br />
In 2010, MGA states were responsible for half of the national GDP generated by<br />
<br />
the manufacturing of motor vehicles, according to the U.S. Bureau of Economic Analysis. In<br />
employment terms, the Midwest accounted for 46 percent of U.S. motor vehicle manufacturing<br />
jobs in 2010. Though the recent recession hit the auto manufacturing sector very hard, resulting in<br />
significant job losses and declines in production, the industry has rebounded considerably<br />
since 2009.<br />
<br />
<br />
<br />
<br />
Motor Vehicle Manufacturing GDP<br />
Value <br />
Added (billion $)<br />
$80<br />
$70<br />
U.S. Total<br />
$60<br />
$50<br />
$40<br />
$30<br />
$20<br />
$10<br />
<br />
$0<br />
2005 2006 2007 2008 2009 2010 <br />
Source: U.S. Census Bureau’s Annual Survey of Manufactures<br />
<br />
13
Michigan, Indiana and<br />
<br />
Ohio still lead the<br />
<br />
nation in<br />
<br />
motor<br />
<br />
vehicle<br />
manufacturing.<br />
<br />
Given<br />
<br />
the cross-state <br />
supply<br />
<br />
chains for vehicles,<br />
<br />
significant opportunities<br />
<br />
exist for <strong>Midwestern</strong> states<br />
as domestic and global<br />
markets expand for<br />
alternative fuel vehicles,<br />
including cleaner-burning<br />
natural gas and electric<br />
vehicles.<br />
Motor Vehicle Manufacturing:<br />
<br />
Employees<br />
<br />
Midwest <br />
Motor Vehicle Manufacturing Employment<br />
by State, 2010<br />
30,000<br />
25,000<br />
20,000<br />
15,000<br />
10,000<br />
5,000<br />
-<br />
<br />
Michigan<br />
<br />
Ohio<br />
<br />
Indiana<br />
<br />
Illinois<br />
<br />
Minnesota<br />
<br />
Source: U.S. Census Bureau’s Annual Survey of Manufactures<br />
<br />
<br />
<br />
<br />
<br />
<br />
<br />
<br />
<br />
<br />
<br />
<br />
<br />
<br />
<br />
<br />
<br />
<br />
<br />
<br />
<strong>Midwestern</strong> states were responsible for 70 percent of U.S. ethanol production in<br />
2009, with Iowa producing almost 30 percent. The foundation for the U.S. market lies with the<br />
federal renewable fuel standard<br />
<strong>Midwestern</strong> Ethanol Refinery Capacity<br />
Capacity (mgy)<br />
1.5-50<br />
51-100<br />
101-150<br />
151-250<br />
Unknown Capacity<br />
Source: Renewable Fuel <strong>Association</strong> (RFA). Ethanol Plant Data<br />
14<br />
<br />
(RFS), which requires gasoline and<br />
diesel refiners to blend specific<br />
quantities of biofuels into their<br />
products sold domestically. The vast<br />
majority of biofuels being produced<br />
today is corn-derived ethanol, which<br />
the RFS places a cap of 15 billion<br />
gallons by 2015. The federal tax<br />
credits for ethanol blending expired<br />
at the end of 2011. U.S. ethanol<br />
plants are now transitioning to be<br />
competitive, but the short-term<br />
transition has presented some<br />
hurdles. According to data<br />
presented at the 2012 Fuel Ethanol<br />
Workshop and Expo 17 , roughly<br />
three-fourths of U.S. ethanol plants<br />
either lost money or merely broke<br />
even in the first quarter of 2012.<br />
17<br />
The Fuel Ethanol Workshop and Expo was put on by Ethanol Producer Magazine and BBI International in early June at the<br />
Minneapolis Convention Center. Source: http://www.startribune.com/business/157370285.html
Moving forward, the<br />
U.S. biofuels industry<br />
will increasingly<br />
have to produce a<br />
substantial amount of<br />
other types of<br />
biofuels to meet the<br />
federal mandate of 36<br />
billion gallons of biofuels<br />
by 2022. This is<br />
especially true for<br />
cellulosic biofuels, which<br />
can be made from wood<br />
chips or grasses.<br />
Estimated 2012<br />
production of cellulosic<br />
biofuel is only 10.5 million<br />
gallons, well below the<br />
statutory goal of<br />
Billion gallons<br />
40<br />
30<br />
10<br />
0<br />
Renewable Fuel Standard<br />
and U.S. Ethanol Production Since 2000<br />
Unspecified advanced biofuels 1<br />
Biodiesel 2<br />
Cellulosic biofuel<br />
Corn-starch ethanol<br />
Actual biofuel production<br />
Future mandates<br />
2000<br />
2001<br />
2002<br />
2003<br />
2004<br />
2005<br />
2006<br />
2007<br />
2008<br />
2009<br />
2010<br />
2011<br />
2012<br />
2013<br />
2014<br />
2015<br />
2016<br />
2017<br />
2018<br />
2019<br />
2020<br />
2021<br />
2022<br />
500 million. 18 The region is not just<br />
1<br />
Excludes corn-starch ethanol and could include fuels made from a variety of feedstocks, including grains like sorghum<br />
and wheat, as well as Brazilian sugarcane ethanol, biomass-based biodiesel, and biofuels made from cellusolic materials.<br />
2<br />
Mandates to be determined by the EPA, but will be no less than one billion gallons.<br />
<br />
<br />
<br />
<br />
Source: Congressional Research Service<br />
250<br />
<strong>Midwestern</strong> Ethanol Consumption (Trillion btu)<br />
200<br />
150<br />
100<br />
50<br />
0<br />
1990 1995 2000 2005<br />
Ethanol consumption<br />
a major producer of<br />
biofuels, but it is also<br />
a major consumer. In<br />
2010, the nine MGA states<br />
consumed 64 million barrels<br />
of ethanol, which accounted<br />
for more than 21 percent of<br />
the total national consumption<br />
in the same year.<br />
<br />
<br />
18<br />
The U.S. EPA is responsible for administering the program and has the authority to alter annual targets to more reflect volumes that<br />
the market is able to realistically produce.<br />
<br />
<br />
<br />
Source: U.S. <strong>Energy</strong> Information Administration<br />
15
<strong>Midwestern</strong> Alternative Fuel Stations<br />
as of May 21, 2012<br />
N<br />
To support the<br />
consumption of<br />
biofuels and other<br />
alternative fuels,<br />
the region has a<br />
network of more<br />
than 3,000<br />
alternative fueling<br />
stations, including<br />
more than 1,400<br />
stations for biodiesel<br />
and E85.<br />
Fuel Type<br />
Biodiesel<br />
E85<br />
Electric<br />
Hydrogen<br />
CNG<br />
LNG<br />
LPG<br />
Major Roadways<br />
0 150 300<br />
Miles<br />
Sources: U.S. Department of <strong>Energy</strong>, <strong>Energy</strong> Efficiency and Renewable Electricity’s Alternative Fuels and Advanced<br />
Vehicles Data Center; U.S. Geological Survey<br />
16
Options for Cross-State<br />
Collaboration<br />
This section summarizes possible areas of collaboration identified by MGA member<br />
states via electronic surveys and in-person or telephone interviews. A detailed collection of all<br />
input received by MGA member states can be found in Appendix A. This section includes the<br />
possible areas of collaboration in the following energy topics:<br />
1. Impacts of a Rapidly Changing Electric Generation Mix<br />
2. <strong>Energy</strong> Efficiency<br />
3. Transmission<br />
4. Renewable <strong>Energy</strong> Development, Including Distributed Generation<br />
5. Natural Gas Development<br />
6. Diversifying the Transportation Fuel Mix and Building the Needed Infrastructure<br />
7. Enhanced Oil Recovery (EOR)<br />
8. <strong>Energy</strong> Technology Investment and Manufacturing<br />
IMPACTS OF A RAPIDLY CHANGING ELECTRIC GENERATION MIX<br />
The implementation of recent and proposed rules from the U.S. Environmental Protection Agency<br />
(EPA), combined with an aging coal generation fleet, low natural gas prices and falling prices for<br />
some forms of renewable energy, are expected to result in significant changes to the region’s<br />
electric generation portfolio. Reflecting this reality, every state cited these likely changes in the<br />
future electric generation mix as a source of both challenge and potential opportunity for the<br />
<strong>Midwestern</strong> region.<br />
Since 2000, more than 90 percent of new generating capacity has been natural gas and<br />
renewables. However, these sources still account for only 10 percent of total generation in the<br />
17
egion. More than 290 coal-fired units are 40 years of age or older. The low cost of natural gas,<br />
coupled with the implementation of U.S. EPA rules, could expedite the retirement of many older,<br />
smaller and intermediate coal-fired power plants across the MGA region. Coal-plant retirements<br />
could result in a switch to natural gas generation.<br />
Options Identified for Focused Cross-State Collaboration<br />
Anticipating changes in electric generation, states suggested areas where they could benefit from<br />
cross-state collaboration. <strong>Midwestern</strong> states face similar decisions for long-term resource planning<br />
and share concerns about system reliability, the fuel resource mix in the wake of coal plant<br />
retirements and increased natural gas-based electric generation, as well as the cost to ratepayers.<br />
States highlighted the value of information sharing on their planning efforts in the context of future<br />
shifts of the <strong>Midwestern</strong> electric generation mix. States could usefully share information on their<br />
respective answers to the following questions:<br />
1. How will a shift in the energy mix impact <strong>Midwestern</strong> industry involved with<br />
electric generation and energy production?<br />
2. How are states addressing coal plant retirements? Where are the coal<br />
retirements going to create the most impact and how can <strong>Midwestern</strong> states<br />
address such impacts?<br />
3. What strategies are states using to maintain a diversified energy portfolio (e.g.,<br />
avoid over-reliance on any particular fuel, such as natural gas)?<br />
4. What strategies are states using to reach state energy policy, economic<br />
and jobs goals?<br />
5. How can states work together to make better long-term resource decisions<br />
within the broader regional and even national marketplace?<br />
6. What kind of new institutions or partnerships must develop or evolve to address<br />
these (above) issues, and what might they look like?<br />
All the parties involved in building, managing and regulating the electric system, including state<br />
agencies, utility commissions, regional transmission operators and the Federal <strong>Energy</strong> Regulatory<br />
Commission (FERC), are expressing the desire for a collaborative effort to respond to the U.S.<br />
EPA’s expected rules. This collaborative effort would ensure that solutions meet long-term state<br />
energy needs, while providing a secure regional transmission grid with the proper mix of<br />
renewables, gas generation and demand response necessary for concrete problem solving related<br />
to the timing and implementation of new air quality regulations. Several states discussed<br />
challenges of managing uncertainty around which plants might close, construction contracts and<br />
labor demands for necessary plant upgrades, and the future of critical, must-run plants.<br />
18
ENERGY EFFICIENCY<br />
<strong>Energy</strong> efficiency was highlighted by most of the MGA states as an important opportunity across<br />
the industrial, commercial and residential sectors, as well as for public buildings. These states all<br />
identified public buildings as a common priority.<br />
Most of the states also identified industrial energy efficiency (IEE), including combined heat and<br />
power (CHP) and waste energy recovery (WER), as strategically important for a range of reasons.<br />
The Midwest has strong manufacturing, significant energy production potential and a skilled<br />
workforce. Improved energy efficiency can help insulate domestic manufacturers from future<br />
spikes by reducing fuel input requirements. The Midwest can communicate these strengths<br />
and better coordinate to promote the region (instead of competing within) to attract capital and<br />
create more jobs.<br />
Specific interests in IEE vary, but all are rooted in common goals of increasing energy productivity<br />
and improving manufacturing competitiveness. IEE rose to the top for many states because of the<br />
importance of a strong manufacturing sector to the regional economy, IEE’s potential as a<br />
compliance strategy for new air quality regulations and because CHP and WER are potential<br />
sources for new base load energy generation (in the context of a changing electric generation mix).<br />
Options Identified for Cross-State Collaboration<br />
Specific ideas for cross-state collaboration and desired outcomes include:<br />
1. Share information and best practices on achieving energy efficiency in state<br />
facilities and public buildings. This could include experiences relating to energy<br />
performance contracting, building benchmarking, tracking energy consumption, managing<br />
contracts, implementing employee behavioral change programs and financing state and local<br />
government building retrofits.<br />
2. Compare best practices, policies and other tools for advancing IEE. This could<br />
include states’ experiences with industrial opt-outs and self direct programs; leading state,<br />
university, utility and business association programs; inclusion of IEE as compliance strategies<br />
for existing and pending U.S. EPA rules; and financing tools that work for industry and costeffectively<br />
attract private financing for IEE projects. States also expressed interest in sharing<br />
experiences in removing barriers to CHP and mapping out how CHP could provide baseload<br />
generation.<br />
3. Information sharing on how states are using software and information<br />
technology solutions to advance energy efficiency programs. For example, an Illinois<br />
utility, Commonwealth Edison (ComEd.), put in place a common customer relationship<br />
management platform for marketing subcontractors to track approaches implemented by other<br />
contractors who are working with industrial clients.<br />
19
4. Share examples of model programs and creative approaches for energy<br />
efficiency financing. What are other states doing to encourage private-sector investments<br />
and optimize public investments? What are some examples of innovative financing<br />
mechanisms? What metrics do states use to gauge success?<br />
TRANSMISSION<br />
Ensuring that the region has a modern, reliable electric grid for energy distribution is<br />
an important, on-going issue for <strong>Midwestern</strong> states. The build-out of transmission, both<br />
within the Midwest and with<br />
interconnections to other<br />
regions, is essential to meeting<br />
6<br />
the energy demands of<br />
1<br />
residential, commercial and<br />
2<br />
industrial customers as well as<br />
connecting new <strong>Midwestern</strong><br />
3<br />
5<br />
energy production. Transmission<br />
15<br />
projects are also an opportunity<br />
4<br />
for many <strong>Midwestern</strong> states to<br />
export energy, create jobs and<br />
16<br />
12<br />
attract investment in energy<br />
7<br />
8 9<br />
14<br />
17<br />
10<br />
infrastructure and production.<br />
The planning and siting of<br />
regional transmission lines as<br />
well as the distribution of cost for<br />
regional transmission projects are<br />
issues that <strong>Midwestern</strong> states<br />
are working to address. States<br />
in the region have different<br />
perspectives on the role of a<br />
regional transmission system and<br />
the distribution of costs to pay<br />
for building this infrastructure.<br />
Several transmission lines have<br />
been proposed for construction<br />
within the MGA footprint (see<br />
MISO map at right for an<br />
example).<br />
Transmission by Voltage<br />
765 kV to 800 kV<br />
345 kV to 500 kV<br />
Proposed Multi-Value Projects<br />
Project Name State(s) Voltage<br />
1. Big Store-Brookings SD 345 kV<br />
2. Brookings-SE Twin Cities SD/MN 345 kV<br />
3. Lakefield Jct. - Winnebago - MN/IA 345 kV<br />
Winco - Burt area & Sheldon -<br />
Burt area - Webster<br />
4. Winco - Lime Creek - Emery - IA 345 kV<br />
Blackhawk - Hazleton<br />
5. N. LaCrosse - N. Madison - WI 345 kV<br />
Cardinal & Dubuque Co. -<br />
Spring Green - Cardinal<br />
6. Elendale - Big Stone ND/SD 345 kV<br />
7. Adair - Ottumwa IA/MO 345 kV<br />
8. West Adair - Palmyra Tap MO 345 kV<br />
11<br />
Project Name State(s) Voltage<br />
9. Palmyra - Quincy - Meredosia - MO/IL 345 kV<br />
Ipava & Meredosia - Pawnee<br />
10. New Pawnee - Pana IL 345 kV<br />
11. Pana - Mt. Zion - Kansas - IL 345 kV<br />
Sugar Creek<br />
12. Reynolds - Burr Oak - Hiple IN 345 kV<br />
13. Michigan Thumb Loop MI 345 kV<br />
Expansion<br />
14. New Reynolds - Greentown IN 765 kV<br />
15. Pleasant Prairie - Zion <strong>Energy</strong> WI/IL 345 kV<br />
Center<br />
16. Fargo - Oak Grove IL 345 kV<br />
17. Sidney - Rising IL 345 kV<br />
13<br />
20
Options Identified for Cross-State Collaboration<br />
The MGA is currently working to address transmission-related issues including cost allocation,<br />
siting and resolving “boundary issues” with neighboring regional grid operators so that states can<br />
realize their economic development potential from power generation (e.g., renewables).<br />
RENEWABLE ENERGY DEVELOPMENT, INCLUDING DISTRIBUTED GENERATION<br />
Renewable energy development was an issue identified at some level by all MGA<br />
states. For example, many states see opportunity in improving the supply chain for renewable<br />
energy manufacturing, especially in the face of growing foreign competition and the potential loss<br />
of federal tax benefits. The issue of distributed generation, defined as small-scale electricity<br />
generation (less than 10 megawatts) that is connected to the distribution system, rose to the top<br />
among states as an area ripe for cross-state collaboration.<br />
Options for Cross-State Collaboration on Distributed Generation<br />
Specific ideas for collaboration on distributed generation include:<br />
1. Information sharing on lessons from other states in developing and implementing<br />
distributed generation policy. What are some of the lessons learned or best practices<br />
related to interconnection standards and permitting projects? How can incentives for<br />
distributed generation be created within existing state renewable portfolio policies? What has<br />
been the impact of distributed generation policy? Identify best practices and standardize<br />
policies and regulatory practices across states.<br />
2. Opportunities for increasing renewable energy manufacturing. A number of states<br />
have been researching and supporting the build out of robust, state-specific and regional<br />
renewable energy supply chains. Many states have strength in solar, wind, advanced battery<br />
and other renewable energy businesses. Information sharing across states on this topic could<br />
be beneficial.<br />
3. Minnesota has been facilitating a stakeholder process to examine changes to<br />
existing net metering policy. Other states could benefit from the input gathered through<br />
this process. A group of stakeholders in Illinois has been examining solar and distributed<br />
generation carve-outs and different generation tiers within state renewable renewable portfolio<br />
standards and could have useful information for other states.<br />
21
Additional areas identified for cross-state collaboration relating to renewable energy generation include:<br />
1. Increasing penetration of renewable energy in existing markets and developing<br />
access to new markets. The MGA’s on-going work to improve the region’s transmission<br />
system will improve access to existing and new markets, but there may be other issues that<br />
interested states could work on together that would further improve market access.<br />
2. Compare definitions of renewable energy in the region. Review and compare<br />
renewable energy definitions across <strong>Midwestern</strong> states to identify different types of generation<br />
that could qualify for renewable energy credit trading among states.<br />
NATURAL GAS DEVELOPMENT<br />
<strong>Midwestern</strong> states are involved in different aspects of natural gas development,<br />
transport and storage. The recent increase in the domestic natural gas resource potential<br />
brings both economic opportunity and potential challenges to the region.<br />
Options Identified for Cross-State Collaboration<br />
Several states discussed opportunities for cross-state collaboration related to natural gas<br />
development. States suggested sharing information within the Midwest and gathering information<br />
from other regions with experience on natural gas development on a range of issues, including:<br />
1. Economic and workforce development. States can share information and generate<br />
strategies on how the region’s economy and workforce can benefit from natural gas<br />
development.<br />
2. Infrastructure development (e.g., pipelines and storage). A few states and regional<br />
stakeholders are already identifying ways to coordinate infrastructure development. A regional<br />
transmission operator, MISO, is an example of multi-state coordination and energy<br />
infrastructure planning.<br />
3. Regulatory development. <strong>Midwestern</strong> states can learn from other states that have natural<br />
gas development experience, both within and outside the region. Ohio, in particular, highlighted<br />
the opportunity to learn from other states, business experts and regulators’ experience in<br />
states with more mature natural gas development industries.<br />
4. Local impacts (e.g., sand mining). <strong>Midwestern</strong> states can learn from each other about<br />
how states are working with local communities on topics such as sand mining for hydraulic<br />
fracturing.<br />
22
DIVERSIFYING THE TRANSPORTATION FUEL MIX<br />
AND BUILDING THE NEEDED INFRASTRUCTURE<br />
Transportation is an important issue for all <strong>Midwestern</strong> states, but areas of interest and specific<br />
strategies to address future transportation challenges vary from state-to-state. The current<br />
transportation issues identified by MGA states fall under electric vehicles (EVs), renewable fuel<br />
development and compressed natural gas (CNG) vehicles. Each of these transportation areas<br />
requires some level of additional infrastructure to deploy the alternative vehicle technology.<br />
Options Identified for Focused Cross-State Collaboration<br />
1. How are states approaching alternative transportation fuels? How are states<br />
addressing the issues of infrastructure deployment, technology manufacturing, and rules and<br />
regulations related to alternative fuels? Data collection on infrastructure deployment for<br />
alternative fuels.<br />
2. Map alternative transportation infrastructure corridors (CNG and EVs). Identify pilot<br />
projects in different cities for making connections to alternative fueling infrastructure. Will the<br />
efforts that are currently underway add up to a coherent refueling infrastructure at the end of<br />
the day? How are states assessing consumer demand for alternative fuels/vehicles? Identify<br />
gaps between demand and alternative transportation deployment.<br />
3. Information sharing. What specific steps are states taking to prepare for the arrival of EVs?<br />
Examples include types of charging stations installed or planned, software to assist consumers<br />
with locating public charging stations and rebate programs to drive adoption.<br />
4. Sharing best practices and addressing barriers to future biofuels development.<br />
This might mean taking a regional approach to biofuels infrastructure development, sharing<br />
ideas about how best to increase penetration of biofuels in existing markets and developing<br />
access to new markets. Share approaches and best practices for removing barriers to<br />
increased biofuel blends such as encouraging the implementation of E15 and B20.<br />
5. Increase collaboration and develop regional branding for biorenewables. Several<br />
state universities are engaging in biorenewable research (biofuels, biobased products,<br />
biobased chemicals) and it would be helpful to share information about specific bio-related<br />
research initiatives and link research initiatives in the region. Branding regional bio resources<br />
could provide access to new markets for biorenewables produced in the region.<br />
6. Explore opportunities to enhance the alternative vehicle manufacturing supply<br />
chain. The current vehicle manufacturing supply chain is regional and parts of the alternative<br />
vehicle manufacturing supply chain are already developing in different states.<br />
23
ENHANCED OIL RECOVERY<br />
Deployment of infrastructure and technologies for enhanced oil recovery (EOR) will<br />
contribute to <strong>Midwestern</strong> leadership in increasing domestic energy production.<br />
Through EOR, the Midwest can translate its emissions from a range of industrial sources into a<br />
domestic energy security solution that also yields environmental benefits. EOR provides a pathway<br />
for the Midwest to produce more domestic oil, create high-paying jobs and develop expertise in<br />
key energy technologies.<br />
Previous regional efforts on EOR provide a significant resource for states to draw upon moving<br />
forward, including policy ideas, EOR potential studies and analysis.<br />
EOR Potential in the MGA Region - Oil and Gas Basins<br />
Legend<br />
Oil<br />
Source: Clinton Climate Initiative in collaboration with the MGA and the Great Plains Institute<br />
24
ENERGY TECHNOLOGY INVESTMENT AND MANUFACTURING<br />
<strong>Midwestern</strong> states are keenly focused on attracting investment, creating and sustaining jobs, and<br />
fostering a thriving economy. The Midwest has opportunities to attract additional investment,<br />
particularly in the area of venture capital. States are working to identify how to attract and foster<br />
investment in energy from within and outside their states. For example, Minnesota is working with<br />
angel investment firms and private equity firms to gain a better understanding of capital shortfalls.<br />
Illinois is looking at how the regulatory framework for small banks can support investment in small<br />
business involved in advanced energy technology.<br />
Options Identified for Focused Cross-State Collaboration<br />
1. State Small Business Credit Initiative. How are MGA states making use of this credit?<br />
Are states using other approaches to support energy entrepreneurs?<br />
2. Regional marketing and branding to make the Midwest region an energy and bio<br />
hub. The Midwest needs to market the region and our significant energy assets. This could tie<br />
into MGA’s current effort to renew the <strong>Midwestern</strong> brand.<br />
3. Workforce development: What best practices can states learn from each other<br />
on workforce development to better align educational training with the skills the<br />
energy production industry needs?<br />
4. Commercialization research and technology centers. States have expressed interest<br />
to learn from other states that have been successful at moving research from the university into<br />
commercialization.<br />
5. Identify ways to attract more venture funding into the region. How do you extract<br />
intellectual property from universities to make it attractive to venture capitalists?<br />
6. Strengthening the supply chain. Identify which industries are involved in energy-related<br />
manufacturing, particularly those that are less known but have a large impact (e.g., component<br />
parts) and discuss how states can support those industries across the region.<br />
25
50 th<br />
Anniversary<br />
<strong>Midwestern</strong> <strong>Governors</strong> <strong>Association</strong><br />
2025 M Street, NW, Suite 800<br />
Washington, DC 20036<br />
Phone: 202-367-1112<br />
Fax: 202-367-2112<br />
www.midwesterngovernors.org