Energy Action Paper - Midwestern Governors Association
Energy Action Paper - Midwestern Governors Association
Energy Action Paper - Midwestern Governors Association

Create successful ePaper yourself
Turn your PDF publications into a flip-book with our unique Google optimized e-Paper software.
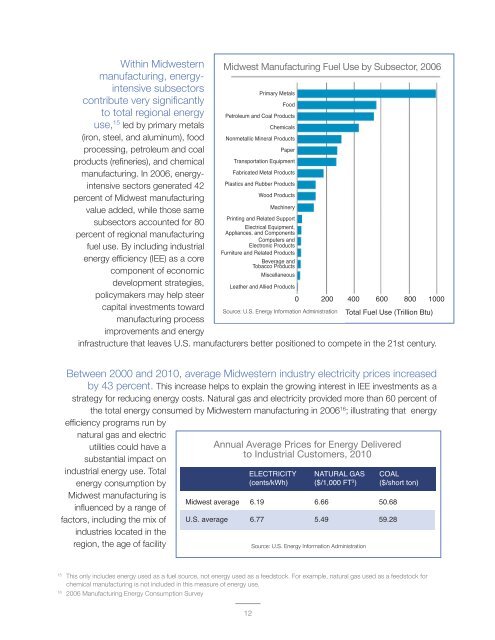
Within <strong>Midwestern</strong><br />
manufacturing, energyintensive<br />
Midwest Manufacturing Fuel Use by Subsector, 2006<br />
subsectors<br />
Primary Metals<br />
contribute very significantly<br />
Food<br />
to total regional energy Petroleum and Coal Products<br />
use, 15 led by primary metals<br />
(iron, steel, and aluminum), food<br />
processing, petroleum and coal<br />
products (refineries), and chemical<br />
manufacturing. In 2006, energyintensive<br />
sectors generated 42<br />
percent of Midwest manufacturing<br />
value added, while those same<br />
Chemicals<br />
Nonmetallic Mineral Products<br />
<strong>Paper</strong><br />
Transportation Equipment<br />
Fabricated Metal Products<br />
Plastics and Rubber Products<br />
Wood Products<br />
Machinery<br />
Printing and Related Support<br />
subsectors accounted for 80<br />
Electrical Equipment,<br />
percent of regional manufacturing<br />
Appliances, and Components<br />
Computers and<br />
fuel use. By including industrial<br />
Electronic Products<br />
Furniture and Related Products<br />
energy efficiency (IEE) as a core<br />
Beverage and<br />
Tobacco Products<br />
component of economic<br />
Miscellaneous<br />
development strategies,<br />
Leather and Allied Products<br />
policymakers may help steer<br />
capital investments toward<br />
manufacturing process<br />
improvements and energy<br />
Source: U.S. <strong>Energy</strong> Information Administration Total Fuel Use (Trillion Btu)<br />
infrastructure that leaves U.S. manufacturers better positioned to compete in the 21st century.<br />
0 200 400 600 800 1000<br />
Between 2000 and 2010, average <strong>Midwestern</strong> industry electricity prices increased<br />
by 43 percent. This increase helps to explain the growing interest in IEE investments as a<br />
strategy for reducing energy costs. Natural gas and electricity provided more than 60 percent of<br />
the total energy consumed by <strong>Midwestern</strong> manufacturing in 2006 16 ; illustrating that energy<br />
efficiency programs run by<br />
natural gas and electric<br />
utilities could have a<br />
substantial impact on<br />
industrial energy use. Total<br />
energy consumption by<br />
Midwest manufacturing is<br />
influenced by a range of<br />
factors, including the mix of<br />
industries located in the<br />
region, the age of facility<br />
Midwest average<br />
U.S. average<br />
Annual Average Prices for <strong>Energy</strong> Delivered<br />
to Industrial Customers, 2010<br />
ELECTRICITY<br />
(cents/kWh)<br />
6.19<br />
6.77<br />
NATURAL GAS<br />
($/1,000 FT 3 )<br />
6.66<br />
5.49<br />
Source: U.S. <strong>Energy</strong> Information Administration<br />
COAL<br />
($/short ton)<br />
50.68<br />
59.28<br />
15<br />
This only includes energy used as a fuel source, not energy used as a feedstock. For example, natural gas used as a feedstock for<br />
chemical manufacturing is not included in this measure of energy use.<br />
16<br />
2006 Manufacturing <strong>Energy</strong> Consumption Survey<br />
12