Energy Action Paper - Midwestern Governors Association
Energy Action Paper - Midwestern Governors Association
Energy Action Paper - Midwestern Governors Association

Create successful ePaper yourself
Turn your PDF publications into a flip-book with our unique Google optimized e-Paper software.
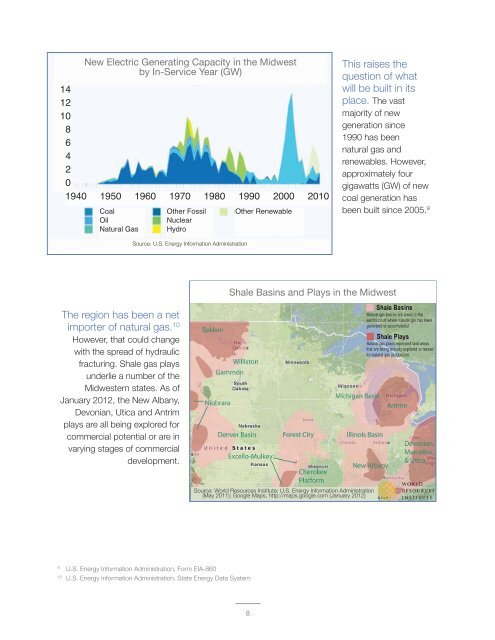
New Electric Generating Capacity in the Midwest<br />
by In-Service Year (GW)<br />
14<br />
12<br />
10<br />
8<br />
6<br />
4<br />
2<br />
0<br />
1940 1950 1960 1970 1980 1990 2000 2010<br />
Coal<br />
Oil<br />
Natural Gas<br />
Other Fossil<br />
Nuclear<br />
Hydro<br />
Other Renewable<br />
This raises the<br />
question of what<br />
will be built in its<br />
place. The vast<br />
majority of new<br />
generation since<br />
1990 has been<br />
natural gas and<br />
renewables. However,<br />
approximately four<br />
gigawatts (GW) of new<br />
coal generation has<br />
been built since 2005. 9<br />
Source: U.S. <strong>Energy</strong> Information Administration<br />
<br />
<br />
Shale Basins and Plays in the Midwest<br />
<br />
The region has been a net<br />
importer of natural gas. 10<br />
However, that could change<br />
with the spread of hydraulic<br />
fracturing. Shale gas plays<br />
underlie a number of the<br />
<strong>Midwestern</strong> states. As of<br />
January 2012, the New Albany,<br />
Devonian, Utica and Antrim<br />
plays are all being explored for<br />
commercial potential or are in<br />
varying stages of commercial<br />
development.<br />
Source: World Resources Institute; U.S. <strong>Energy</strong> Information Administration<br />
(May 2011); Google Maps, http://maps.google.com (January 2012)<br />
9<br />
U.S. <strong>Energy</strong> Information Administration, Form EIA-860<br />
10<br />
U.S. <strong>Energy</strong> Information Administration, State <strong>Energy</strong> Data System<br />
8