Energy Action Paper - Midwestern Governors Association
Energy Action Paper - Midwestern Governors Association
Energy Action Paper - Midwestern Governors Association

You also want an ePaper? Increase the reach of your titles
YUMPU automatically turns print PDFs into web optimized ePapers that Google loves.
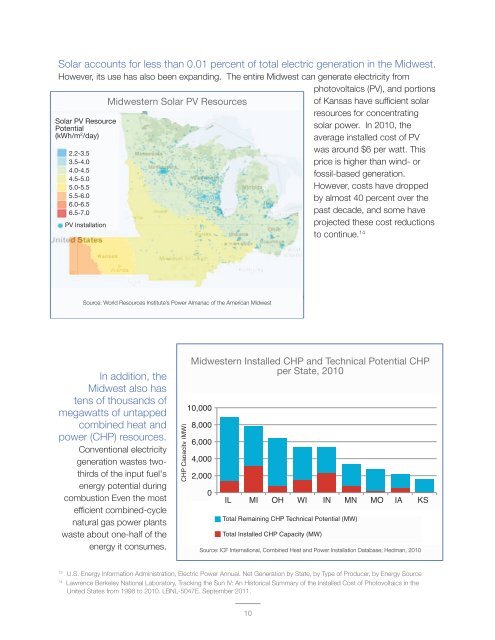
Solar accounts for less than 0.01 percent of total electric generation in the Midwest.<br />
<br />
However, its use has also been expanding. The entire Midwest can generate electricity from<br />
photovoltaics (PV), and portions<br />
<strong>Midwestern</strong> Solar PV Resources<br />
of Kansas have sufficient solar<br />
resources for concentrating<br />
Solar PV Resource<br />
Potential<br />
solar power. In 2010, the<br />
(kWh/m 2 /day)<br />
average installed cost of PV<br />
2.2-3.5<br />
was around $6 per watt. This<br />
3.5-4.0<br />
price is higher than wind- or<br />
4.0-4.5<br />
fossil-based generation.<br />
4.5-5.0<br />
5.0-5.5<br />
However, costs have dropped<br />
5.5-6.0<br />
by almost 40 percent over the<br />
6.0-6.5<br />
6.5-7.0<br />
past decade, and some have<br />
PV Installation<br />
projected these cost reductions<br />
to continue. 14<br />
<br />
Source: World Resources Institute’s Power Almanac of the American Midwest<br />
In addition, the<br />
Midwest also has<br />
tens of thousands of<br />
megawatts of untapped<br />
combined heat and<br />
power (CHP) resources.<br />
Conventional electricity<br />
generation wastes twothirds<br />
of the input fuel's<br />
energy potential during<br />
combustion Even the most<br />
efficient combined-cycle<br />
natural gas power plants<br />
waste about one-half of the<br />
energy it consumes.<br />
<strong>Midwestern</strong> Installed <strong>Midwestern</strong> CHP Installed and Technical CHP and Potential CHP<br />
Technical Potential per State, CHP per 2010 State (2010)<br />
Source: ICF International, Combined Heat and Power Installation Database; Hedman, 2010<br />
10,000<br />
CHP CHP Capacity Capacity (MW) (MW)<br />
8,000<br />
6,000<br />
4,000<br />
2,000<br />
0<br />
IL MI OH WI IN MN MO IA KS<br />
IL MI OH WI IN MN MO IA KS<br />
Total Remaining CHP CHP Technical Potential Potential (MW)<br />
(MW)<br />
Total Installed CHP CHP Capacity (MW) (MW)<br />
Source: ICF International, Combined Heat and Power Installation Database; Hedman, 2010<br />
13<br />
U.S. <strong>Energy</strong> Information Administration, Electric Power Annual. Net Generation by State, by Type of Producer, by <strong>Energy</strong> Source<br />
14<br />
Lawrence Berkeley National Laboratory, Tracking the Sun IV: An Historical Summary of the Installed Cost of Photovoltaics in the<br />
United States from 1998 to 2010. LBNL-5047E. September 2011.<br />
10