Indianapolis Airport Authority - Indianapolis International Airport
Indianapolis Airport Authority - Indianapolis International Airport
Indianapolis Airport Authority - Indianapolis International Airport

Create successful ePaper yourself
Turn your PDF publications into a flip-book with our unique Google optimized e-Paper software.
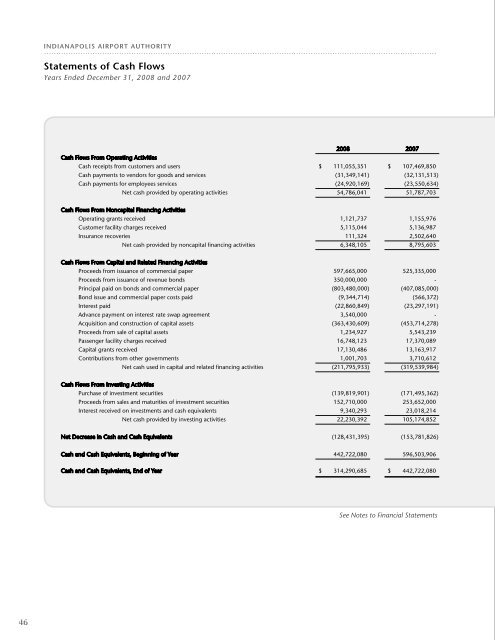
indianapolis <strong>Airport</strong> <strong>Authority</strong><br />
Statements of Cash Flows<br />
Years Ended December 31, 2008 and 2007<br />
2008 2007<br />
Cash Flows From Operating Activities<br />
Cash receipts from customers and users $ 111,055,351 $ 107,469,850<br />
Cash payments to vendors for goods and services (31,349,141) (32,131,513)<br />
Cash payments for employees services (24,920,169) (23,550,634)<br />
Net cash provided by operating activities 54,786,041 51,787,703<br />
Cash Flows From Noncapital Financing Activities<br />
Operating grants received 1,121,737 1,155,976<br />
Customer facility charges received 5,115,044 5,136,987<br />
Insurance recoveries 111,324 2,502,640<br />
Net cash provided by noncapital financing activities 6,348,105 8,795,603<br />
Cash Flows From Capital and Related Financing Activities<br />
Proceeds from issuance of commercial paper 597,665,000 525,335,000<br />
Proceeds from issuance of revenue bonds 350,000,000 -<br />
Principal paid on bonds and commercial paper (803,480,000) (407,085,000)<br />
Bond issue and commercial paper costs paid (9,344,714) (566,372)<br />
Interest paid (22,860,849) (23,297,191)<br />
Advance payment on interest rate swap agreement 3,540,000 -<br />
Acquisition and construction of capital assets (363,430,609) (453,714,278)<br />
Proceeds from sale of capital assets 1,234,927 5,543,239<br />
Passenger facility charges received 16,748,123 17,370,089<br />
Capital grants received 17,130,486 13,163,917<br />
Contributions from other governments 1,001,703 3,710,612<br />
Net cash used in capital and related financing activities (211,795,933) (319,539,984)<br />
Cash Flows From Investing Activities<br />
Purchase of investment securities (139,819,901) (171,495,362)<br />
Proceeds from sales and maturities of investment securities 152,710,000 253,652,000<br />
Interest received on investments and cash equivalents 9,340,293 23,018,214<br />
Net cash provided by investing activities 22,230,392 105,174,852<br />
Net Decrease in Cash and Cash Equivalents (128,431,395) (153,781,826)<br />
Cash and Cash Equivalents, Beginning of Year 442,722,080 596,503,906<br />
Cash and Cash Equivalents, End of Year $ 314,290,685 $ 442,722,080<br />
See Notes to Financial Statements