t7TwFQ
t7TwFQ
t7TwFQ

Create successful ePaper yourself
Turn your PDF publications into a flip-book with our unique Google optimized e-Paper software.
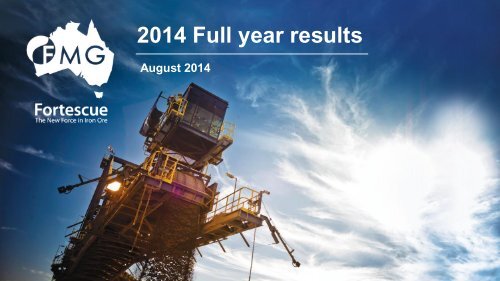
2014 Full year results<br />
August 2014
Disclaimer<br />
2<br />
Important Notice<br />
The purpose of this presentation is to provide general information about Fortescue Metals Group Limited ("Fortescue").<br />
It is not recommended that any person makes any investment decision in relation to Fortescue based on this presentation.<br />
This presentation contains certain statements which may constitute "forward-looking statements". Such statements are only<br />
predictions and are subject to inherent risks and uncertainties which could cause actual values, results, performance or achievements<br />
to differ materially from those expressed, implied or projected in any forward-looking statements.<br />
No representation or warranty, express or implied, is made by Fortescue that the material contained in this presentation will<br />
be achieved or prove to be correct. Except for statutory liability which cannot be excluded, each of Fortescue, its officers, employees<br />
and advisers expressly disclaims any responsibility for the accuracy or completeness of the material contained in this presentation<br />
and excludes all liability whatsoever (including in negligence) for any loss or damage which may be suffered by any person as<br />
a consequence of any information in this presentation or any error or omission therefrom. Fortescue accepts no responsibility<br />
to update any person regarding any inaccuracy, omission or change in information in this presentation or any other information<br />
made available to a person nor any obligation to furnish the person with any further information.<br />
Additional Information<br />
This presentation should be read in conjunction with the Annual Financial Report as at 30 June 2014 and together with any<br />
announcements made by Fortescue in accordance with its continuous disclosure obligations arising under the Corporations Act 2001.<br />
Any references to reserve and resources estimations should be read in conjunction with Fortescues Mineral Resource and Ore Reserve<br />
Statement at 30 June 2014 as release to the Australian Securities Exchange on 20 August 2014.<br />
All amounts within this presentation are stated in United States Dollars consistent with the Functional Currency of<br />
Fortescue Metals Group Limited. Tables contained within this presentation may contain immaterial rounding differences.
Fortescue Update<br />
The journey continues
Building a world class company<br />
Reliable and competitive supplier to Asia<br />
• First ore 2008<br />
• 400mt shipped to date<br />
• 155mtpa production rate<br />
• Large growing resource base<br />
• Unique culture<br />
4
FY14 in review<br />
Delivering 155mtpa<br />
124.2mt YTD<br />
38.7mt June Qtr<br />
155mtpa<br />
Annualised run rate<br />
US$2.4bn<br />
cash on hand<br />
$US3.1bn<br />
debt reduction<br />
Infrastructure complete<br />
Mines and processing<br />
facilities ramped up<br />
Costs 23%<br />
efficiency focus<br />
6
mt<br />
US$bn<br />
Fortescue overview<br />
Record operational performance delivers NPAT of US$2.7bn and EBITDA* of US$5.6bn<br />
Volume 54% Costs<br />
23%<br />
140.0<br />
50<br />
105.0<br />
70.0<br />
35.0<br />
7<br />
-<br />
6.0<br />
4.0<br />
2.0<br />
-<br />
FY10 FY11 FY12 FY13 FY14<br />
Earnings EBITDA 58% NPAT 57%<br />
EBITDA<br />
NPAT<br />
FY10 FY11 FY12 FY13 FY14<br />
* Refer to attached glossary for definitions of non IFRS terms<br />
US$bn US$/wmt<br />
40<br />
30<br />
20<br />
14.0<br />
10.5<br />
7.0<br />
3.5<br />
-<br />
Debt<br />
FY10 FY11 FY12 FY13 FY14<br />
US$3.1bn<br />
+$0.5bn<br />
Oct 14<br />
FY10 FY11 FY12 FY13 FY14
Building a world class company<br />
World class infrastructure<br />
• Over 10,000 jobs<br />
• 5 mines; 5 processing plants<br />
• 3 airports; 30,000 passengers/month<br />
• 5 berths; 75 ships/month<br />
• 620km rail; 45 locos, 3,384 ore cars<br />
8
Foundation for the future
Disciplined capital management<br />
Track record of debt repayment delivering investment grade metrics<br />
• Increased cashflow and lower capex<br />
• US$2-$2.5bn targeted additional<br />
repayments<br />
7.0<br />
6.0<br />
5.0<br />
160<br />
140<br />
120<br />
- Gearing ~40%<br />
- Net Debt to Equity ~50%<br />
• Net debt (June 14) US$7.2bn<br />
4.0<br />
3.0<br />
2.0<br />
1.0<br />
100<br />
80<br />
60<br />
40<br />
20<br />
• FY15 capital US$1.3bn<br />
0.0<br />
2010 (act) 2011 (act) 2012 (act) 2013 (act) 2014 (act) 2015 (est)<br />
Capital expenditure<br />
Production (RHS)<br />
0<br />
10
Ongoing projects<br />
• Targeted exploration continues to increase resource base<br />
• AP5 berth adds 15 – 20mtpa outload capacity<br />
• Detrital processing plant adds 5mtpa capacity at Solomon<br />
• Autonomous haulage increases operational cost efficiencies<br />
• Ship construction 260k dwt ore carriers<br />
11
Port – flexible design for future growth<br />
Fifth berth under construction<br />
AP3<br />
AP2<br />
AP1<br />
AP4<br />
AP5<br />
2015<br />
12
Financials
Highlights<br />
Record financial results<br />
Revenue<br />
US$11.8bn<br />
C1 costs<br />
US$34/wmt<br />
EBITDA<br />
US$5.6bn<br />
NPAT<br />
US$2.7bn<br />
45%<br />
23%<br />
58%<br />
57%<br />
Debt re-paid<br />
US$3.1bn + US$0.5bn committed<br />
Interest savings<br />
in excess of US$330m p.a.<br />
Total FY14 dividends<br />
A$0.20 / share fully franked<br />
14
Operating revenue, US$bn<br />
Price realisation, US$/dmt<br />
Earning growth<br />
Strong financial results reflect operational performance<br />
Revenue and price realisation<br />
EBITDA, US$ millions<br />
14.0<br />
160<br />
5,636<br />
10.5<br />
120<br />
7.0<br />
80<br />
2,661<br />
3,035<br />
3,575<br />
3.5<br />
40<br />
1,107<br />
0.0<br />
FY10 FY11 FY12 FY13 FY14<br />
Revenue<br />
Realised CFR price<br />
-<br />
FY10 FY11 FY12 FY13 FY14<br />
Net profit after tax, US$ millions<br />
Basic earning per share, US cents<br />
2,740<br />
88.00<br />
581<br />
1,019<br />
1,559<br />
1,746<br />
18.85<br />
32.86<br />
50.07<br />
56.07<br />
FY10 FY11 FY12 FY13 FY14<br />
FY10 FY11 FY12 FY13 FY14<br />
15
Operating margins<br />
Solid operating margins maintained<br />
US$/wmt<br />
62% Platts US$/dmt<br />
200<br />
200<br />
180<br />
180<br />
160<br />
$146<br />
160<br />
140<br />
$127<br />
$127<br />
140<br />
$114<br />
120<br />
$110 $113<br />
120<br />
$100<br />
$74<br />
$96<br />
100<br />
$65<br />
$57<br />
$45<br />
$85 100<br />
80<br />
$44<br />
$28 $53 $60<br />
$64<br />
80<br />
$35<br />
60<br />
$22<br />
$18<br />
$22 $20 $18<br />
60<br />
$22<br />
$24<br />
$18<br />
40<br />
$20 $16<br />
$19<br />
40<br />
20<br />
$27 $34 $39<br />
$50 $48 $49 $50<br />
$39 $33 $34 20<br />
0<br />
0<br />
1H2010 2H2010 1H2011 2H2011 1H2012 2H2012 1H2013 2H2013 1H2014 2H2014<br />
C1 cost Other operating cost CFR operating margin 62% Platts index (RHS)<br />
• Total delivered cost US$52/wmt (US$56/dmt) in FY14<br />
• C1 guidance of US$31-32/wmt in FY15<br />
16
EBITDA<br />
Ramp-up of operations and sustained cost savings deliver record financial results<br />
1,203<br />
829<br />
2,079<br />
276<br />
149<br />
33<br />
5,636<br />
3,575<br />
FY13 Volume Costs Price Royalty Fx Other FY14<br />
• Increased shipments - record production<br />
• Continued focus on production costs C1 $34/wmt<br />
54%<br />
23%<br />
17
Driving down the global cost curve<br />
Production costs<br />
35% reduction generating ~ US$2.6bn lower costs<br />
FY12<br />
$48<br />
CB and CC1 operations<br />
58mt production @ SR 4.3 with 2 OPF’s + 3 Berths<br />
FY13<br />
$44<br />
CC2, Hamersley line, Firetail, CB WFE<br />
80mt production @ SR 3.9 from 4 OPF’s + 3 Berths<br />
FY14<br />
FY15<br />
$34<br />
$31-32<br />
AP4, Kings Valley, ITCS, 5 OPF’s + 4 Berths<br />
124mt production @ SR 2.9 from 5 OPF’s + 4 Berths<br />
155mtpa run rate achieved<br />
Full operation capacity achieved + AP5<br />
in March 2015<br />
155 -160mt, SR maintained + efficiency focus<br />
18
Cashflow FY14<br />
Record net free cash flow US$4.3bn<br />
US$m<br />
9,000<br />
6,000<br />
3,000<br />
1,294<br />
2,778 2,808 3,004<br />
6,248<br />
-<br />
(3,000)<br />
(6,000)<br />
(9,000)<br />
FY10<br />
(584)<br />
(1,477)<br />
FY11<br />
Operating cash flow<br />
• Increased production volumes and lower costs<br />
improve operating cash flows<br />
• T155 expansion complete<br />
(6,044) (6,355)<br />
FY12<br />
Capital expenditure<br />
FY13<br />
FY14<br />
(1,931)<br />
19
Capital expenditure<br />
Significant reduction in expenditure as expansion complete<br />
US$bn<br />
7.5<br />
6.0<br />
4.5<br />
3.0<br />
1.5<br />
0.0<br />
FY10 FY11 FY12 FY13 FY14 FY15(est)<br />
• FY15 capital US$1.3bn<br />
• Depreciation and amortisation ~$8.50/t<br />
20
US$m<br />
US$3.1bn re-paid + US$0.5bn committed<br />
Flexibility to enables further repayments and re-financing<br />
5,000<br />
4,500<br />
4,000<br />
3,500<br />
3,000<br />
2,500<br />
2,000<br />
1,500<br />
1,000<br />
500<br />
0<br />
Callable<br />
in April<br />
2015<br />
1,000<br />
Callable at<br />
Fortescue's<br />
option<br />
500<br />
400<br />
4,913<br />
1,500<br />
Repayable at Fortescue's option<br />
Callable<br />
in November<br />
2015<br />
Callable in<br />
April 2017<br />
1,000<br />
CY2015 CY2016 CY2017 CY2018 CY2019 CY2020 CY2021 CY2022<br />
Senior Secured Credit Facility Senior Unsecured Notes Committed to be paid in October 2014<br />
Current ratings Corporate Term Loan Notes<br />
Moody’s Ba1/Stable Baa3 Ba2<br />
S&P BB/Positive BBB- BB-<br />
Fitch BB+/Stable BBB- BB+<br />
21
Cost of borrowings<br />
Focus on debt reduction lowering interest costs<br />
• Cost of borrowings reduced<br />
to 5.3%*<br />
• Debt repayments US$3.1bn<br />
+ US$0.5bn committed in Oct 14<br />
• Intention to re-pay additional<br />
US$0.5bn to US$1.0bn in FY15<br />
10.1%<br />
7.0% 7.0%<br />
6.3%<br />
5.3%<br />
• Debt reductions + refinancing reduce<br />
borrowing costs by US$330m p.a.<br />
FY10 FY11 FY12 FY13 FY14<br />
22<br />
*Cost of borrowings are calculated at 30 June and exclude Leucadia notes and finance leases
Key credit metrics<br />
Moving towards investment grade metrics<br />
2.7x<br />
Debt to EBITDA<br />
2.8x<br />
3.5x<br />
Gearing: Debt / (Debt+Equity)<br />
67% 67% 69% 71%<br />
56%<br />
1.8x<br />
1.7x<br />
FY10 FY11 FY12 FY13 FY14<br />
Interest coverage: EBITDA / Interest<br />
FY10 FY11 FY12 FY13 FY14<br />
Cash and debt (US$bn)<br />
5.4x<br />
6.9x<br />
8.5<br />
12.7<br />
9.6<br />
2.8x<br />
4.0x 3.9x<br />
FY10 FY11 FY12 FY13 FY14<br />
4.9<br />
3.0<br />
2.7 2.3 2.2 2.4<br />
1.2<br />
FY10 FY11 FY12 FY13 FY14<br />
23
Dividends<br />
Fully franked A$0.20 dividend for FY14<br />
Dividends, AUD cents per share Dividend payout ratio, %<br />
30<br />
3,000<br />
30%<br />
20<br />
20<br />
2,000<br />
20%<br />
10<br />
7<br />
8<br />
10<br />
1,000<br />
10%<br />
-<br />
-<br />
FY10 FY11 FY12 FY13 FY14<br />
-<br />
FY10 FY11 FY12 FY13 FY14<br />
0%<br />
Interim Final<br />
Net income Dividend payout ratio(RHS)<br />
• Modest dividends – focus on debt reduction<br />
• Increased dividends reflect improved financial performance<br />
• Moving towards dividend payout ratio of 30 to 40%<br />
24
Market
China’s growth cities<br />
200m people to urbanise by 2020<br />
• GDP doubled in 6 years<br />
• China has just reached steel<br />
consumption levels of a<br />
developed country<br />
• Record daily steel<br />
production 2.3mt<br />
• Iron ore imports +20% YTD<br />
26
Nov-11<br />
Dec-11<br />
Jan-12<br />
Feb-12<br />
Mar-12<br />
Apr-12<br />
May-12<br />
Jun-12<br />
Jul-12<br />
Aug-12<br />
Sep-12<br />
Oct-12<br />
Nov-12<br />
Dec-12<br />
Jan-13<br />
Feb-13<br />
Mar-13<br />
Apr-13<br />
May-13<br />
Jun-13<br />
Jul-13<br />
Aug-13<br />
Sep-13<br />
Oct-13<br />
Nov-13<br />
Dec-13<br />
Jan-14<br />
Feb-14<br />
Mar-14<br />
Apr-14<br />
May-14<br />
Jun-14<br />
Jul-14<br />
Aug-14<br />
Iron ore price volatility<br />
Realisations at 85–90% as supply re-balances and products transition<br />
$170<br />
$160<br />
$150<br />
$140<br />
$130<br />
$120<br />
$110<br />
$100<br />
$90<br />
$80<br />
$70<br />
$60<br />
$50<br />
Iron Ore Price (62% Fe CFR - Platts IODEX China)<br />
27
Steel consumption per capita<br />
China has only just reached levels of consumption of a developed country<br />
Kg per<br />
capita<br />
800<br />
2014 - 2020<br />
Forecast<br />
700<br />
600<br />
500<br />
400<br />
300<br />
200<br />
100<br />
GDP<br />
0<br />
1900 1910 1920 1930 1940 1950 1960 1970 1980 1990 2000 2010 2020<br />
China<br />
US<br />
28<br />
Source: Macquarie Research
Demand for seaborne supply<br />
New coastal steel capacity moving away from domestic iron ore<br />
Iron Ore<br />
Reserves<br />
New/proposed<br />
steel capacity<br />
Seaborne<br />
iron ore<br />
Seaborne iron ore imports (Ex. Australia, Brazil etc.)<br />
29<br />
Source: ANZ Research
30<br />
Clear strategy
US$/dry tonne<br />
Fortescue<br />
Moving down the global cost curve<br />
Targeting bottom quartile<br />
200<br />
150<br />
China Iron Ore Supply CFR Costs – May 2014 (including royalties and freight)<br />
Domestic Chinese Ore<br />
Australia<br />
Brazil<br />
India<br />
South Africa<br />
Other<br />
100<br />
50<br />
0<br />
0 100 200 300 400 500 600 700 800 900 1,000 1,100 1,200<br />
Cumulative Mt (wet, as delivered)<br />
31<br />
Source: Metalytics
Significant reliance on diesel fuel<br />
Driven by remote power and mobile fleet consumption<br />
Total energy spend >US$800 million<br />
Diesel<br />
(Mine Fleet)<br />
Diesel<br />
(Mine Power Generation)<br />
Diesel (Rail)<br />
Gas<br />
(Power Generation)<br />
Diesel<br />
(Ancillary)<br />
32
Fortescue River gas pipeline<br />
Stage 1 – to Solomon Hub<br />
33
Competitive energy powering the future<br />
Unlocking Australia’s energy advantage<br />
• Transparent Retention Leases enforce<br />
“Use it or lose it” policy<br />
• Competitively priced energy for<br />
our economy<br />
• Reducing carbon emissions<br />
• Gross State Product +$2.5 billion in 2020<br />
34
Reserves and resources
Mineral Resources dry in situ (Mt)<br />
Resource portfolio supports asset base<br />
Drilling as required and extend through near mine exploration<br />
12,000<br />
10,000<br />
2,463<br />
2,013<br />
2,463<br />
740<br />
8,000<br />
1,032<br />
624 624<br />
6,000<br />
624<br />
3,246 3,504<br />
4,877<br />
4,000<br />
2,000<br />
-<br />
1,715<br />
2,224<br />
2,860<br />
695 695 695<br />
2,266 2,227 2,143<br />
1,230 1,230<br />
-<br />
3,070<br />
695<br />
2,550<br />
2,465<br />
695 695<br />
5,205<br />
303<br />
3,379 3,237 3,222 3,222<br />
2008 2009 2010 2011 2012 2013 2014<br />
Chichester Hub Chichester Other Solomon Hub Western Hub Nyidinghu Magnetite<br />
4,676<br />
36
Mine lives based on current reserves<br />
Fortescue mine lives compare favourably<br />
Reserve and Resource Tonnages (dry)<br />
Ore Reserve Life (Years)<br />
25<br />
25<br />
20<br />
20<br />
15<br />
15<br />
10<br />
10<br />
5<br />
5<br />
0<br />
Fortescue BHPBIO RTIO<br />
0<br />
Fortescue BHPBIO RTIO<br />
Reserves M&I Resources Total Resources<br />
Based on last 12 months Sales<br />
Based on Forecast Annual Production<br />
37<br />
Based on latest company announcements
Hematite reserves<br />
Reserve base supports extended operations<br />
Million Tonnes* Fe %<br />
Cloudbreak 500 57.6<br />
Christmas Creek 970 57.3<br />
Chichester Total 1,470 57.4<br />
Firetail 174 58.7<br />
Kings Valley 729 56.9<br />
Solomon Total 903 57.2<br />
Fortescue Total 2,373 57.3<br />
* Product tonnes on a dry tonne basis<br />
• Focused exploration programs<br />
• Significant reserve lives<br />
• Chichester single ore body,<br />
transferable between CB + CC<br />
• Significant BID prospectivity at:<br />
– Mt MacLeod (Solomon)<br />
– Fredricks (Solomon)<br />
– Kutayi (Chichesters)<br />
38
Supporting our local community
VTEC<br />
Creating opportunities through training and employment<br />
1,100 Aboriginal employees<br />
12%<br />
$1.5bn+<br />
VTEC<br />
Training Centres<br />
Aboriginal people in<br />
Fortescue workforce<br />
Contracts to Aboriginal<br />
companies and JV’s<br />
Roebourne,<br />
South Hedland<br />
40
Building our economy<br />
Unlocking the potential of WA’s North West<br />
15,000<br />
employed<br />
AU$800m*<br />
wages p.a.<br />
AU$2.1bn<br />
taxes and royalties p.a.<br />
AU$490m<br />
localised spend FY14<br />
41<br />
* applies to full time employee wages only
Delivering on targets<br />
Focused on shareholder value<br />
• 155mt production rate achieved<br />
• Committed to debt reduction – initial<br />
gearing target 40%<br />
• Moving towards dividend payout<br />
ratio of 30% - 40% once the gearing<br />
target is achieved<br />
• Early work to secure strategic options with<br />
high value opportunities
Sign up to alerts online: www.fmgl.com.au<br />
Proudly supporting:<br />
Proudly supporting:
Glossary<br />
Definition of non-IFRS terms<br />
NPAT = net profit after income tax<br />
EBITDA = profit before income tax adjusted for depreciation and<br />
amortisation, asset write offs, exploration, development and other<br />
write-offs, net finance costs and gain or loss on refinancing<br />
Debt = Current and non-current borrowings and financial liabilities<br />
Net debt = debt + cash and cash equivalents<br />
Gearing = debt / (debt + equity)<br />
C1 = costs of mining, processing, rail and port per wet metric<br />
tonne<br />
Total delivered costs = C1 + shipping, royalties and<br />
administration costs<br />
Free cash flow = operating cash flow – capital expenditure<br />
Return on equity = profit for the year after income tax divided by<br />
total equity<br />
Interest coverage = EBITDA / interest expense<br />
Reconciliation of EBITDA to IFRS items<br />
2014 2013<br />
US$m US$m<br />
Profit before income tax 3,913 2,466<br />
Finance income (21) (33)<br />
Finance expenses 741 586<br />
Gain on refinancing - (23)<br />
Depreciation and amortisation 965 463<br />
Impairment 22 71<br />
Exploration, development and other 16 45<br />
EBITDA 5,636 3,575<br />
Earnings per share (EPS) = profit for the year after income tax<br />
divided by undiluted weighted average ordinary shares.<br />
Non IFRS information disclosed in this presentation has not been<br />
subject to audit.<br />
dmt = dry metric tonne<br />
wmt = wet metric tonne<br />
mtpa = million tonnes per annum<br />
44