Management's Discussion and Analysis - Yamaha
Management's Discussion and Analysis - Yamaha
Management's Discussion and Analysis - Yamaha
You also want an ePaper? Increase the reach of your titles
YUMPU automatically turns print PDFs into web optimized ePapers that Google loves.
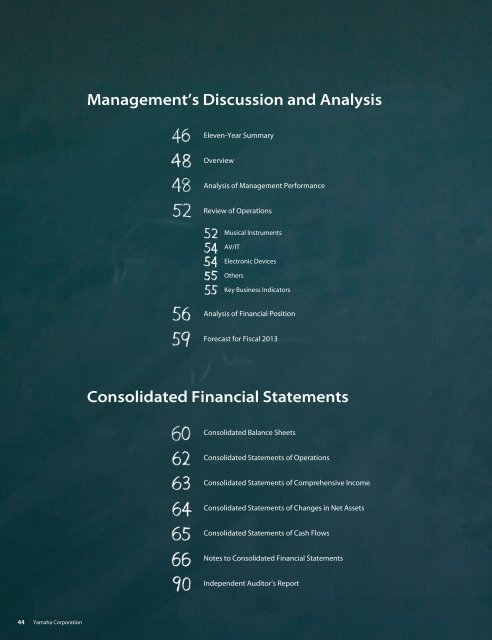
Management’s <strong>Discussion</strong> <strong>and</strong> <strong>Analysis</strong><br />
Eleven-Year Summary<br />
Overview<br />
<strong>Analysis</strong> of Management Performance<br />
Review of Operations<br />
Musical Instruments<br />
AV/IT<br />
Electronic Devices<br />
Others<br />
Key Business Indicators<br />
<strong>Analysis</strong> of Financial Position<br />
Forecast for Fiscal 2013<br />
Consolidated Financial Statements<br />
Consolidated Balance Sheets<br />
Consolidated Statements of Operations<br />
Consolidated Statements of Comprehensive Income<br />
Consolidated Statements of Changes in Net Assets<br />
Consolidated Statements of Cash Flows<br />
Notes to Consolidated Financial Statements<br />
Independent Auditor’s Report<br />
44<br />
<strong>Yamaha</strong> Corporation
Fiscal 2012 Summary<br />
✱ Sales <strong>and</strong> earnings in fiscal 2012 declined year on year<br />
✱ The yen’s sudden <strong>and</strong> steep appreciation had a major impact<br />
✱ Operating income declined year on year due to a sluggish semiconductor business <strong>and</strong> parts procurement problems<br />
caused by the Great East Japan Earthquake<br />
✱ A substantial loss was recorded from the reversal of deferred tax assets<br />
Consolidated Statements of Operations Summary<br />
(Millions of yen)<br />
Consolidated Balance Sheets Summary<br />
(Millions of yen)<br />
Fiscal 2011 Fiscal 2011<br />
373,866<br />
Net sales<br />
Operating income<br />
13,165<br />
194,717<br />
Total assets<br />
390,852<br />
74,836<br />
71,013<br />
Net income<br />
5,078<br />
108,267<br />
245,002<br />
87,867<br />
Fiscal 2012 Fiscal 2012<br />
Net sales<br />
Cost of sales<br />
Selling, general <strong>and</strong><br />
administrative expenses<br />
Operating income<br />
Other expenses<br />
8,110<br />
1,139<br />
116,846<br />
356,616<br />
231,659<br />
188,952<br />
106,858<br />
70,799<br />
Total assets<br />
366,610<br />
72,829<br />
86,948<br />
206,832<br />
Deferred<br />
income taxes<br />
Minority interests<br />
in income<br />
Net loss<br />
274<br />
Current income taxes<br />
3,959<br />
32,117<br />
-29,381<br />
■ Current assets<br />
■ Property, plant <strong>and</strong> equipment<br />
■ Investments <strong>and</strong> other assets<br />
■ Current liabilities<br />
■ Noncurrent liabilities<br />
■ Net assets<br />
Annual Report 2012<br />
45
Eleven-Year Summary<br />
<strong>Yamaha</strong> Corporation <strong>and</strong> consolidated subsidiaries<br />
Years ended March 31 2002 2003 2004 2005<br />
For the year:<br />
Net sales ¥ 504,406 ¥ 524,763 ¥ 539,506 ¥ 534,079<br />
Cost of sales 340,411 338,307 337,813 335,483<br />
Gross profit 163,994 186,456 201,693 198,595<br />
Selling, general <strong>and</strong> administrative expenses 152,951 154,413 156,637 162,899<br />
Operating income 11,043 32,043 45,056 35,695<br />
Income (loss) before income taxes <strong>and</strong> minority interests (5,784) 22,612 47,456 33,516<br />
Net income (loss) (10,274) 17,947 43,541 19,697<br />
Capital expenditures 16,627 16,883 21,160 22,702<br />
Depreciation expenses 18,767 17,586 17,522 18,958<br />
R&D expenses 22,539 22,441 22,503 22,953<br />
Cash flows from operating activities 29,016 33,052 58,349 39,588<br />
Cash flows from investing activities (10,437) (21,645) (18,775) (12,896)<br />
Free cash flow 18,579 11,407 39,574 26,692<br />
At year-end:<br />
Total assets ¥ 509,663 ¥ 512,716 ¥ 508,731 ¥ 505,577<br />
Total current assets 211,140 221,089 201,704 225,581<br />
Total current liabilities 144,498 158,148 123,596 145,820<br />
Interest-bearing liabilities 96,166 90,436 48,871 46,598<br />
Net assets* 2 201,965 214,471 259,731 275,200<br />
Per share:<br />
Net income (loss) ¥ (49.75) ¥ 86.65 ¥ 210.63 ¥ 95.06<br />
Net assets* 2 978.15 1,040.06 1,259.28 1,334.51<br />
Dividends* 3 8.00 10.00 15.00 20.00<br />
Key indicators:<br />
Operating income to net sales 2.2 6.1 8.4 6.7<br />
ROE (Return on equity)* 2 (5.2) 8.6 18.4 7.4<br />
ROA (Return on assets) (2.0) 3.5 8.5 3.9<br />
Equity ratio* 2 39.6 41.8 51.1 54.4<br />
D/E ratio (Times) 0.48 0.42 0.19 0.17<br />
Interest coverage (Times) 5.07 19.97 36.51 44.62<br />
Current ratio 146.1 139.8 163.2 154.7<br />
Dividend payout ratio — 11.5 7.1 21.0<br />
*1. U.S. dollar amounts are translated from yen at the rate of ¥82.19= U.S.$1.00, the approximate rate prevailing on March 31, 2012.<br />
*2. Net assets, ROE (return on equity) <strong>and</strong> equity ratio were classified as shareholders’ equity, ROE (return on shareholders’ equity) <strong>and</strong> shareholders’ equity ratio, respectively,<br />
until the year ended March 31, 2006.<br />
*3. The dividends per share from the years ended March 2008 to March 2010 include a ¥20 special dividend.<br />
46 <strong>Yamaha</strong> Corporation
Thous<strong>and</strong>s of<br />
Millions of yen %<br />
U.S. dollars* 1<br />
2006 2007 2008 2009 2010 2011 2012 2011/2012 2012<br />
¥ 534,084 ¥ 550,361 ¥ 548,754 ¥ 459,284 ¥ 414,811 ¥ 373,866 ¥356,616 -4.6 $4,338,922<br />
341,816 352,382 343,686 290,381 268,380 237,313 231,659 -2.4 2,818,579<br />
192,267 197,980 205,066 168,902 146,431 136,553 124,957 -8.5 1,520,343<br />
168,132 170,295 172,220 155,057 139,602 123,387 116,846 -5.3 1,421,657<br />
24,135 27,685 32,845 13,845 6,828 13,165 8,110 -38.4 98,674<br />
35,842 33,101 62,510 (12,159) (201) 6,802 6,971 2.5 84,816<br />
28,123 27,866 39,558 (20,615) (4,921) 5,078 (29,381) — (357,477)<br />
22,882 25,152 24,394 22,581 14,480 10,439 11,337 +8.6 137,936<br />
18,944 19,956 20,289 17,912 14,139 12,814 11,973 -6.6 145,675<br />
24,055 24,220 24,865 23,218 21,736 22,416 22,819 +1.8 277,637<br />
25,510 39,732 37,225 (2,235) 39,870 22,646 10,880 -52.0 132,376<br />
(18,104) (22,427) 41,999 (25,999) (12,711) (9,740) (9,004) +7.6 (109,551)<br />
7,406 17,305 79,225 (28,234) 27,159 12,906 1,875 -85.5 22,813<br />
¥ 519,977 ¥ 559,031 ¥ 540,347 ¥ 408,974 ¥ 402,152 ¥ 390,852 ¥366,610 -6.2 $4,460,518<br />
209,381 231,033 275,754 202,097 193,260 194,717 188,952 -3.0 2,298,966<br />
117,047 136,656 120,174 90,050 75,182 74,836 72,829 -2.7 886,105<br />
28,474 25,551 21,036 19,192 15,017 11,838 11,295 -4.6 137,425<br />
316,005 351,398 343,028 251,841 254,591 245,002 206,832 -15.6 2,516,511<br />
Yen<br />
U.S. dollars<br />
¥ 136.04 ¥ 135.19 ¥ 191.76 ¥ (103.73) ¥ (24.95) ¥ 25.90 ¥ (151.73) $(1.85)<br />
1,532.62 1,680.91 1,646.44 1,262.42 1,276.35 1,250.06 1,052.01 12.80<br />
20.00 22.50 50.00 42.50 27.50 10.00 10.00 0.12<br />
%<br />
4.5 5.0 6.0 3.0 1.6 3.5 2.3<br />
9.5 8.4 11.5 (7.0) (2.0) 2.1 (13.2)<br />
5.5 5.2 7.2 (4.3) (1.2) 1.3 (7.8)<br />
60.8 62.0 62.9 60.9 62.6 61.9 55.6<br />
0.09 0.07 0.06 0.08 0.06 0.05 0.05<br />
36.89 47.83 34.56 26.74 16.88 40.38 31.84<br />
178.9 169.1 229.5 224.4 257.1 260.2 259.4<br />
14.7 16.6 26.1 — — 38.6 —<br />
Annual Report 2012<br />
47
Overview<br />
Economic Environment<br />
In fiscal 2012, ended March 31, 2012, with slow economic recovery<br />
in the United States, an economic downturn triggered by the debt<br />
crisis in southern Europe from the summer of 2011, <strong>and</strong> other factors,<br />
developed markets continued to face economic uncertainty. Signs<br />
of slower economic growth were seen in some emerging markets<br />
including China. Although production <strong>and</strong> consumer spending, which<br />
had declined after the Great East Japan Earthquake, were on track to<br />
recovery, the Japanese economy continued to face adverse conditions,<br />
as lackluster business performance <strong>and</strong> the yen’s record-high<br />
appreciation had a major negative impact on corporate earnings.<br />
Business Environment for the <strong>Yamaha</strong> Group<br />
In fiscal 2012, parts procurement problems following the Great<br />
East Japan Earthquake of March 2011 hindered our ability to supply<br />
products, primarily digital musical instruments, to markets. The early<br />
autumn floods in Thail<strong>and</strong> also had a negative impact on AV product<br />
sales. In addition to the economic adversity caused by slow economic<br />
recovery in North America, the slowdown in European markets, <strong>and</strong><br />
the yen’s record-high appreciation, we continued to face extreme<br />
difficulties in the electronic devices market due to flagging dem<strong>and</strong><br />
for sound generator LSIs for mobile phones, a slowly rebounding<br />
semiconductor market for amusement equipment, <strong>and</strong> the slow sales<br />
of manufacturing customers.<br />
Business Performance Summary<br />
Faced with a harsh business environment in fiscal 2012, the <strong>Yamaha</strong><br />
Group took steps to minimize the effects of parts procurement problems<br />
on digital musical instruments, professional audio equipment,<br />
<strong>and</strong> on AV products. Despite these problems, the Group made every<br />
possible effort to ensure its products reached the market. In emerging<br />
markets including China, a growth market for <strong>Yamaha</strong>, we launched<br />
products tailored to local needs <strong>and</strong> preferences, <strong>and</strong> aggressively<br />
exp<strong>and</strong>ed our sales network, <strong>and</strong> increased the number of <strong>Yamaha</strong><br />
Music Schools. We implemented manufacturing structural reforms<br />
by first completing the integration of our Japan piano manufacturing<br />
bases in 2011. After that we finished the integration of our Japan wind<br />
instrument manufacturing bases.<br />
As a result, net sales in fiscal 2012 slipped 4.6%, year on year, to<br />
¥356,616 million, due to declining revenue in all segments including<br />
musical instruments. Operating income was also down 38.4%, to ¥8,110<br />
million. In addition, a net loss of ¥29,381 million was recorded (compared<br />
with net income of ¥5,078 million in fiscal 2011) on an increase<br />
in income taxes deferred following the reversal of deferred tax assets.<br />
The reason for the reversal of deferred tax assets was that for <strong>Yamaha</strong>’s<br />
nonconsolidated retained loss for both fiscal years ended March 31,<br />
2009 <strong>and</strong> March 31, 2010, the taxable income that could be eliminated<br />
within the carry over time limit would not be fully expected. After carefully<br />
examining the recoverability of deferred tax assets, <strong>Yamaha</strong> <strong>and</strong><br />
its consolidated subsidiaries, which apply consolidated tax accounting,<br />
reversed a total of ¥32,057 million in deferred tax assets.<br />
<strong>Analysis</strong> of Management Performance<br />
Net Sales<br />
¥356,616 million -4.6%<br />
Sales by Segment<br />
(Millions of yen)<br />
600,000<br />
Net sales in fiscal 2012 decreased by ¥17,249 million, or 4.6%, to<br />
¥356,616 million. Net sales came in approximately ¥12,800 million<br />
below our initial target. This was attributable to a number of factors<br />
including a sales decline of ¥10,300 million caused by foreign currency<br />
effects, parts procurement difficulties, mainly for digital musical<br />
instruments, stemming from the Great East Japan Earthquake, product<br />
supply delays, production cutbacks by customers that manufacture<br />
electronic parts <strong>and</strong> interior wood components for automobiles, <strong>and</strong><br />
the effects of flooding in Thail<strong>and</strong> on AV product sales.<br />
400,000<br />
356,616<br />
■ Musical instruments<br />
■ AV/IT<br />
200,000<br />
■ Electronic devices* 1<br />
■ Others<br />
■ Lifestyle-related products* 2<br />
0<br />
■ Recreation* 3<br />
08/3 09/3 10/3 11/3 12/3<br />
*1. Following the h<strong>and</strong>over of the electronic metal products business, the electronic equipment<br />
<strong>and</strong> metal products segment was renamed the electronic devices segment starting<br />
from the year ended March 31, 2009.<br />
*2. Following the h<strong>and</strong>over of the lifestyle-related products business on March 31, 2010, this<br />
segment has been excluded from consolidation from the year ended March 31, 2011.<br />
*3. Following the h<strong>and</strong>over of a portion of the resort facilities, figures of the others segment<br />
from the year ended March 31, 2009 include that of the recreation segment. The magnesium<br />
molded parts business was terminated as of March 31, 2010.<br />
48 <strong>Yamaha</strong> Corporation
Management’s <strong>Discussion</strong> <strong>and</strong> <strong>Analysis</strong><br />
Sales by Region<br />
Fiscal 2012 sales in Japan declined ¥12,468 million, or 6.9%, year on<br />
year, to ¥167,105 million. Piano <strong>and</strong> wind instruments sales were firm,<br />
but AV products <strong>and</strong> commercial online karaoke equipment sales<br />
were down due to the Great East Japan Earthquake’s effects. Sales in<br />
the electronic devices segment declined sharply owing to a late pick<br />
up of graphics controller LSIs used in amusement equipment.<br />
Outside of Japan, sales decreased by ¥4,781 million, or 2.5%, year<br />
on year, to ¥189,511 million. The Chinese market maintained its high<br />
growth rate, while sales in other areas, especially emerging markets,<br />
were also strong. Nevertheless, sales declined on the back of the<br />
late recovery of the North American market <strong>and</strong> Europe’s economic<br />
downturn triggered by the sovereign debt crisis in southern Europe.<br />
Another factor contributing to the sales decrease was the yen’s rapid<br />
<strong>and</strong> drastic appreciation. The ratio of overseas sales to net sales was<br />
1.1 percentage points higher than in fiscal 2011, rising from 52.0% to<br />
53.1%.<br />
By region, sales in North America were down ¥4,712 million, or<br />
8.6%, year on year, to ¥49,922 million. The decline in sales of AV <strong>and</strong><br />
other products due to intense competition, along with the almost<br />
¥4,000 million decrease from foreign currency translation effects,<br />
resulted in a sales decrease of only ¥700 million, or 1.4%, if we exclude<br />
foreign currency effects.<br />
In Europe, sales declined ¥3,855 million, or 6.0%, to ¥60,822 million.<br />
Nearly ¥2,300 million of this decrease was caused by foreign currency<br />
translation effects. Although piano sales were brisk, even under<br />
the adverse economic conditions, sales of digital musical instruments,<br />
especially portable keyboards, as well as professional audio equipment<br />
declined, resulting in a sales decrease of ¥1,600 million, or 2.5%, in real<br />
terms.<br />
Sales in Asia, Oceania <strong>and</strong> other areas increased by ¥3,787<br />
million, or 5.1%, year on year, to ¥78,766 million. China maintained<br />
double-digit growth, especially in pianos, with sales in other areas<br />
also strong. Excluding the approximately ¥4,000 million decline from<br />
foreign currency effects, sales increased in real terms by roughly ¥7,800<br />
million, or 10.9%, year on year.<br />
Cost of Sales <strong>and</strong> Selling, General <strong>and</strong> Administrative Expenses<br />
The cost of sales in fiscal 2012 decreased ¥5,654 million, or 2.4%, to<br />
¥231,659 million. The cost of sales decrease was attributable to declining<br />
production <strong>and</strong> shipments, the appreciating yen, <strong>and</strong> other factors.<br />
The cost of sales ratio increased by 1.5 percentage points compared to<br />
the previous fiscal year, from 63.5% to 65.0%.<br />
Gross profit decreased by ¥11,595 million, or 8.5%, year on year,<br />
to ¥124,957 million. The gross profit ratio declined by 1.5 percentage<br />
points compared to the previous fiscal year, from 36.5% to 35.0%.<br />
Selling, general <strong>and</strong> administrative (SG&A) expenses decreased<br />
by ¥6,540 million, or 5.3%, to ¥116,846 million. Advertising expenses<br />
<strong>and</strong> sales promotion expenses declined ¥1,347 million, or 8.4%, from<br />
¥16,063 million to ¥14,716 million. Personnel expenses also declined<br />
¥2,549 million, or ¥4.4%, from ¥57,927 million to ¥55,378 million. The<br />
ratio of SG&A expenses to net sales decreased by 0.2 of a percentage<br />
point, to 32.8%. Excluding the approximately ¥2,200 million in foreign<br />
currency translation effects due to the strong yen, SG&A expenses<br />
were down by about ¥4,400 million in real terms.<br />
Major Items Included in<br />
Selling, General <strong>and</strong> Administrative Expenses<br />
Millions of yen %<br />
11/3 12/3 Change<br />
Sales commissions 1,358 1,263 –7.0<br />
Transport expenses 10,705 10,934 +2.1<br />
Advertising expenses <strong>and</strong> sales promotion<br />
expenses<br />
16,063 14,716 –8.4<br />
Allowance for doubtful accounts 106 53 –50.0<br />
Provision for product warranties 1,656 734 –55.7<br />
Provision for retirement benefits 5,299 4,916 –7.2<br />
Salaries <strong>and</strong> benefits 52,628 50,462 –4.1<br />
Rent 3,469 3,395 –2.1<br />
Depreciation <strong>and</strong> amortization 3,744 3,270 –12.7<br />
Sales by Region<br />
(Millions of yen)<br />
600,000<br />
400,000<br />
200,000<br />
356,616<br />
■ Japan<br />
■ North America<br />
■ Europe<br />
■ Asia, Oceania, <strong>and</strong> other areas<br />
0<br />
08/3 09/3 10/3 11/3 12/3<br />
Annual Report 2012<br />
49
Operating Income<br />
¥8,110 million -38.4%<br />
Operating income in fiscal 2012 dropped ¥5,055 million, or 38.4%,<br />
year on year, to ¥8,110 million. The decrease was largely due to substantially<br />
lower earnings, mainly of digital musical instruments, in the<br />
mainstay musical instruments segment in the aftermath of the Great<br />
East Japan Earthquake, as well as the recording of an operating loss in<br />
the electronic devices segment, compared with last year’s operating<br />
income. Positive factors included lower SG&A expenses, restructuring<br />
effects (approx. ¥500 million) resulting from piano manufacturing<br />
base integration, <strong>and</strong> an interest gain (approx. ¥600 million) on<br />
retirement benefit obligations. However, these were outweighed by<br />
such negatives as currency translation effects due to the strong yen<br />
(approx. ¥2,700 million), rising raw material prices (approx. ¥1,700<br />
million), expense increases (approx. ¥600 million) owing to domestic<br />
wind instrument manufacturing base integration, which resulted in a<br />
substantial operating income decline.<br />
Non-Operating Income <strong>and</strong> Expenses<br />
Non-operating income in fiscal 2012 was ¥2,710 million, an increase of<br />
¥271 million compared with ¥2,439 million in the previous fiscal year.<br />
Of this amount, interest <strong>and</strong> dividend income increased ¥587 million, or<br />
58.2%, to ¥1,598 million, compared with ¥1,010 million in the previous<br />
fiscal year, due largely to dividend income received from <strong>Yamaha</strong> Motor<br />
Co., Ltd. Other non-operating income decreased ¥316 million, or 22.1%,<br />
year on year, from ¥1,428 million to ¥1,112 million. This amount includes<br />
an expense of ¥438 million in compensation for the transfer of stores of<br />
the domestic musical instrument sales subsidiary.<br />
Non-operating expenses were down ¥1,067 million, or 23.0%, year<br />
on year, to ¥3,566 million, compared with ¥4,633 million in the previous<br />
fiscal year. Of this amount, interest expenses decreased ¥46 million, or<br />
13.3%, year on year, from ¥351 million to ¥304 million. Sales discounts<br />
given for early payment declined from ¥2,349 million to ¥2,153 million, a<br />
decrease of ¥195 million, or 8.3%, year on year.<br />
Other non-operating expenses were down from ¥1,932 million<br />
to ¥1,107 million, a decrease of ¥824 million, or 42.7%. Of these, foreign<br />
exchange losses decreased ¥545 million, or 45.1%, year on year, from<br />
¥1,207 million to ¥662 million.<br />
Extraordinary Income <strong>and</strong> Loss<br />
Extraordinary income in fiscal 2012 dropped ¥347 million, or 35.1%,<br />
year on year, from ¥988 million to ¥640 million. Of this amount, gain<br />
on sales of property, plant <strong>and</strong> equipment decreased ¥40 million, or<br />
17.6%, from ¥231 million to ¥190 million. Gain on liquidation of subsidiaries<br />
increased ¥427 million, from ¥21 million to ¥448 million.<br />
Extraordinary loss was down ¥4,231 million, or 82.1%, from ¥5,157<br />
million, to ¥925 million. Fiscal 2011’s extraordinary loss was due to the<br />
recording of a loss on impairment of fixed assets of ¥2,687 million <strong>and</strong><br />
a loss on valuation of investment securities of ¥1,563 million. Loss on<br />
retirement of property, plant <strong>and</strong> equipment amounted to ¥298 million,<br />
a decrease of ¥140 million, or 32.0%, compared with ¥438 million<br />
in fiscal 2011.<br />
Income before Income Taxes <strong>and</strong> Minority Interests<br />
Income before income taxes <strong>and</strong> minority interests in fiscal 2012 came<br />
to ¥6,971 million, an improvement of ¥168 million, or 2.5%, year on year,<br />
from ¥6,802 million in the previous fiscal year. The ratio of income before<br />
income taxes <strong>and</strong> minority interests to net sales increased from 1.8% to<br />
2.0%, a year-on-year improvement of 0.2 of a percentage point.<br />
Current Income Taxes <strong>and</strong> Deferred Income Taxes<br />
Current income taxes <strong>and</strong> deferred income taxes in fiscal 2012<br />
increased ¥34,717 million year on year, to ¥36,077 million, compared<br />
with ¥1,359 million in the previous fiscal year. This was primarily due to<br />
an increase in income taxes deferred following the reversal of deferred<br />
tax assets.<br />
Operating Income<br />
Operating Income <strong>Analysis</strong><br />
(Millions of yen)<br />
40,000<br />
11/3<br />
Impact of exchange rates<br />
(Billions of yen)<br />
13.2<br />
-2.7<br />
30,000<br />
Material cost increases<br />
Restructuring cost increases<br />
-0.6<br />
-1.7<br />
20,000<br />
Change in inventory valuation method<br />
Decrease in actual sales<br />
-0.9<br />
-4.2<br />
10,000<br />
8,110<br />
Retirement benefit obligations<br />
Effects of restructuring<br />
+0.6<br />
+0.5<br />
0<br />
08/3 09/3 10/3 11/3 12/3<br />
Decrease in actual SG&A expenses<br />
12/3<br />
+3.9<br />
8.1<br />
50 <strong>Yamaha</strong> Corporation
Management’s <strong>Discussion</strong> <strong>and</strong> <strong>Analysis</strong><br />
Minority Interests in Income<br />
In fiscal 2012, minority interests in income dropped ¥89 million, or<br />
24.7%, year on year, from ¥364 million to ¥274 million.<br />
Net Loss<br />
–¥29,381 million —<br />
As a result of the foregoing, the Company recorded a net loss in fiscal<br />
2012 of ¥29,381 million, a ¥34,460 million reversal from the net income<br />
of ¥5,078 million in the previous fiscal year. The net loss per share was<br />
¥151.73, compared with a net income per share of ¥25.90 in fiscal<br />
2011.<br />
Net Income (Loss) / ROE<br />
(Millions of yen) (%)<br />
40,000<br />
20,000<br />
0<br />
-20,000<br />
-40,000<br />
-13.2<br />
-29,381<br />
08/3 09/3 10/3 11/3 12/3<br />
■ Net income (loss)<br />
ROE<br />
Fluctuation in Foreign Exchange Rates <strong>and</strong> Risk Hedging<br />
<strong>Yamaha</strong> conducts business operations on a global scale with a focus<br />
on musical instruments. As such, the Company’s business structure is<br />
relatively vulnerable to the effects of fluctuations in foreign currency<br />
exchange rates. The Company’s consolidated financial statements are<br />
affected by foreign currency translation effects stemming from the<br />
risks associated with currency translations <strong>and</strong> transactions denominated<br />
in those currencies, including the U.S. dollar, the euro, the<br />
Canadian dollar, the Australian dollar, <strong>and</strong> the Chinese yuan. Of these<br />
risks, currency translation risks are only incurred when consolidated<br />
subsidiaries translate their financial statements for a specified period<br />
or on a specified date into Japanese yen. Transaction-related risks are<br />
incurred when earnings <strong>and</strong> expenses <strong>and</strong>/or assets <strong>and</strong> liabilities are<br />
denominated in different currencies. For this reason, only transaction<br />
related risks are subject to risk hedges. Specifically, U.S. dollar-related<br />
currency fluctuation risks are hedged by marrying risk associated<br />
with dollar receipts from export sales with risk associated with dollar<br />
payments for imported products. The Company hedges the value of<br />
risks associated with the euro <strong>and</strong> the Canadian <strong>and</strong> Australian dollars<br />
20<br />
10<br />
0<br />
-10<br />
-20<br />
by projecting related export revenues <strong>and</strong> purchasing relevant threemonth<br />
currency forwards.<br />
Sales at overseas consolidated subsidiaries are calculated using<br />
the average exchange rates recorded during the year. On this basis, in<br />
fiscal 2012, the yen appreciated ¥7 against the U.S. dollar compared<br />
with the previous year, to ¥79 per U.S.$1. The year-on-year effect of<br />
this change was a decrease of approximately ¥5,400 million in sales.<br />
The yen appreciated ¥4 against the euro year on year, for an average<br />
exchange rate of ¥109 to €1, resulting in a decrease of roughly ¥2,300<br />
million in sales. Overall, the net effect on sales of foreign exchange rate<br />
movements, including the downward effect of approximately ¥2,500<br />
million in fluctuations of the yen against such other currencies as the<br />
Canadian <strong>and</strong> Australian dollars, was a decline of around ¥10,300 million<br />
compared with fiscal 2011.<br />
In operating income, for the U.S. dollar, benefits from the<br />
aforementioned marriage of risks related to the currency enabled the<br />
Company to largely hedge the effects of currency exchange rates stemming<br />
from fluctuations in settlement rates. However, the translation of<br />
operating income figures by overseas subsidiaries caused income to<br />
decline by approximately ¥700 million. The average settlement rate<br />
against the euro was ¥112 to €1, an appreciation of ¥3, resulting in an<br />
approximately ¥1,200 million decline in operating income. Including<br />
the approximately ¥800 million currency translation effects of currencies<br />
other than the U.S. dollar <strong>and</strong> the euro against the yen, the net<br />
effect on operating income of exchange rate movements was a decline<br />
of roughly ¥2,700 million compared with the previous fiscal year.<br />
Dividends<br />
¥10.0<br />
In fiscal 2012, a regular dividend of ¥10 was paid, the same as in fiscal<br />
2011.<br />
Dividends per Share<br />
(Yen)<br />
50<br />
40<br />
30<br />
20<br />
10<br />
0<br />
10.0<br />
08/3 09/3 10/3 11/3 12/3<br />
■ Regular dividends<br />
■ Special dividends<br />
Annual Report 2012<br />
51
Review of Operations<br />
Musical Instruments<br />
Sales<br />
¥265,089 million<br />
-2.2%<br />
Operating Income<br />
¥7,713 million<br />
-10.5%<br />
Fiscal 2012 Performance Overview<br />
Sales in fiscal 2012 decreased ¥6,035 million, or 2.2%, year on year, to<br />
¥265,089 million. Excluding declines resulting from foreign currency<br />
effects (approximately ¥8,000 million), net sales increased in real terms<br />
by roughly ¥2,000 million, or 0.8%, year on year.<br />
Operating income was down ¥902 million, or 10.5%, year on<br />
year, from ¥8,616 million to ¥7,713 million.<br />
Review by Major Products<br />
Piano sales in Japan were largely in line with those of the previous<br />
fiscal year, due to the smaller-than-expected market impact of the<br />
earthquake disaster, <strong>and</strong> brisk sales of overseas-built upright pianos<br />
launched in Japan for the first time in fiscal 2011. In North America,<br />
sales of moderately-priced pianos were slow, but high value-added<br />
products such as gr<strong>and</strong> pianos were strong. In Europe, sales in the key<br />
market of Germany <strong>and</strong> in surrounding countries increased, resulting<br />
in overall growth for the market. Sales in China were up 20% on a local<br />
currency basis, while sales in other regions were also strong, growing<br />
in double digits.<br />
Digital musical instrument sales were down, especially in North<br />
America <strong>and</strong> Europe, as parts procurement problems caused by the<br />
earthquake disaster hindered our ability to supply products to markets.<br />
The disaster also affected the manufacture of key models. Still, <strong>Yamaha</strong><br />
was able to surmount this problem by changing specifications to<br />
accommodate replacement parts. As a result, sales of digital musical<br />
instruments as a whole were largely unchanged from the previous<br />
fiscal year on a local currency basis.<br />
Wind instrument sales were up in real terms in all markets<br />
excluding Europe. Sales of string <strong>and</strong> percussion instruments, especially<br />
electric acoustic guitars <strong>and</strong> guitar amplifiers, were up in China<br />
<strong>and</strong> other regions.<br />
Sales of professional audio equipment were on track to recovery<br />
from last year’s slump <strong>and</strong> exceeded fiscal 2011 sales on a local currency<br />
basis, though the adverse effects of budget cuts on facilities<br />
continues in some regions.<br />
In the music entertainment business, sales were down on lackluster<br />
performance in music distribution <strong>and</strong> publishing. Revenue from<br />
music <strong>and</strong> English language schools were largely unchanged from the<br />
previous fiscal year.<br />
Fiscal 2012 Sales by Product Category<br />
■ Pianos 15.2%<br />
■ Digital musical instruments 22.3%<br />
■ Wind instruments 11.4%<br />
■ String <strong>and</strong> percussion instruments 7.2%<br />
■ Professional audio equipment 10.9%<br />
■ Music schools, etc. 33.0%<br />
Sales<br />
(Millions of yen)<br />
400,000<br />
Operating Income<br />
(Millions of yen)<br />
30,000<br />
300,000<br />
200,000<br />
265,089<br />
20,000<br />
100,000<br />
10,000<br />
7,713<br />
0<br />
08/3 09/3 10/3 11/3 12/3<br />
0<br />
08/3 09/3 10/3 11/3 12/3<br />
52 <strong>Yamaha</strong> Corporation
Management’s <strong>Discussion</strong> <strong>and</strong> <strong>Analysis</strong><br />
Review by Region<br />
Percentage of Sales by Region Market Trends <strong>and</strong> Fiscal 2012 Performance Sales by Region (Billions of yen)<br />
Japan<br />
44.7%<br />
North America<br />
14.3%<br />
Europe<br />
17.1%<br />
China<br />
7.2%<br />
Asia, Oceania <strong>and</strong><br />
Other Areas<br />
16.7%<br />
✱ Dem<strong>and</strong> for musical instruments in Japan has been declining steadily. An example of this<br />
trend is the drastic reduction in the market for acoustic pianos over the past three decades.<br />
The high piano ownership rate <strong>and</strong> low birthrate are both responsible for this trend.<br />
✱ Due to the economic slowdown, on the whole, consumers continued to show both<br />
a reluctance to buy <strong>and</strong> a preference for lower-priced products. Relatively unaffected<br />
by the earthquake disaster, piano sales as a whole were largely unchanged thanks in<br />
part to brisk sales of offshore manufactured upright pianos launched in the second<br />
half. Digital musical instrument sales surpassed those of the previous fiscal year, despite<br />
the earthquake disaster’s lingering effects. Amid fears of lower consumption in the<br />
earthquake’s aftermath, wind instrument sales were up on the back of reconstruction<br />
dem<strong>and</strong> <strong>and</strong> other factors, but Electone <strong>and</strong> content business sales were down. As a<br />
result, domestic sales declined overall.<br />
✱ Guitars <strong>and</strong> drums account for one-third of the U.S. musical instrument market, making<br />
this a market clearly oriented toward hobbies <strong>and</strong> entertainment. The market<br />
rebounded modestly <strong>and</strong> sales, which were under adverse conditions through the third<br />
quarter, turned around in the fourth quarter <strong>and</strong> increased over the same period of the<br />
previous year.<br />
✱ Overall, piano sales declined year on year, but sales of gr<strong>and</strong> pianos <strong>and</strong> other products<br />
increased thanks to effective marketing efforts at music institutions. Wind instrument<br />
sales fared well on steady dem<strong>and</strong> for instrument rentals <strong>and</strong> professional audio<br />
equipment sales were firm in the second half following the release of new professional<br />
audio equipment. Nevertheless, digital musical instrument sales were down due to the<br />
earthquake disaster’s negative effect on product supply, resulting in a decrease in overall<br />
sales in North America.<br />
✱ In Europe, while each country has its own musical tastes <strong>and</strong> dem<strong>and</strong> trends vary from<br />
country to country, the musical instruments market grew increasingly uncertain as a<br />
whole due to the economic slowdown triggered by the debt crisis in southern Europe<br />
from the summer of 2011.<br />
✱ By country <strong>and</strong> region, dem<strong>and</strong> was strong in Germany <strong>and</strong> surrounding countries,<br />
but the United Kingdom <strong>and</strong> southern Europe continued to face difficulties. Despite<br />
the adverse market environment, unit sales of pianos in Germany <strong>and</strong> surrounding<br />
countries grew, as revenue increased in real terms year on year. However, digital musical<br />
instrument revenue declined year on year, reflecting the economic slowdown, product<br />
supply delays, <strong>and</strong> other factors. Sales also declined in Europe as a whole.<br />
✱ China’s musical instrument’s market is distinctive, with acoustic piano sales accounting<br />
for more than half of its market. Sales of digital musical instruments <strong>and</strong> wind, string <strong>and</strong><br />
percussion instruments also grew substantially, despite their still limited market size.<br />
✱ Sales of pianos, digital pianos <strong>and</strong> portable keyboards increased, with piano growth 20%<br />
in real terms. While the expansion of our sales network in second- <strong>and</strong> third-tier cities<br />
is going well, in large cities in coastal regions, we exp<strong>and</strong>ed our in-store displays for<br />
middle- to high-end products, <strong>and</strong> signed contracts with multiple distributors in those<br />
regions. These efforts have had a positive effect <strong>and</strong> sales have increased in China.<br />
(Billions of yen)<br />
✱ The musical instrument markets in key emerging countries continued to grow, with<br />
150<br />
double-digit growth of digital musical instruments, pianos, <strong>and</strong> guitars in Russia <strong>and</strong><br />
India, <strong>and</strong> steady growth in Indonesia, Thail<strong>and</strong>, <strong>and</strong> South America including Brazil.<br />
✱ Pianos, portable keyboards <strong>and</strong> string <strong>and</strong> percussion instruments, especially 100 guitars,<br />
also sustained high growth in double digits. Professional audio equipment also fared<br />
well, as sales increased in emerging markets overall.<br />
50<br />
(Billions of yen)<br />
150<br />
100<br />
50<br />
118.5<br />
0<br />
08/3 09/3 10/3 11/3 12/3<br />
■ <strong>Yamaha</strong> musical instruments hardware produc<br />
■ Music schools, etc.<br />
(Billions of yen)<br />
80<br />
60<br />
40<br />
20<br />
37.9<br />
0<br />
08/3 09/3 10/3 11/3 12/3<br />
■ <strong>Yamaha</strong> musical instruments<br />
(Billions ■ Music<br />
of yen)<br />
schools, etc.<br />
80<br />
60<br />
40<br />
20<br />
45.4<br />
0<br />
08/3 09/3 10/3 11/3 12/3<br />
■ <strong>Yamaha</strong> musical instruments<br />
(Billions ■ Music<br />
of yen)<br />
schools, etc.<br />
40<br />
30<br />
20<br />
10<br />
19.1<br />
0<br />
08/3 09/3 10/3 11/3 12/3<br />
■ <strong>Yamaha</strong> musical instruments<br />
(Billions ■ Music<br />
of yen)<br />
schools, etc.<br />
60<br />
45<br />
30<br />
15<br />
118.5<br />
44.2<br />
0<br />
08/3 09/3 10/3 11/3 12/3<br />
0<br />
■ <strong>Yamaha</strong> musical instruments<br />
08/3 09/3 10/3 11/3 12/3<br />
■ Music schools, etc.<br />
■ <strong>Yamaha</strong> musical instruments hardware products<br />
■ Music schools, etc.<br />
Annual Report 2012<br />
53
AV/IT<br />
Sales<br />
¥53,165 million<br />
-6.8%<br />
Operating Income<br />
¥2,872 million<br />
+12.7%<br />
Fiscal 2012 Performance Overview<br />
Sales in fiscal 2012 decreased ¥3,858 million, or 6.8%, to<br />
¥53,165 million. Excluding declines resulting from foreign<br />
currency translation effects (approximately ¥1,900 million),<br />
sales decreased in real terms by roughly ¥1,900<br />
million, or 3.5%, year on year.<br />
AV products sales were down in Japan due to<br />
lower flat panel TV sales, as well as in the key markets of<br />
North America. Although sales were up in other regions,<br />
they were down year on year overall. Strong initial sales<br />
of commercial online karaoke equipment, launched in<br />
the second half of fiscal 2011, have faded <strong>and</strong> sales have<br />
decreased on inventory adjustments following the earthquake<br />
disaster. Router sales increased on the back of large<br />
project orders from companies <strong>and</strong> public institutions.<br />
Operating income climbed ¥324 million, or 12.7%,<br />
from ¥2,547 million to ¥2,872 million, thanks to higher<br />
gross sales margins <strong>and</strong> lower SG&A expenses.<br />
Sales<br />
(Millions of yen)<br />
80,000<br />
60,000<br />
53,165<br />
40,000<br />
20,000<br />
0<br />
08/3 09/3 10/3 11/3 12/3<br />
Operating Income (Loss)<br />
(Millions of yen)<br />
3,000<br />
2,872<br />
2,000<br />
1,000<br />
0<br />
-1,000<br />
08/3 09/3 10/3 11/3 12/3<br />
Electronic Devices<br />
Sales<br />
¥16,233 million<br />
-21.2%<br />
Operating Loss<br />
–¥2,913 million<br />
—<br />
Fiscal 2012 Performance Overview<br />
Sales in fiscal 2012 decreased ¥4,377 million, or 21.2%,<br />
year on year, to ¥16,233 million. Sales of sound generator<br />
LSIs for mobile phones continued to lose ground <strong>and</strong> the<br />
accelerating shift to smart phones led to a major sales<br />
decline. Though improvement had been expected, sales<br />
of graphic controller LSIs used in amusement equipment<br />
were also down due to late recovery. Moreover, even<br />
though unit sales of geomagnetic sensors, which are<br />
increasingly in dem<strong>and</strong> for use in smart phones, have<br />
increased, revenue was down due to declining unit<br />
sales prices. As a result, sales for nearly every application<br />
declined.<br />
The electronic devices segment posted an operating<br />
loss of ¥2,913 million, a reversal of ¥3,424 million from<br />
the operating income of ¥510 million in the previous<br />
fiscal year.<br />
Sales<br />
(Millions of yen)<br />
60,000<br />
40,000<br />
20,000<br />
0<br />
■ Semiconductors<br />
■ Electronic metals<br />
16,233<br />
08/3 09/3 10/3 11/3 12/3<br />
Operating Income (Loss)<br />
(Millions of yen)<br />
4,000<br />
2,000<br />
0<br />
-2,000<br />
-2,913<br />
-4,000<br />
08/3 09/3 10/3 11/3 12/3<br />
54 <strong>Yamaha</strong> Corporation
Management’s <strong>Discussion</strong> <strong>and</strong> <strong>Analysis</strong><br />
Others<br />
Sales<br />
¥22,128 million<br />
-11.9%<br />
Operating Income<br />
¥437 million<br />
-70.6%<br />
Fiscal 2012 Performance Overview<br />
Sales in fiscal 2012 decreased ¥2,979 million, or 11.9%,<br />
year on year, to ¥22,128 million. As the dominant market<br />
players continued to assume greater market control, golf<br />
product sales in Japan were down year on year, despite<br />
the launching of new products. Sales in overseas markets<br />
decreased on lower sales in the key market of South<br />
Korea, currency translation effects, <strong>and</strong> other factors,<br />
leading to a decline in overall sales.<br />
Sales in the automobile interior wood components<br />
business were down due to automaker production cutbacks<br />
following the Great East Japan Earthquake. Despite<br />
brisk sales of printed circuit board-related devices from<br />
smart phone <strong>and</strong> tablet PC growth, sales in the factory<br />
automation (FA) business declined overall as manufacturers<br />
delayed their investment decisions about our leak<br />
tester. In the recreation business, sales were down due to<br />
the effects of the earthquake disaster in the first half.<br />
Operating income dropped ¥1,052 million, or<br />
70.6%, year on year, from ¥1,490 million to ¥437 million.<br />
Sales<br />
(Millions of yen)<br />
50,000<br />
40,000<br />
30,000<br />
20,000<br />
10,000<br />
■ Others*<br />
■ Recreation<br />
22,128<br />
0<br />
08/3 09/3 10/3 11/3 12/3<br />
* Following the h<strong>and</strong>over of a portion of the resort<br />
facilities, figures of the others segment from the<br />
year ended March 31, 2009 include that of the<br />
recreation segment. The magnesium molded parts<br />
business was terminated as of March 31, 2010.<br />
Operating Income (Loss)<br />
(Millions of yen)<br />
2,000<br />
1,000<br />
0<br />
-1,000<br />
-2,000<br />
437<br />
08/3 09/3 10/3 11/3 12/3<br />
Key Business Indicators<br />
Thous<strong>and</strong>s of<br />
Millions of yen U.S. dollars<br />
Years ended March 31 2008 2009 2010 2011 2012 2012<br />
Sales<br />
Musical instruments ¥340,021 ¥306,630 ¥276,252 ¥271,124 ¥265,089 $3,225,319<br />
AV/IT 70,814 56,722 54,409 57,023 53,165 646,855<br />
Electronic devices 45,000 21,975 19,745 20,610 16,233 197,506<br />
Others 47,397 30,833 27,461 25,108 22,128 269,230<br />
Operating income (loss)<br />
Musical instruments ¥ 27,924 ¥ 19,198 ¥ 5,117 ¥ 8,616 ¥ 7,713 $ 93,844<br />
AV/IT 1,839 (410) 1,405 2,547 2,872 34,943<br />
Electronic devices 1,863 (2,536) (606) 510 (2,913) (35,442)<br />
Others 628 (2,100) 546 1,490 437 5,317<br />
Capital expenditures<br />
Musical instruments ¥ 16,472 ¥ 14,793 ¥ 11,663 ¥ 8,008 ¥ 8,251 $ 100,389<br />
AV/IT 2,009 1,451 1,348 1,044 1,059 12,885<br />
Electronic devices 2,435 3,247 659 921 736 8,955<br />
Others 2,828 2,082 284 464 1,290 15,695<br />
Depreciation expenses<br />
Musical instruments ¥ 10,156 ¥ 10,042 ¥ 9,511 ¥ 9,678 ¥ 9,065 $ 110,293<br />
AV/IT 1,794 1,631 1,436 1,361 1,248 15,184<br />
Electronic devices 4,618 3,326 981 900 976 11,875<br />
Others 2,656 1,889 1,323 873 684 8,322<br />
R&D expenses<br />
Musical instruments ¥ 11,597 ¥ 10,780 ¥ 9,910 ¥ 11,557 ¥ 12,704 $ 154,569<br />
AV/IT 5,087 5,257 5,605 5,752 4,898 59,594<br />
Electronic devices 5,387 4,474 3,630 3,931 3,979 48,412<br />
Others 1,440 1,809 1,661 1,174 1,237 15,050<br />
For more detailed information, please refer to Financial Data 2012.<br />
Annual Report 2012<br />
55
<strong>Analysis</strong> of Financial Position<br />
Financing Policy<br />
The <strong>Yamaha</strong> Group obtains working capital to fund its business activities<br />
<strong>and</strong> finances its business expansion primarily from cash-on-h<strong>and</strong>,<br />
operating cash flows <strong>and</strong> bank loans.<br />
<strong>Yamaha</strong>’s basic financing policy is to procure stable, low-cost<br />
funding while preserving sufficient liquidity.<br />
The Company tries to ensure that liquidity on h<strong>and</strong> is equivalent<br />
to approximately one month of consolidated net sales, a figure covered<br />
by the ¥52,103 million in cash <strong>and</strong> deposits recorded as of March<br />
31, 2012.<br />
In principle, each subsidiary has been responsible for meeting<br />
its own requirements with respect to fund procurement. When necessary,<br />
however, <strong>Yamaha</strong> Corporation takes part in bank negotiations<br />
on a subsidiary’s behalf. Should surplus funds become available at<br />
subsidiaries in Japan, these funds are loaned to <strong>Yamaha</strong> Corporation<br />
in an effort to promote efficient fund utilization for the entire Group.<br />
Moreover, a cash management system has been adopted for certain<br />
subsidiaries. Beginning from the fiscal year ending March 31, 2013,<br />
efficient fund utilization is carried out for the entire Group.<br />
Furthermore, the Company commissions long-term preferred<br />
debt rating assessments from credit rating agencies each year to<br />
facilitate smooth fund procurement from capital markets. The latest<br />
published ratings are shown below.<br />
Ratings<br />
Rating agency<br />
Rating <strong>and</strong> Investment Information, Inc. (R&I)<br />
Japan Credit Rating Agency, Ltd. (JCR)<br />
* As of March 31, 2012<br />
Total Assets<br />
¥366,610 million -6.2%<br />
Long-term preferred<br />
debt rating<br />
A (stable)<br />
A+ (stable)<br />
Total assets as of March 31, 2012 amounted to ¥366,610 million, a<br />
decrease of ¥24,241 million, or 6.2%, from the previous fiscal yearend<br />
figure of ¥390,852 million. Of this amount, current assets totaled<br />
¥188,952 million, down ¥5,764 million, or 3.0%, from the previous yearend<br />
figure of ¥194,717 million. Property, plant <strong>and</strong> equipment came<br />
to ¥177,658 million, a decrease of ¥18,476 million, or 9.4%, from the<br />
previous fiscal year-end figure of ¥196,134 million.<br />
Cash <strong>and</strong> deposits decreased ¥5,107 million, or 8.9%, year on<br />
year, to ¥52,103 million. Notes <strong>and</strong> accounts receivable–trade (after<br />
deduction of allowance for doubtful accounts) declined by ¥620<br />
million, or 1.4%, to ¥44,468 million. Short-term investment securities<br />
jumped ¥2,739 million, or 139.8%, to ¥4,699 million, due mainly to the<br />
increase of negotiable certificates of deposit. Inventories increased<br />
¥5,486 million, or 7.7%, to ¥77,146 million. This figure includes a<br />
decrease of roughly ¥1,400 million due to currency translation effects.<br />
Excluding this factor, inventories increased by about ¥6,900 million,<br />
or 9.6%, in real terms. Musical instrument inventories in particular<br />
increased mainly due to higher digital musical instrument inventories<br />
caused by production delays after the Great East Japan Earthquake<br />
<strong>and</strong> the stockpiling of inventories for the beginning of the next fiscal<br />
period. Deferred tax assets declined by ¥6,537 million, or 77.9% from<br />
the previous fiscal year-end, to ¥1,855 million due to their reversal, <strong>and</strong><br />
other factors. Other current assets declined by ¥1,725 million, or 16.6%,<br />
to ¥8,678 million. The ratio of current assets to current liabilities at fiscal<br />
2012 year-end was 259%, compared with 260% from a year earlier,<br />
sustaining liquidity at a high level during fiscal 2012.<br />
Property, Plant <strong>and</strong> Equipment<br />
Property, plant <strong>and</strong> equipment as of March 31, 2012 were ¥106,858<br />
million, down ¥1,409 million, or 1.3%, year on year. Construction in<br />
progress came to ¥1,757 million, an increase of ¥868 million, due to<br />
molds needed to produce automobile interior wood components for<br />
new model cars.<br />
Investments <strong>and</strong> Other Assets<br />
Investments <strong>and</strong> other assets excluding intangible assets as of March<br />
31, 2012 amounted to ¥68,114 million, a year-on-year decrease of<br />
¥16,895 million, or 19.9%.<br />
Investment securities amounted to ¥61,690 million, down<br />
¥13,786 million, or 18.3%.This was mainly due to decreases in the value<br />
of <strong>Yamaha</strong> Motor Co., Ltd. stock <strong>and</strong> other listed stocks held. Deferred<br />
tax assets declined by ¥2,608 million, or 71.4%, to ¥1,045 million due to<br />
their reversal, <strong>and</strong> other factors.<br />
Intangible assets as of March 31, 2012 decreased by ¥172 million,<br />
or 6.0%, year on year, to ¥2,685 million.<br />
Total Assets / ROA<br />
(Millions of yen) (%)<br />
600,000<br />
400,000<br />
15<br />
366,610 10<br />
Current Assets<br />
Current assets as of March 31, 2012 totaled ¥188,952 million, down<br />
¥5,764 million, or 3.0%, from the end of the previous fiscal year. This was<br />
attributable to increases in inventories <strong>and</strong> short-term investment securities,<br />
which were outweighed by decreases in cash <strong>and</strong> deposits, notes<br />
<strong>and</strong> accounts receivable–trade, deferred tax assets, <strong>and</strong> other items.<br />
200,000<br />
0<br />
-200,000<br />
-400,000<br />
-7.8<br />
08/3 09/3 10/3 11/3 12/3<br />
5<br />
0<br />
-5<br />
-10<br />
■ Total assets<br />
ROA<br />
56 <strong>Yamaha</strong> Corporation
Management’s <strong>Discussion</strong> <strong>and</strong> <strong>Analysis</strong><br />
Total Liabilities<br />
¥159,778 million +9.6%<br />
Total liabilities as of March 31, 2012 came to ¥159,778 million, an increase<br />
of ¥13,928 million, or 9.6%, from the previous fiscal year-end figure of<br />
¥145,849 million. Current liabilities decreased by ¥2,006 million, or 2.7%,<br />
to ¥72,829 million from ¥74,836 million. Noncurrent liabilities increased<br />
by ¥15,934 million, or 22.4%, to ¥86,948 million from ¥71,013 million.<br />
Current Liabilities<br />
Current liabilities as of March 31, 2012 came to ¥72,829 million, a decrease<br />
of ¥2,006 million, or 2.7%, year on year. This was due to decreases in<br />
notes <strong>and</strong> accounts payable–trade <strong>and</strong> current portion of long-term<br />
loans payable, which outweighed increases in short-term loans payable,<br />
accounts payable–other <strong>and</strong> accrued expenses.<br />
Notes <strong>and</strong> accounts payable–trade were ¥22,263 million, a<br />
decrease of ¥1,935 million, or 8.0%, from the previous fiscal year-end<br />
figure. Short-term loans payable increased ¥3,285 million, or 49.8%,<br />
to ¥9,883 million, but the current portion of long-term loans payable<br />
decreased ¥2,951 million, or 76.4%, to ¥912 million. Accounts payable–<br />
other <strong>and</strong> accrued expenses amounted to ¥29,407 million, up by ¥750<br />
million, or 2.6%, year on year. Income taxes payable declined ¥372 million,<br />
or 16.2%, to ¥1,931 million.<br />
Noncurrent Liabilities<br />
Noncurrent liabilities as of March 31, 2012 increased by ¥15,934 million,<br />
or 22.4% year on year, to ¥86,948 million. This was due to decreases in<br />
long-term loans payable, deferred tax liabilities for l<strong>and</strong> revaluation,<br />
<strong>and</strong> long-term deposits received, which were outweighed by increases<br />
in deferred tax liabilities <strong>and</strong> provision for retirement benefits.<br />
Long-term loans payable amounted to ¥499 million, down ¥877<br />
million, or 63.7%. Deferred tax liabilities came to ¥15,348 million, an<br />
increase of ¥15,149 million. This was because deferred tax liabilities,<br />
which had been offset, increased along with the reversal of deferred<br />
tax assets, <strong>and</strong> other factors. Deferred tax liabilities for l<strong>and</strong> revaluation<br />
decreased by ¥1,891 million, to ¥12,595 million as a result of changes in<br />
income tax rates. Provision for retirement benefits rose ¥3,880 million,<br />
or 10.3%, to ¥41,479 million. Long-term deposits received decreased<br />
by ¥337 million, or 2.1%, to ¥15,516 million following the refund of<br />
deposits received from membership in the recreation business.<br />
Net Interest-Bearing Liabilities<br />
As of March 31, 2012, long- <strong>and</strong> short-term loans payable, which are<br />
interest-bearing liabilities, totaled ¥11,295 million. Cash <strong>and</strong> cash<br />
equivalents were ¥55,919 million, resulting in net cash <strong>and</strong> cash<br />
equivalents, less long- <strong>and</strong> short-term loans payable, of ¥44,623 million,<br />
a ¥1,983 million decrease compared with ¥46,607 million at the<br />
previous fiscal year-end.<br />
Net Assets<br />
¥206,832 million -15.6%<br />
Total net assets as of March 31, 2012 amounted to ¥206,832 million, a<br />
decrease of ¥38,170 million, or 15.6%, from the previous fiscal year-end<br />
figure of ¥245,002 million. This was the result of a decrease in retained<br />
earnings from the posting of a net loss, a decrease in the valuation<br />
difference on available-for-sale securities <strong>and</strong> changes in foreign<br />
currency translation adjustments. The loss recorded under foreign<br />
currency translation adjustments increased ¥2,028 million year on<br />
year. Retained earnings declined ¥31,741 million, or 18.7%, to ¥138,152<br />
million, reflecting a net loss of ¥29,381 million, dividend payments of<br />
¥1,936 million, <strong>and</strong> other factors. Valuation difference on available-forsale<br />
securities decreased ¥6,221 million, or ¥18.5%, to ¥27,337 million,<br />
reflecting a drop in the value of securities held, despite an increase<br />
from changes in income tax rates.<br />
Revaluation reserve for l<strong>and</strong> increased by ¥1,754 million, or<br />
11.3%, to ¥17,304 million, due mainly to changes in income tax rates.<br />
Minority interests increased by ¥181 million, or 6.2%, year on<br />
year, to ¥3,118 million.<br />
The equity ratio was 55.6% as of March 31, 2012, a 6.3 percentage<br />
point decrease, from 61.9% at the previous fiscal year-end. Return<br />
on equity (ROE) was -13.2%.<br />
Interest-Bearing Liabilities / Debt to Equity Ratio<br />
Net Assets / Equity Ratio<br />
(Millions of yen)<br />
(Times)<br />
(Millions of yen) (%)<br />
30,000<br />
0.10<br />
400,000<br />
80<br />
20,000<br />
300,000<br />
55.6 60<br />
10,000<br />
0.05<br />
0.05<br />
11,295<br />
■ Interest-bearing liabilities<br />
Debt to equity ratio<br />
200,000<br />
100,000<br />
206,832<br />
40<br />
20<br />
■ Net assets<br />
Equity ratio<br />
0 0<br />
08/3 09/3 10/3 11/3 12/3<br />
0<br />
0<br />
08/3 09/3 10/3 11/3 12/3<br />
Annual Report 2012<br />
57
Cash Flows<br />
Net cash provided by operating activities in fiscal 2012 was ¥10,880<br />
million, in contrast to net cash of ¥22,646 million provided in the previous<br />
fiscal year. This represented a ¥11,766 million decrease in cash<br />
provided.<br />
Net cash used in investing activities was ¥9,004 million, in<br />
contrast to net cash of ¥9,740 million used in the previous fiscal year.<br />
This represented a ¥735 million decrease in cash used, reflecting lower<br />
payments for purchases of property, plant <strong>and</strong> equipment.<br />
Net cash used in financing activities was ¥3,247 million, in contrast<br />
to net cash of ¥10,080 million used in the previous fiscal year. This<br />
represented a ¥6,833 million decrease in cash used, reflecting lower<br />
expenditures for share buybacks <strong>and</strong> dividend payments.<br />
As a result, with currency translation effects <strong>and</strong> other factors also<br />
taken into account, the fiscal 2012 year-end balance of cash <strong>and</strong> cash<br />
equivalents amounted to ¥55,919 million, representing a year-on-year<br />
decrease of ¥2,527 million.<br />
Free Cash Flow<br />
(Millions of yen)<br />
90,000<br />
60,000<br />
30,000<br />
0<br />
1,875<br />
-30,0000<br />
08/3 09/3 10/3 11/3 12/3<br />
Capital Expenditures/Depreciation <strong>and</strong> Amortization<br />
Capital expenditures in fiscal 2012 came to ¥11,337 million, an increase<br />
of ¥898 million, or 8.6%, from ¥10,439 million in the previous fiscal year.<br />
Capital expenditures in the musical instruments segment increased<br />
¥243 million, or 3.0%, year on year, from ¥8,008 million to ¥8,251 million.<br />
In the AV/IT segment, capital expenditures were up ¥15 million,<br />
or 1.4%, from ¥1,044 million to ¥1,059 million. In the electronic devices<br />
segment, capital expenditures were down ¥185 million, or ¥20.2%,<br />
year on year, from ¥921 million to ¥736 million. Capital expenditures<br />
increased significantly in the others segment, jumping ¥825 million, or<br />
177.6%, from ¥464 million to ¥1,290 million.<br />
Depreciation <strong>and</strong> amortization amounted to ¥11,973 million, a<br />
decrease of ¥840 million, or 6.6%, from ¥12,814 million in fiscal 2011.<br />
R&D Expenses<br />
R&D expenses in fiscal 2012 increased by ¥402 million, or 1.8%, from<br />
¥22,416 million to ¥22,819 million. The ratio of R&D expenses to net<br />
sales was 0.4 of a percentage point higher than in fiscal 2011, rising<br />
from 6.0%, to 6.4%.<br />
Most of this spending was directed at product development<br />
primarily in digital musical instruments, <strong>and</strong> in the AV/IT <strong>and</strong> semiconductor<br />
businesses. Specifically, the spending supported elemental<br />
technology research <strong>and</strong> product development for hybrid pianos that<br />
blend acoustic <strong>and</strong> digital technologies, various developments to<br />
make digital musical instruments more competitive, development of<br />
new professional audio equipment for the commercial audio equipment<br />
market leveraging digital network technology, development of<br />
products to exp<strong>and</strong> the AV products category, <strong>and</strong> new product development<br />
for commercial online karaoke equipment, routers, <strong>and</strong> other<br />
products. In semiconductors, spending was used for development of<br />
high value-added analog <strong>and</strong> hybrid semiconductors <strong>and</strong> development<br />
of new products for mobile phones, amusement equipment <strong>and</strong><br />
geomagnetic sensors for smartphones.<br />
R&D budgets also funded programs to research <strong>and</strong> develop<br />
basic sound- <strong>and</strong> music-related technologies (sound sources, voice<br />
synthesis, architectural acoustics, etc.), <strong>and</strong> new devices such as speakers<br />
<strong>and</strong> sensors, <strong>and</strong> to research interfaces <strong>and</strong> research <strong>and</strong> develop<br />
acoustic materials.<br />
Capital Expenditures / Depreciation <strong>and</strong> Amortization<br />
(Millions of yen)<br />
30,000<br />
R&D Expenses<br />
(Millions of yen)<br />
30,000<br />
22,819<br />
20,000<br />
20,000<br />
10,000<br />
11,337 11,973<br />
■ Capital expenditures<br />
■ Depreciation <strong>and</strong><br />
amortization<br />
10,000<br />
0<br />
08/3 09/3 10/3 11/3 12/3<br />
0<br />
08/3 09/3 10/3 11/3 12/3<br />
58 <strong>Yamaha</strong> Corporation
Management’s <strong>Discussion</strong> <strong>and</strong> <strong>Analysis</strong><br />
Forecast for Fiscal 2013<br />
Performance Forecast<br />
Net Sales<br />
¥378,000 million +6.0%<br />
Operating Income<br />
¥14,500 million +78.8%<br />
Net Income<br />
¥9,000 million —<br />
In fiscal 2013, with the looming uncertainty of a financial crisis in<br />
Europe, a smooth recovery is not expected, despite an anticipated<br />
economic rebound in North America. Despite a slowdown in China’s<br />
growth rate, high growth is expected to continue, <strong>and</strong> emerging<br />
markets should remain strong. Nevertheless, while the yen’s recordhigh<br />
appreciation is showing signs of settling down, it is expected to<br />
remain strong against other currencies. Further, in fiscal 2013, we will<br />
likely be recovering from the effects of natural disasters that struck in<br />
fiscal 2012, such as the parts procurement problems triggered by the<br />
Great East Japan Earthquake, as well as the flooding in Thail<strong>and</strong>.<br />
By business segment, in the musical instruments segment, we<br />
will aggressively exp<strong>and</strong> sales in emerging markets including China by<br />
upgrading our sales network <strong>and</strong> thereby accelerate growth. In developed<br />
markets, particularly North America, <strong>Yamaha</strong> intends to increase<br />
sales on the back of a gradual market recovery, new product launches,<br />
<strong>and</strong> other means. As a result, we expect year-on-year increases in both<br />
sales <strong>and</strong> earnings in the musical instruments segment.<br />
In the AV/IT segment, our goal is to achieve growth by releasing<br />
new AV products that meet market dem<strong>and</strong> trends. In the commercial<br />
online karaoke equipment business, although shipment volumes<br />
declined due to the earthquake disaster, we will make every effort to<br />
increase product supply over the previous fiscal year. In the router<br />
market, we will increase sales by highlighting our product’s advantages<br />
<strong>and</strong> exp<strong>and</strong>ing into overseas markets.<br />
In the electronic devices segment, we expect higher revenue<br />
from sales growth in graphics controller LSIs by steadily recapturing<br />
dem<strong>and</strong> for amusement equipment <strong>and</strong> offering a more extensive<br />
product lineup of geomagnetic sensors.<br />
In the others segment, we will take steps to regain our share<br />
of the domestic golf products market, especially of new products<br />
launched last autumn. We will also open up markets for golf products<br />
in emerging markets including China, where growth is expected. In the<br />
automobile interior wood component business, we will raise manufacturing<br />
capabilities by reducing lead time <strong>and</strong> increase sales over<br />
those of the previous fiscal year, which were affected by automaker<br />
production cutbacks in the aftermath of the earthquake disaster. In<br />
the FA equipment business, we will further strengthen our marketing<br />
capabilities. In the recreation business, we will build a stronger sales<br />
force <strong>and</strong> gain the benefits of greater operational efficiency through<br />
the integration of operating companies, which was completed in fiscal<br />
2012. In the others segment, sales are expected to increase overall.<br />
Exchange rate assumptions for full fiscal 2013 are: JP¥75 per<br />
US$1, JP¥105 per €1, JP¥75 per AU$1, JP¥75 per CA$1, <strong>and</strong> US$6.10 per<br />
CN¥1. In fiscal 2013 as previously stated, we forecast increases in both<br />
sales <strong>and</strong> earnings over fiscal 2012.<br />
Capital Expenditures Forecast<br />
In fiscal 2013, capital expenditures are expected to rise. Major planned<br />
items include regular investment in molds for production of new<br />
products, investment for facility upgrade <strong>and</strong> refurbishment, investment<br />
related to sales <strong>and</strong> marketing, R&D investment, <strong>and</strong> plant<br />
rationalization-related expenses. We also anticipate higher depreciation<br />
<strong>and</strong> amortization expenses.<br />
Profit Distribution Policy (Dividend Forecast)<br />
With the aim of boosting consolidated return on equity (ROE),<br />
<strong>Yamaha</strong>’s basic policy is to distribute profits in line with consolidated<br />
performance, while also setting aside an appropriate amount of<br />
retained earnings to strengthen the Company’s business foundation<br />
through investments in R&D, sales <strong>and</strong> capital expenditures to drive<br />
corporate growth, based on prospective levels of medium-term consolidated<br />
earnings. Specifically, <strong>Yamaha</strong> has set a goal of 40% for its<br />
consolidated dividend payout ratio based on continuous <strong>and</strong> stable<br />
dividend payments. Under this policy, <strong>Yamaha</strong> plans to pay a total<br />
dividend of ¥10 per share for fiscal 2013, including an interim dividend<br />
payment of ¥5 per share.<br />
Annual Report 2012<br />
59


