DEATH PENALTY INFORMATION CENTER
DEATH PENALTY INFORMATION CENTER
DEATH PENALTY INFORMATION CENTER

You also want an ePaper? Increase the reach of your titles
YUMPU automatically turns print PDFs into web optimized ePapers that Google loves.
Recent Studies on Race<br />
• In 96% of the states where there have been reviews of race<br />
and the death penalty, there was a pattern of either race-ofvictim<br />
or race-of-defendant discrimination, or both. (Prof.<br />
David Baldus report to the ABA, 1998).<br />
• 98% of the chief district attorneys in death penalty states<br />
are white; only 1% are black. (Prof. Jeffrey Pokorak,<br />
Cornell Law Review, 1998).<br />
• A comprehensive study of the death penalty in North Carolina found that the odds of receiving a death sentence rose by 3.5 times<br />
among those defendants whose victims were white. (Prof. Jack Boger and Dr. Isaac Unah, University of North Carolina, 2001).<br />
• A study in California found that those who killed whites were over 3 times more likely to be sentenced to death than those who<br />
killed blacks and over 4 times more likely than those who killed Latinos. (Pierce & Radelet, Santa Clara Law Review 2005).<br />
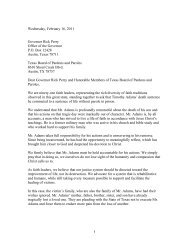
Innocence<br />
White Def./<br />
Black Victim<br />
Black Def./<br />
White Victim<br />
Persons Executed for Interracial Murders<br />
15<br />
244<br />
Number Released Since 1973<br />
12%<br />
25<br />
20<br />
15<br />
10<br />
5<br />
0<br />
23<br />
20<br />
42%<br />
11 10<br />
8 8<br />
7<br />
6 6 5 5 4 3 3 3 3 2 2 2 1 1 1 1 1 1 1<br />
WA<br />
VA<br />
NV<br />
NE<br />
MD<br />
KY<br />
IN<br />
ID<br />
TN<br />
SC<br />
MS<br />
MO<br />
MA<br />
OH<br />
NM<br />
CA<br />
GA<br />
AL<br />
PA<br />
NC<br />
LA<br />
AZ<br />
TX<br />
OK<br />
FL<br />
IL<br />
States Where Inmates Have Been Released<br />
Race of Death Row Inmates<br />
44%<br />
Death Row Exonerations by State<br />
Total: 138<br />
2%<br />
Black - 42%<br />
Hispanic - 12%<br />
White - 44%<br />
Other - 2%<br />
2 I<br />
Since 1973, over 130 people have<br />
been released from death row with<br />
evidence of their innocence. (Staff<br />
Report, House Judiciary<br />
Subcommittee on Civil &<br />
Constitutional Rights, Oct. 1993, with<br />
updates from DPIC).<br />
From 1973-1999, there was an<br />
average of 3.1 exonerations per<br />
year. From 2000-2007, there has<br />
been an average of 5 exonerations<br />
per year.<br />
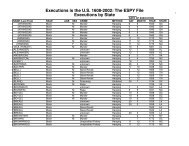
<strong>DEATH</strong> ROW INMATES BY STATE: October 1, 2009<br />
California 694 S. Carolina 63 Connecticut 10<br />
Florida 395 Mississippi 59 Kansas 10<br />
Texas 339 U.S. Gov’t 58 Utah 10<br />
Pennsylvania 223 Missouri 52 Washington 9<br />
Alabama 201 Arkansas 42 U.S. Military 8<br />
Ohio 170 Kentucky 36 Maryland 5<br />
N. Carolina 169 Oregon 33 S. Dakota 3<br />
Arizona 132 Delaware 19 Colorado 3<br />
Georgia 108 Idaho 18 Montana 2<br />
Tennessee 90 Indiana 16 New Mexico 2<br />
Oklahoma 85 Virginia 16 Wyoming 1<br />
Louisiana 84 Illinois 15 N. Hampshire 1<br />
Nevada 78 Nebraska 11 TOTAL 3263<br />
Race of Death Row Inmates and Death Row Inmates by State Source: NAACP LDF “Death Row, U.S.A.” (October 1, 2009)<br />
When added, the total number of death row inmates by state is slightly higher because some prisoners are sentenced to death in more than one state.