Methods of Indirect Measurement Common angle method using ...
Methods of Indirect Measurement Common angle method using ...
Methods of Indirect Measurement Common angle method using ...

Create successful ePaper yourself
Turn your PDF publications into a flip-book with our unique Google optimized e-Paper software.
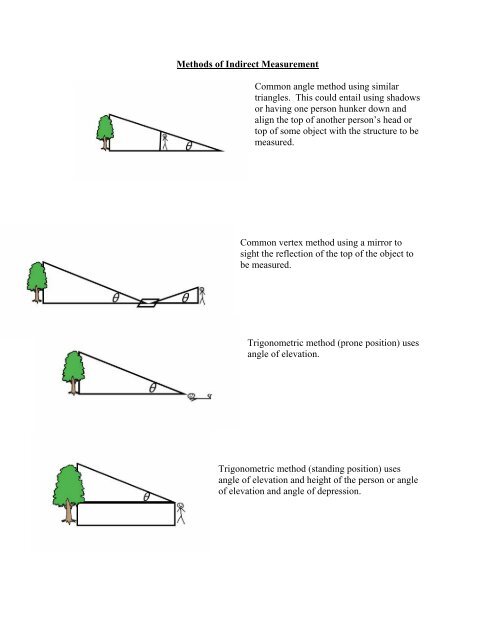
<strong>Methods</strong> <strong>of</strong> <strong>Indirect</strong> <strong>Measurement</strong><br />
<strong>Common</strong> <strong>angle</strong> <strong>method</strong> <strong>using</strong> similar<br />
tri<strong>angle</strong>s. This could entail <strong>using</strong> shadows<br />
or having one person hunker down and<br />
align the top <strong>of</strong> another person’s head or<br />
top <strong>of</strong> some object with the structure to be<br />
measured.<br />
<strong>Common</strong> vertex <strong>method</strong> <strong>using</strong> a mirror to<br />
sight the reflection <strong>of</strong> the top <strong>of</strong> the object to<br />
be measured.<br />
Trigonometric <strong>method</strong> (prone position) uses<br />
<strong>angle</strong> <strong>of</strong> elevation.<br />
Trigonometric <strong>method</strong> (standing position) uses<br />
<strong>angle</strong> <strong>of</strong> elevation and height <strong>of</strong> the person or <strong>angle</strong><br />
<strong>of</strong> elevation and <strong>angle</strong> <strong>of</strong> depression.
Randomly Selecting a Portion <strong>of</strong> the Park<br />
Fold your map <strong>of</strong> the park in half, flip a coin, and then if your coin is heads, use the top<br />
half <strong>of</strong> the map, if tails, use the bottom half <strong>of</strong> the map. Fold your half <strong>of</strong> the map in half<br />
again so that there is a left half and a right half. Flip a coin again and then, if heads, use<br />
the left side <strong>of</strong> the map and if tails, use the right side. You have now chosen a particular<br />
fourth <strong>of</strong> the park map. Fold your fourth in half so that you have two eighths <strong>of</strong> the map<br />
from which to choose. Flip a coin again, and then if your coin is heads, use the top eighth<br />
<strong>of</strong> your portion <strong>of</strong> the map, if tails, use the bottom eight <strong>of</strong> that portion <strong>of</strong> the map. Mark<br />
on your map that portion <strong>of</strong> the park you have thus selected.
How tall is Colossus?<br />
MO CLEs<br />
D3AInt3<br />
D2AAlg1<br />
D2AAlg2<br />
G1AAlg2<br />
G1AInt2<br />
Use 3 <strong>method</strong>s <strong>of</strong> indirect measurement to determine the height <strong>of</strong> Colossus. Indicate<br />
clearly where you took your measurements. Provide enough details so that I could<br />
stand/sit/lie down in the same place.<br />
Find the mean and median for your 3 measurements.<br />
Find the standard deviation for your 3 measurements.<br />
Construct a 95% confidence interval for the mean height <strong>of</strong> measurements <strong>of</strong> Colossus.
How tall is Colossus?<br />
MO CLEs<br />
G1AAlg2<br />
G1AInt2<br />
Use 3 <strong>method</strong>s <strong>of</strong> indirect measurement to determine the height <strong>of</strong> Colossus. Use each<br />
<strong>method</strong> once. Indicate the location where you use each <strong>method</strong>.<br />
Locations to use:<br />
near the light pole that is next to the women’s restroom located across from Shazam!,<br />
at the entrance to Scooby-Doo: Mystery <strong>of</strong> the Scary Swamp,<br />
at the bottom left corner <strong>of</strong> the D in DC plaza,<br />
at the corner <strong>of</strong> the fence at the northwest corner <strong>of</strong> The Palace near Colossal Closeouts.
How tall is Superman Tower <strong>of</strong> Power?<br />
MO CLEs<br />
G1AAlg2<br />
G1AInt2<br />
D3AInt3<br />
D2AAlg1<br />
D2AAlg2<br />
Use 3 <strong>method</strong>s <strong>of</strong> indirect measurement to determine the height <strong>of</strong> Superman Tower <strong>of</strong><br />
Power. Indicate clearly where you took your measurements. Provide enough details so<br />
that I could stand/sit/lie down in the same place.<br />
Find the mean and median for your 3 measurements.<br />
Find the standard deviation for your 3 measurements.<br />
Construct a 95% confidence interval for the mean height <strong>of</strong> measurements <strong>of</strong> Superman<br />
Tower <strong>of</strong> Power.
How tall is the top <strong>of</strong> the tower on Mr. Freeze?<br />
MO CLEs<br />
G1AAlg2<br />
G1AInt2<br />
D3AInt3<br />
D2AAlg1<br />
D2AAlg2<br />
Use 3 <strong>method</strong>s <strong>of</strong> indirect measurement to determine the height <strong>of</strong> the tower on Mr.<br />
Freeze. Indicate clearly where you took your measurements. Provide enough details so<br />
that I could stand/sit/lie down in the same place.<br />
Find the mean and median for your 3 measurements.<br />
Find the standard deviation for your 3 measurements.<br />
Construct a 95% confidence interval for the mean height <strong>of</strong> measurements <strong>of</strong> the tower<br />
on Mr. Freeze.
How tall is the peak <strong>of</strong> the ro<strong>of</strong> on The Palace Theater?<br />
MO CLEs<br />
G1AAlg2<br />
G1AInt2<br />
D3AInt3<br />
D2AAlg1<br />
D2AAlg2<br />
Use 3 <strong>method</strong>s <strong>of</strong> indirect measurement to determine the height <strong>of</strong> the peak <strong>of</strong> the ro<strong>of</strong> <strong>of</strong><br />
The Palace Theater. Indicate clearly where you took your measurements. Provide<br />
enough details so that I could stand/sit/lie down in the same place.<br />
Find the mean and median for your 3 measurements.<br />
Find the standard deviation for your 3 measurements.<br />
Construct a 95% confidence interval for the mean height <strong>of</strong> measurements <strong>of</strong> the height<br />
<strong>of</strong> the peak <strong>of</strong> the ro<strong>of</strong> on The Palace Theater.
How tall is peak <strong>of</strong> the ro<strong>of</strong> on The Palace Theater?<br />
MO CLEs<br />
G1AAlg2<br />
G1AInt2<br />
D1CAlg1<br />
D1CAlg2<br />
D1CGeom<br />
Use one or more <strong>method</strong>s <strong>of</strong> indirect measurement to determine the height <strong>of</strong> the peak <strong>of</strong><br />
the ro<strong>of</strong> <strong>of</strong> The Palace Theater. Indicate clearly where you took your measurements.<br />
Provide enough details so that I could stand/sit/lie down in the same places. Take<br />
measurements from 30 locations in all. Include the information needed to calculate the<br />
height in the space provided.<br />
Make an appropriate graph <strong>of</strong> your calculated heights and describe the distribution <strong>of</strong><br />
these heights.<br />
Is there evidence that this distribution does or does not follow any particular model?<br />
Find the mean and median for your 30 measurements.<br />
Find the standard deviation for your 30 measurements.<br />
Construct a 95% confidence interval for the mean height <strong>of</strong> measurements <strong>of</strong> the height<br />
<strong>of</strong> the peak <strong>of</strong> the ro<strong>of</strong> on The Palace Theater.
How high is the top <strong>of</strong> the counterweight on Xcalibur?<br />
MO CLEs<br />
G1AAlg2<br />
G1AInt2<br />
D3AInt3<br />
D2AAlg1<br />
D2AAlg2<br />
Use 3 <strong>method</strong>s <strong>of</strong> indirect measurement to determine the height to the top <strong>of</strong> the<br />
counterweight on Xcalibur. Indicate clearly where you took your measurements.<br />
Provide enough details so that I could stand/sit/lie down in the same place.<br />
Find the mean and median for your 3 measurements.<br />
Find the standard deviation for your 3 measurements.<br />
Construct a 95% confidence interval for the mean height <strong>of</strong> measurements <strong>of</strong> the<br />
counterweight on Xcalibur.
How high is the top <strong>of</strong> the counterweight on the Rush Street Flyer?<br />
MO CLEs<br />
G1AAlg2<br />
G1AInt2<br />
D3AInt3<br />
D2AAlg1<br />
D2AAlg2<br />
Use 3 <strong>method</strong>s <strong>of</strong> indirect measurement to determine the height to the top <strong>of</strong> the<br />
counterweight on the Rush Street Flyer. Indicate clearly where you took your<br />
measurements. Provide enough details so that I could stand/sit/lie down in the same<br />
place.<br />
Find the mean and median for your 3 measurements.<br />
Find the standard deviation for your 3 measurements.<br />
Construct a 95% confidence interval for the mean height <strong>of</strong> measurements <strong>of</strong> the<br />
counterweight on the Rush Street Flyer.
How high is the top <strong>of</strong> the counterweight on Xcalibur?<br />
MO CLEs<br />
G1AAlg2<br />
G1AInt2<br />
D3AInt3<br />
D2AAlg1<br />
D2AAlg2<br />
Use 3 <strong>method</strong>s <strong>of</strong> indirect measurement to determine the height to the top <strong>of</strong> the<br />
counterweight on Xcalibur. Indicate clearly where you took your measurements.<br />
Provide enough details so that I could stand/sit/lie down in the same places. Take<br />
measurements from 30 locations in all. Include the information needed to calculate the<br />
height in the space provided.<br />
Make an appropriate graph <strong>of</strong> your calculated heights and describe the distribution <strong>of</strong><br />
these heights.<br />
Is there evidence that this distribution does or does not follow any particular model?<br />
Find the mean and median for your 30 measurements.<br />
Find the standard deviation for your 30 measurements.<br />
Construct a 95% confidence interval for the mean height <strong>of</strong> measurements <strong>of</strong> the height<br />
<strong>of</strong> the counterweight on Xcalibur.
How high is the top <strong>of</strong> the counterweight on the Rush Street Flyer?<br />
MO CLEs<br />
G1AAlg2<br />
G1AInt2<br />
D3AInt3<br />
D2AAlg1<br />
D2AAlg2<br />
Use 3 <strong>method</strong>s <strong>of</strong> indirect measurement to determine the height to the top <strong>of</strong> the<br />
counterweight on the Rush Street Flyer. Indicate clearly where you took your<br />
measurements. Provide enough details so that I could stand/sit/lie down in the same<br />
places. Take measurements from 30 locations in all. Include the information needed to<br />
calculate the height in the space provided.<br />
Make an appropriate graph <strong>of</strong> your calculated heights and describe the distribution <strong>of</strong><br />
these heights.<br />
Is there evidence that this distribution does or does not follow any particular model?<br />
Find the mean and median for your 30 measurements.<br />
Find the standard deviation for your 30 measurements.<br />
Construct a 95% confidence interval for the mean height <strong>of</strong> measurements <strong>of</strong> the height<br />
<strong>of</strong> the counterweight on the Rush Street Flyer.
Colossus in detail<br />
MO CLEs<br />
M2BGeom<br />
A1BAlg1<br />
A1BGeom<br />
A1BInt2<br />
A1BAlg2<br />
A1BInt3<br />
A2AInt2<br />
A2AInt3<br />
A3AInt3<br />
How many degrees are there per gondola on Colossus?<br />
Examine the support structures that make up the spokes on the wheel <strong>of</strong> Colossus. How<br />
many segments make up one <strong>of</strong> these spokes?<br />
Write a recursive definition for the number <strong>of</strong> segments added during construction, as the<br />
number <strong>of</strong> spokes increased—that is, write a recursive definition that relates the number<br />
<strong>of</strong> spokes to the number <strong>of</strong> segments used.<br />
Write a closed form definition that relates the number <strong>of</strong> spokes to the number <strong>of</strong><br />
segments used.
Details<br />
MO CLEs<br />
A1BAlg1<br />
A1BGeom<br />
A1BInt2<br />
A1BAlg2<br />
A1BInt3<br />
A2AInt2<br />
A2AInt3<br />
A3AInt3<br />
Bring in a photo <strong>of</strong> some support structures or some decorative work that you find around<br />
the park. Attach the photo to this page. If you are not able to bring in a photo, then<br />
sketch the structure or decoration and attach the sketch to this page.<br />
Write a recursive definition for the number <strong>of</strong> segments, bars, dots, bolts, or other<br />
elements added, as the number <strong>of</strong> repeated pieces increases—that is, write a recursive<br />
definition that relates the number <strong>of</strong> supporting or decorative sections to the number <strong>of</strong><br />
segments, bars, dots, bolts, or other elements used.<br />
Write a closed form definition that relates the number <strong>of</strong> supporting or decorative<br />
sections to the number <strong>of</strong> segments, bars, dots, bolts, or other elements used.
Circuits and Paths<br />
MO CLEs<br />
G4AGeom<br />
Make a vertex-edge graph <strong>of</strong> the 8 roller coasters in the park and the pathways<br />
connecting them.<br />
Identify the degree <strong>of</strong> each roller coaster (vertex).<br />
Is there a path that includes every roller coaster?<br />
Is there a simple path that includes every roller coaster?<br />
Is there a circuit that includes every roller coaster?<br />
Is there a Hamiltonian circuit that includes every roller coaster?<br />
Is there an Euler circuit that includes every roller coaster?<br />
Find a minimal spanning tree for the graph <strong>of</strong> all roller coasters.<br />
Make a vertex-edge graph <strong>of</strong> the 3 wooden coasters (Screaming Eagle, The Boss,<br />
American Thunder).<br />
Walk each path in this graph and use the times to give a total weight to the graph.<br />
Find a solution to the traveling salesman problem for the graph <strong>of</strong> the 3 wooden coasters.<br />
Make a vertex-edge graph <strong>of</strong> the 5 steel coasters (Ninja, Batman The Ride, River King<br />
Mine Train, Pandemonium, Mr. Freeze).<br />
Make the above graph a directed graph to show dominance based on some aspect <strong>of</strong> the<br />
rides <strong>of</strong> your choice, such as height, speed, or length.<br />
Walk each path in this graph and use the times to give a total weight to the graph.<br />
Find a solution to the traveling salesman problem for the graph <strong>of</strong> the 5 steel coasters.
Work<br />
MO CLEs<br />
N2DAlg1<br />
N2DGeom<br />
N2DInt2<br />
N2DAlg2<br />
N2DInt3<br />
Work is defined as a force times a distance. For English units, we have force measured<br />
in pounds and distance measured in feet, so what would the units be?<br />
Suppose you win a stuffed animal at the park and it weighs 5 pounds. If you carry it from<br />
the entrance to the Screaming Eagle to the entrance to Batman The Ride, how much work<br />
is done carrying it?
The Slingshot<br />
MO CLEs<br />
N2DAlg1<br />
N2DGeom<br />
N2DInt2<br />
N2DAlg2<br />
N2DInt3<br />
N3EAlg1<br />
N3EGeom<br />
N3EInt2<br />
N3EAlg2<br />
N3EInt3<br />
The Slingshot uses springs and pulleys to launch a rider or two up to 22 stories in the air.<br />
We’re going to simplify the situation by ignoring the effect <strong>of</strong> the pulleys. A story could<br />
measure anywhere from 8 to 14 feet. In a launch <strong>of</strong> a 150 pound person, about how much<br />
work is done? Include units.<br />
Determine the number <strong>of</strong> springs used on The Slingshot.<br />
Determine how much work is done on each spring.<br />
If each spring is stretched by this work from 46 inches to *** inches, what is the spring<br />
constant, according to Hooke’s Law?
Concession Duty<br />
MO CLEs<br />
A3AAlg1<br />
A3AGeom<br />
A3AInt2<br />
A3AAlg2<br />
A3AInt3<br />
A4AAlg1<br />
A4AGeom<br />
A4AInt2<br />
A4AAlg2<br />
A4AInt3<br />
In ***, Friar Tuck’s Turkey Legs were sold for $*** and *** turkey legs were sold that<br />
season. In ***, the turkey legs were sold for $*** each and visitors bought *** legs that<br />
year.<br />
Write a function that relates the price per turkey leg to the number that are sold.<br />
This year, Friar Tuck’s is selling turkey legs for $__________ each.<br />
Use your function to estimate the number <strong>of</strong> turkey legs that will be sold this year.<br />
How much revenue was brought in on turkey legs in ***?<br />
How much revenue was brought in on turkey legs in ***?<br />
How much revenue do you expect to be brought in on turkey legs this year?
Sampling<br />
MO CLEs<br />
D1AInt3<br />
Fold your map <strong>of</strong> the park in half, flip a coin, and then if your coin is heads, use the top<br />
half <strong>of</strong> the map, if tails, use the bottom half <strong>of</strong> the map. Fold your half <strong>of</strong> the map in half<br />
again so that there is a left half and a right half. Flip a coin again and then, if heads, use<br />
the left side <strong>of</strong> the map and if tails, use the right side. You have now chosen a particular<br />
fourth <strong>of</strong> the park map. Fold your fourth in half so that you have two eighths <strong>of</strong> the map<br />
from which to choose. Flip a coin again, and then if your coin is heads, use the top eighth<br />
<strong>of</strong> your portion <strong>of</strong> the map, if tails, use the bottom eight <strong>of</strong> that portion <strong>of</strong> the map. Mark<br />
on your map that portion <strong>of</strong> the park you have thus selected.<br />
Conduct an inspection <strong>of</strong> this region and count the number <strong>of</strong> trash cans.<br />
Use this information to make an estimate for the number <strong>of</strong> trash cans in the entire park.<br />
Show your work and explain how you arrived at your answer.<br />
Identify any potential sources <strong>of</strong> bias or error in your <strong>method</strong>.<br />
Conduct an inspection <strong>of</strong> this region and count the number <strong>of</strong> light bulbs.<br />
Use this information to make an estimate for the number <strong>of</strong> light bulbs in the entire park.<br />
Show your work and explain how you arrived at your answer.<br />
Identify any potential sources <strong>of</strong> bias or error in your <strong>method</strong>.<br />
Conduct an inspection <strong>of</strong> this region and count the number <strong>of</strong> different plant species.<br />
Use this information to make an estimate for the number <strong>of</strong> plant species in the entire<br />
park. Show your work and explain how you arrived at your answer.<br />
Identify any potential sources <strong>of</strong> bias or error in your <strong>method</strong>.
Spinning Rides<br />
MO CLEs<br />
N2DAlg1<br />
N2DGeom<br />
N2DInt2<br />
N2DAlg2<br />
N2DInt3<br />
N3DAlg1<br />
N3DGeom<br />
N3DInt2<br />
N3DAlg2<br />
N3DInt3<br />
N1BAlg1<br />
N1BGeom<br />
N1BInt2<br />
N1BAlg2<br />
N1BInt3<br />
Time how long it takes the Riverview Racer to make a full revolution.<br />
Determine the angular velocity <strong>of</strong> the ride.<br />
Measure the radius <strong>of</strong> the ride. Include units.<br />
Determine the distance a rider travels in one revolution. Include units.<br />
Determine the linear velocity <strong>of</strong> a rider.
The Dragon's Wing and The Joker<br />
MO CLEs<br />
N2DAlg1<br />
N2DGeom<br />
N2DInt2<br />
N2DAlg2<br />
N2DInt3<br />
N3DAlg1<br />
N3DGeom<br />
N3DInt2<br />
N3DAlg2<br />
N3DInt3<br />
N1BAlg1<br />
N1BGeom<br />
N1BInt2<br />
N1BAlg2<br />
N1BInt3<br />
The Dragon's Wing is a pendulum. We can use the formula P = 2π<br />
L g<br />
to relate P, the<br />
period <strong>of</strong> a pendulum (the time to go from one end all the way out to the other end and<br />
back to the starting point), to L, the length <strong>of</strong> the tether used. To use this formula, length<br />
must be measured in meters and “g” equals 9.81 meters/second.<br />
Time the period <strong>of</strong> The Dragon's Wing and use the above formula to determine the length<br />
<strong>of</strong> the cable tether that holds the riders.<br />
The Joker is not a pendulum. Show this by <strong>using</strong> the formula that relates the period to<br />
the length <strong>of</strong> the steel tethers in order to get an estimate for “g”.
The Spinning Rides<br />
MO CLEs<br />
N2DAlg1<br />
N2DGeom<br />
N2DInt2<br />
N2DAlg2<br />
N2DInt3<br />
N3DAlg1<br />
N3DGeom<br />
N3DInt2<br />
N3DAlg2<br />
N3DInt3<br />
N1BAlg1<br />
N1BGeom<br />
N1BInt2<br />
N1BAlg2<br />
N1BInt3<br />
A1BAlg1<br />
A1BGeom<br />
A1BInt2<br />
A1BAlg2<br />
A1BInt3<br />
A3AAlg1<br />
A3AGeom<br />
A3AInt2<br />
A3AAlg2<br />
A3AInt3<br />
D2CInt2<br />
D2CAlg2<br />
Use indirect measurement <strong>method</strong>s and estimation <strong>method</strong>s to determine an estimate for<br />
the radius <strong>of</strong> The Highland Fling. Count and time the number <strong>of</strong> revolutions per minute<br />
(rpm) for the ride. Obtain data on g-forces in the direction <strong>of</strong> the radius.<br />
Repeat this data collection for Xcalibur.<br />
Repeat this data collection for The Riverview Racer.<br />
For each ride, find the product <strong>of</strong> the radius and rpm.<br />
Graph the data for the product <strong>of</strong> the radius and rpm, compared to the g-forces<br />
experienced.<br />
Develop a model that relates the product <strong>of</strong> the radius and rpm to the g-forces<br />
experienced.
The Roller Coasters<br />
MO CLEs<br />
A1DAlg1<br />
A1DInt3<br />
A3AAlg1<br />
A3AGeom<br />
A3AInt2<br />
A3AAlg2<br />
A3AInt3<br />
Suppose that the roller coasters were not 3 dimensional, but rather 2 dimensional. Think<br />
about what the roller coaster would look like if we took it, cut the track in one spot, and<br />
dragged the track around so that it was all in one plane, still going up and down. This<br />
path <strong>of</strong> the track would then be like having a graph <strong>of</strong> a function.<br />
Select two roller coasters. Identify which roller coasters you are <strong>using</strong>. Draw a sketch <strong>of</strong><br />
the hills and valleys <strong>of</strong> these roller coasters, if they were moved around to be in a plane.<br />
For each roller coaster you are considering, what is the minimum degree <strong>of</strong> the<br />
polynomial that would model the path <strong>of</strong> the track?<br />
Explain why this is the minimum degree for such a polynomial.
Support structures<br />
MO CLEs<br />
A1BAlg1<br />
A1BGeom<br />
A1BInt2<br />
A1BAlg2<br />
A1BInt3<br />
A2AInt2<br />
A2AInt3<br />
A3AInt3<br />
Examine The Riverview Racer.<br />
How many seats does the ride have?<br />
Several sections <strong>of</strong> chain hold up each swing seat. How many sections <strong>of</strong> chain are there<br />
per swing seat?<br />
If an additional swing seat could be added, how many additional sections <strong>of</strong> chain would<br />
be needed?<br />
Write a recursive formula for the number <strong>of</strong> sections <strong>of</strong> chain on the ride as each swing<br />
seat was added during construction.<br />
Write a closed form formula that relates the number <strong>of</strong> sections <strong>of</strong> chain on the ride to the<br />
number <strong>of</strong> swing seats.
Mr. Freeze<br />
MO CLEs<br />
A1DAlg1<br />
A3AAlg1<br />
A3AGeom<br />
A3AInt2<br />
A3AAlg2<br />
A3AInt3<br />
If Mr. Freeze’s height vs. time <strong>of</strong> the ride were modeled by a function, to what family <strong>of</strong><br />
functions would it belong? Explain.<br />
If we consider the function that relates Mr. Freeze’s height vs. distance from the station,<br />
to what family <strong>of</strong> functions would it belong? Explain.
Pandemonium<br />
MO CLEs<br />
D3AInt3<br />
This will take some collaboration among class members or large group <strong>of</strong> students.<br />
Construct a hypothesis to be tested such as the following:<br />
Hypothesis: The cars on Pandemonium will spin more when the two heaviest people in<br />
the car are seated going backward, compared to when they are both seated on the left side<br />
<strong>of</strong> the car when starting from the station.<br />
Hypothesis: The number <strong>of</strong> times that cars spin on Pandemonium is independent <strong>of</strong> the<br />
locations where the two heaviest people in the car are seated.<br />
Hypothesis: The mean number <strong>of</strong> spins <strong>of</strong> the cars on Pandemonium is 3.5. That is, on<br />
average, a rider crosses changes direction with respect to the track 7 times.<br />
Hypothesis: On Pandemonium, less than 50% <strong>of</strong> the time, a rider will enter the station<br />
for unloading in the opposite direction they left the station upon loading. That is, less<br />
than 50% <strong>of</strong> the time, riders leave the station facing one way and enter the station facing<br />
the opposite way.<br />
Collect and analyze data to test your hypothesis.
Roller Coasters<br />
MO CLEs<br />
G1AAlg2<br />
G1AInt2<br />
N1BAlg1<br />
N1BGeom<br />
N1BInt2<br />
N1BAlg2<br />
N1BInt3<br />
N3EAlg1<br />
N3E Geom<br />
N3E Int2<br />
N3E Alg2<br />
N3E Int3<br />
M2EAlg1<br />
M2E Geom<br />
M2E Alg2<br />
M2E Int3<br />
D2CAlg1<br />
D2CInt2<br />
D2CAlg2<br />
D2CInt3<br />
D3AInt3<br />
Use indirect measurement techniques to determine the height <strong>of</strong> the first hill for at least 3<br />
roller coasters. Your teacher might direct you to measure a specific number <strong>of</strong> coasters to<br />
measure. He or she might require a particular minimum or maximum number <strong>of</strong> coasters<br />
to measure. Identify the roller coasters and their determined heights in the space<br />
provided.<br />
Estimate the maximum speed <strong>of</strong> these roller coasters by one <strong>of</strong> the timing <strong>method</strong>s.<br />
Identify the roller coasters and their determined speeds here.<br />
Graph the roller coasters’ speeds (y) and their heights (x).
Write an equation for a line <strong>of</strong> best fit that relates the roller coasters’ speeds (y) to their<br />
heights (x).<br />
Explain the meaning <strong>of</strong> the slope in your equation in context. Include units.<br />
Explain the meaning <strong>of</strong> the y intercept in your equation in context. Include units.<br />
Suppose that Six Flags wanted to build a 205 foot high roller coaster. Use your equation<br />
to predict the speed <strong>of</strong> such a roller coaster.<br />
Explain why your prediction might differ from the actual speed <strong>of</strong> such a roller coaster.<br />
Suppose Six Flags wanted to build a roller coaster that travels 90 miles per hour. Use<br />
your equation to predict the height <strong>of</strong> such a roller coaster.
Experimental Probability<br />
MO CLEs<br />
D4AInt2<br />
D4AAlg2<br />
D3AInt3<br />
D1AAlg1<br />
D1AGeom<br />
Collect data at the Ring Toss or at the Goblet Toss, located between the exit from<br />
Thunder River and the entrance to The Boss to estimate the probability <strong>of</strong> winning. Your<br />
teacher will set a minimum number <strong>of</strong> trials (tosses) to conduct.<br />
Does the probability <strong>of</strong> winning change, depending on whether you throw from the left<br />
side, the right side, or the front?<br />
Find the sample proportion <strong>of</strong> wins from your measurements.<br />
Find the standard error for the proportion <strong>of</strong> wins from your measurements.<br />
Construct and interpret a 95% confidence interval for the true proportion <strong>of</strong> wins.
Xcalibur<br />
MO CLEs<br />
G1AAlg2<br />
G1AInt2<br />
N1BAlg1<br />
N1BGeom<br />
N1BInt2<br />
N1BAlg2<br />
N1BInt3<br />
N3EAlg1<br />
N3E Geom<br />
N3E Int2<br />
N3E Alg2<br />
N3E Int3<br />
N3DAlg1<br />
N3DGeom<br />
N3DInt2<br />
N3DAlg2<br />
N3DInt3<br />
G4BAlg1<br />
G4BGeom<br />
G4BInt2<br />
G4BAlg2<br />
G4BInt3<br />
M2CGeom<br />
M2EAlg1<br />
M2E Geom<br />
While Xcalibur is loading and unloading, look up toward the two large counterweights at<br />
the top <strong>of</strong> the ride. These two large counterweights are not enough to counterbalance the<br />
weight <strong>of</strong> the wheel, motors, and riders at the other end, so the top half <strong>of</strong> the ride is filled<br />
with water. Use indirect measurement techniques to determine the volume <strong>of</strong> water<br />
contained within the top <strong>of</strong> the ride.
Decibels<br />
MO CLEs<br />
A3AAlg1<br />
A3AGeom<br />
A3AInt2<br />
A3AAlg2<br />
A3AInt3<br />
D2CAlg1<br />
D2CInt2<br />
D2CAlg2<br />
D2CInt3<br />
D3AInt3<br />
Use a decibel meter to measure the intensity <strong>of</strong> sound at various locations around the<br />
park. Your teacher might give a minimum or maximum number <strong>of</strong> measurements to<br />
take. Estimate the average sound intensity experienced in the park.<br />
Mr. Freeze is one <strong>of</strong> the louder rides to stand near. Mark on the map where you take<br />
decibel readings and also measure the distance from the decibel meter to the ride each<br />
time.<br />
For each measurement, graph the sound intensity (y) and the corresponding distance from<br />
the ride (x).<br />
Does your graph appear linear? If so, write an equation for a line <strong>of</strong> best fit that relates<br />
the sound intensity (y) and the corresponding distance from the ride (x). If not, what type<br />
<strong>of</strong> function would you propose for the relationship between x and y?<br />
Find the mean decibel meter reading for your measurements.<br />
Find the standard deviation for your decibel meter measurements.
Construct a 95% confidence interval for the mean sound intensity.
The lay <strong>of</strong> the land<br />
MO CLEs<br />
A1EAlg1<br />
A1EInt2<br />
A1EAlg2<br />
A1EInt3<br />
G1AGeom<br />
G1AInt2<br />
G1AAlg2<br />
G1AInt3<br />
G4BAlg1<br />
G4BGeom<br />
G4BInt2<br />
G4BAlg2<br />
G4BInt3<br />
Throughout the day, as you changed positions to measure indirectly the heights assigned<br />
to you, what did you notice about the <strong>angle</strong> <strong>of</strong> elevation at each measuring location?<br />
What relationship do you notice between the terrain at these locations and their<br />
corresponding <strong>angle</strong>s <strong>of</strong> elevation? What can you hypothesize about the <strong>angle</strong> <strong>of</strong><br />
elevation and the terrain?
Angles <strong>of</strong> elevation<br />
MO CLEs<br />
G1AGeom<br />
G1AInt2<br />
G1AAlg2<br />
G1AInt3<br />
G4BAlg1<br />
G4BGeom<br />
G4BInt2<br />
G4BAlg2<br />
G4BInt3<br />
N1BAlg1<br />
N1BGeom<br />
N1BInt2<br />
N1BAlg2<br />
N1BInt3<br />
If you make an indirect measurement <strong>of</strong> some object and lie on the ground to take your<br />
<strong>angle</strong> measurement, and someone else stands in front <strong>of</strong> you taking his or her own <strong>angle</strong><br />
measurement, what would you hypothesize is true <strong>of</strong> your <strong>angle</strong>s, if the other person’s<br />
line <strong>of</strong> sight is the same as your own?
Calculus Concepts 1<br />
MO CLEs<br />
G4BAlg1<br />
G4BGeom<br />
G4BInt2<br />
G4BAlg2<br />
G4BInt3<br />
A3AAlg1<br />
A3AGeom<br />
A3AInt2<br />
A3AAlg2<br />
A3AInt3<br />
1. You may obtain your own photo, though this photo <strong>of</strong> Mr. Freeze captures almost the<br />
entire ride.
2. Obtain accelerometer data (and barometric pressure data, if possible) for Mr. Freeze.<br />
That data should help you with the following problems.<br />
Definition: Let h(t) be the function that indicates the rider’s height above the ground at<br />
time t. Assume that the domain for h is limited to the portion <strong>of</strong> the ride clearly<br />
visible in the picture and you may choose to limit the domain to EITHER the<br />
portion <strong>of</strong> the ride where the train moves only forward OR only backward, if you<br />
wish.<br />
3. Sketch a graph <strong>of</strong> h(t). Indicate on the photo and on the graph the extrema<br />
(maxima/minima) for h(t).<br />
4. Sketch a graph <strong>of</strong> h’(t). Indicate on the photo and on the graph where, if at all, h’(t) is<br />
positive. If nowhere, why not?<br />
5. Sketch a graph <strong>of</strong> h’’(t). Indicate on the photo and on the graph where, if at all, h’’(t)<br />
is positive. If nowhere, why not?<br />
6. Regarding the function h(t), tell me what you know about continuity, differentiability,<br />
increasing/decreasing/monotonicity, and concavity. You might choose to discuss<br />
what would happen if some condition is violated; for example, what if h(t) lacked<br />
continuity, differentiability, etc.?
Calculus Concepts 2<br />
MO CLEs<br />
A3AAlg1<br />
A3AGeom<br />
A3AInt2<br />
A3AAlg2<br />
A3AInt3<br />
A4AAlg1<br />
A4AGeom<br />
A4AInt2<br />
A4AAlg2<br />
A4AInt3<br />
1. You may obtain your own photo, though this photo <strong>of</strong> Ninja captures some interesting<br />
parts <strong>of</strong> the ride.<br />
2. If possible, obtain accelerometer data (and barometric pressure data, if also possible)<br />
for Ninja. That data should help you with the following problems.<br />
Definition: Let h(t) be the function that indicates the rider’s height above the ground at<br />
time t. Assume that the domain for h is limited to the portion <strong>of</strong> the ride clearly<br />
visible in the picture and you MAY choose to limit the domain to EITHER the<br />
loop and following half loop OR the double corkscrew portion <strong>of</strong> the ride.
3. Sketch a graph <strong>of</strong> h(t). Indicate on the photo and on the graph the extrema<br />
(maxima/minima) for h(t).<br />
4. Sketch a graph <strong>of</strong> h’(t). Indicate on the photo and on the graph where, if at all, h’(t) is<br />
positive. If nowhere, why not?<br />
5. Sketch a graph <strong>of</strong> h’’(t). Indicate on the photo and on the graph where, if at all, h’’(t)<br />
is positive. If nowhere, why not?<br />
6. Regarding the function h(t), tell me what you know about continuity, differentiability,<br />
increasing/decreasing/monotonicity, and concavity. You might choose to discuss<br />
what would happen if some condition is violated; for example, what if h(t) lacked<br />
continuity, differentiability, etc.?
Calculus Concepts 3<br />
MO CLEs<br />
A3AAlg1<br />
A3AGeom<br />
A3AInt2<br />
A3AAlg2<br />
A3AInt3<br />
A4AAlg1<br />
A4AGeom<br />
A4AInt2<br />
A4AAlg2<br />
A4AInt3<br />
1. You may obtain your own photo, though this photo <strong>of</strong> Batman captures the initial<br />
drop, first loop, and the beginning <strong>of</strong> the roll.
2. If possible, obtain accelerometer data (and barometric pressure data, if also possible)<br />
for Batman. That data should help you with the following problems.<br />
Definition: Let h(t) be the function that indicates the rider’s height above the ground at<br />
time t. Assume that the domain for h is limited to the portion <strong>of</strong> the ride clearly<br />
visible in the picture, the ascent, drop, loop, and roll.<br />
3. Sketch a graph <strong>of</strong> h(t). Indicate on the photo and on the graph the extrema<br />
(maxima/minima) for h(t).<br />
4. Sketch a graph <strong>of</strong> h’(t). Indicate on the photo and on the graph where, if at all, h’(t) is<br />
positive. If nowhere, why not?<br />
5. Sketch a graph <strong>of</strong> h’’(t). Indicate on the photo and on the graph where, if at all, h’’(t)<br />
is positive. If nowhere, why not?<br />
6. Regarding the function h(t), tell me what you know about continuity, differentiability,<br />
increasing/decreasing/monotonicity, and concavity. You might choose to discuss<br />
what would happen if some condition is violated; for example, what if h(t) lacked<br />
continuity, differentiability, etc.?
Calculus Concepts 4<br />
MO CLEs<br />
A3AAlg1<br />
A3AGeom<br />
A3AInt2<br />
A3AAlg2<br />
A3AInt3<br />
A4AAlg1<br />
A4AGeom<br />
A4AInt2<br />
A4AAlg2<br />
A4AInt3<br />
A1DInt3<br />
1. You may obtain your own photo, though this photo <strong>of</strong> a ride much like The Highland<br />
Fling captures a portion <strong>of</strong> the ride.<br />
2. If possible, obtain accelerometer data (and barometric pressure data, if also possible)<br />
for The Highland Fling. That data should help you with the following problems.<br />
Definition: Let h(t) be the function that indicates the rider’s height above the ground at<br />
time t. Assume that the domain for h is limited to EITHER the portion <strong>of</strong> the ride<br />
in which the ride tilts upward OR returns downward.<br />
3. Sketch a graph <strong>of</strong> h(t). Indicate on the photo and on the graph the extrema<br />
(maxima/minima) for h(t).<br />
4. Sketch a graph <strong>of</strong> h’(t). Indicate on the photo and on the graph where, if at all, h’(t) is<br />
positive. If nowhere, why not?<br />
5. Sketch a graph <strong>of</strong> h’’(t). Indicate on the photo and on the graph where, if at all, h’’(t)<br />
is positive. If nowhere, why not?
6. Regarding the function h(t), tell me what you know about continuity, differentiability,<br />
increasing/decreasing/monotonicity, and concavity. You might choose to discuss<br />
what would happen if some condition is violated; for example, what if h(t) lacked<br />
continuity, differentiability, etc.?
Calculus Concepts 5<br />
MO CLEs<br />
A3AAlg1<br />
A3AGeom<br />
A3AInt2<br />
A3AAlg2<br />
A3AInt3<br />
A4AAlg1<br />
A4AGeom<br />
A4AInt2<br />
A4AAlg2<br />
A4AInt3<br />
1. You may obtain your own photo, though this photo <strong>of</strong> “Eagle Hill” from The<br />
Screaming Eagle captures a nice portion <strong>of</strong> the hill.<br />
2. If possible, obtain accelerometer data (and barometric pressure data, if also possible)<br />
for The Screaming Eagle. That data should help you with the following<br />
problems.<br />
Definition: Let h(t) be the function that indicates the rider’s height above the ground at<br />
time t. Assume that the domain for h is limited to the portion <strong>of</strong> the ride clearly<br />
visible in the picture, ascending Eagle Hill and then falling down Eagle Hill.<br />
3. Sketch a graph <strong>of</strong> h(t). Indicate on the photo and on the graph the extrema<br />
(maxima/minima) for h(t).<br />
4. Sketch a graph <strong>of</strong> h’(t). Indicate on the photo and on the graph where, if at all, h’(t) is<br />
positive. If nowhere, why not?<br />
5. Sketch a graph <strong>of</strong> h’’(t). Indicate on the photo and on the graph where, if at all, h’’(t)<br />
is positive. If nowhere, why not?
6. Regarding the function h(t), tell me what you know about continuity, differentiability,<br />
increasing/decreasing/monotonicity, and concavity. You might choose to discuss<br />
what would happen if some condition is violated; for example, what if h(t) lacked<br />
continuity, differentiability, etc.?
Calculus Concepts 6<br />
MO CLEs<br />
A3AAlg1<br />
A3AGeom<br />
A3AInt2<br />
A3AAlg2<br />
A3AInt3<br />
A4AAlg1<br />
A4AGeom<br />
A4AInt2<br />
A4AAlg2<br />
A4AInt3<br />
A1DInt3<br />
1. You may obtain your own photo, though this photo <strong>of</strong> Sea Dragon (located at Worlds<br />
<strong>of</strong> Fun in Kansas City) is very similar to one you would get <strong>of</strong> The Joker, Inc. and<br />
captures almost the entire ride.<br />
2. If possible, obtain accelerometer data (and barometric pressure data, if also possible)<br />
for The Joker, Inc.. That data should help you with the following problems.<br />
Definition: Let h(t) be the function that indicates the rider’s height above the ground at<br />
time t. Assume that the domain for h is the entire time the ride is in motion.<br />
3. Sketch a graph <strong>of</strong> h(t). Indicate on the photo and on the graph the extrema<br />
(maxima/minima) for h(t).<br />
4. Sketch a graph <strong>of</strong> h’(t). Indicate on the photo and on the graph where, if at all, h’(t) is<br />
positive. If nowhere, why not?
5. Sketch a graph <strong>of</strong> h’’(t). Indicate on the photo and on the graph where, if at all, h’’(t)<br />
is positive. If nowhere, why not?<br />
6. Regarding the function h(t), tell me what you know about continuity, differentiability,<br />
increasing/decreasing/monotonicity, and concavity. You might choose to discuss<br />
what would happen if some condition is violated; for example, what if h(t) lacked<br />
continuity, differentiability, etc.?
Calculus Concepts 7<br />
MO CLEs<br />
A3AAlg1<br />
A3AGeom<br />
A3AInt2<br />
A3AAlg2<br />
A3AInt3<br />
A4AAlg1<br />
A4AGeom<br />
A4AInt2<br />
A4AAlg2<br />
A4AInt3<br />
1. You may obtain your own photo, though these photos <strong>of</strong> The Screaming Eagle<br />
captures the entire first drop and first hill .<br />
2. If possible, obtain accelerometer data (and barometric pressure data, if also possible)<br />
for The Screaming Eagle. That data should help you with the following<br />
problems.<br />
Definition: Let h(t) be the function that indicates the rider’s height above the ground at<br />
time t. Assume that the domain for h is limited to the portion <strong>of</strong> the ride clearly<br />
visible in the picture. You may choose to exclude from the domain the ascent, if<br />
you wish.<br />
3. Sketch a graph <strong>of</strong> h(t). Indicate on the photo and on the graph the extrema<br />
(maxima/minima) for h(t).<br />
4. Sketch a graph <strong>of</strong> h’(t). Indicate on the photo and on the graph where, if at all, h’(t) is<br />
positive. If nowhere, why not?<br />
5. Sketch a graph <strong>of</strong> h’’(t). Indicate on the photo and on the graph where, if at all, h’’(t)<br />
is positive. If nowhere, why not?
6. Regarding the function h(t), tell me what you know about continuity, differentiability,<br />
increasing/decreasing/monotonicity, and concavity. You might choose to discuss<br />
what would happen if some condition is violated; for example, what if h(t) lacked<br />
continuity, differentiability, etc.?
Calculus Concepts 8<br />
MO CLEs<br />
A3AAlg1<br />
A3AGeom<br />
A3AInt2<br />
A3AAlg2<br />
A3AInt3<br />
A4AAlg1<br />
A4AGeom<br />
A4AInt2<br />
A4AAlg2<br />
A4AInt3<br />
A1DInt3<br />
1. You may obtain your own photo, though this photo <strong>of</strong> Ripcord (a ride at Worlds <strong>of</strong><br />
Fun) is similar to a photo you would get <strong>of</strong> The Dragon’s Wing.<br />
2. If possible, obtain accelerometer data (and barometric pressure data, if also possible)<br />
for The Dragon’s Wing. That data should help you with the following problems.<br />
Definition: Let h(t) be the function that indicates the rider’s height above the ground at<br />
time t. Assume that the domain for h is the total period <strong>of</strong> time in which the rider<br />
is in motion.
3. Sketch a graph <strong>of</strong> h(t). Indicate on the photo and on the graph the extrema<br />
(maxima/minima) for h(t).<br />
4. Sketch a graph <strong>of</strong> h’(t). Indicate on the photo and on the graph where, if at all, h’(t) is<br />
positive. If nowhere, why not?<br />
5. Sketch a graph <strong>of</strong> h’’(t). Indicate on the photo and on the graph where, if at all, h’’(t)<br />
is positive. If nowhere, why not?<br />
6. Regarding the function h(t), tell me what you know about continuity, differentiability,<br />
increasing/decreasing/monotonicity, and concavity. You might choose to discuss<br />
what would happen if some condition is violated; for example, what if h(t) lacked<br />
continuity, differentiability, etc.
Calculus Concepts 9<br />
MO CLEs<br />
A3AAlg1<br />
A3AGeom<br />
A3AInt2<br />
A3AAlg2<br />
A3AInt3<br />
A4AAlg1<br />
A4AGeom<br />
A4AInt2<br />
A4AAlg2<br />
A4AInt3<br />
M2EAlg2<br />
M2EInt3<br />
A1DInt2<br />
A1EAlg1<br />
A1EInt2<br />
A1EAlg2<br />
A1EInt3<br />
A2AAlg1<br />
A2A Int2<br />
A2A Alg2<br />
A4AAlg1<br />
A4A Int2<br />
For Calculus BC Students<br />
1. You may obtain your own photo <strong>of</strong> a hill on a roller coaster. It is best to find one that<br />
is “pr<strong>of</strong>ile” like these:
2. If possible, obtain accelerometer data (and barometric pressure data, if also possible)<br />
for the roller coaster you study. That data should help you with the following<br />
problems.<br />
Definition: Let y(t) be the function that indicates the rider’s height above the ground at<br />
time t. You may assume that the domain for y is limited to the portion <strong>of</strong> the ride<br />
from the top <strong>of</strong> the hill to the point <strong>of</strong> inflection; you can see such a portion in the<br />
photos above. Let x(t) be the function that indicates the rider’s position left or<br />
right <strong>of</strong> the top <strong>of</strong> the hill at time t.<br />
3. Time how many seconds it takes for a train to pass over the top <strong>of</strong> a particular hill,<br />
divide that time into the length <strong>of</strong> the train to find its horizontal velocity x’(t) at<br />
the top <strong>of</strong> the hill you’re examining?
4. A free fall hill shape gives a rider a weightless sensation. To give this weightless<br />
sensation over a hill, the hill is designed to have the same shape as the path <strong>of</strong> a<br />
ball being thrown <strong>of</strong>f the top <strong>of</strong> a hill. Shape is determined by how fast the roller<br />
coaster car travels over the hill. The faster the coaster travels over the hill the<br />
wider the hill must be. The vertical velocity y’(t)=0 at the top <strong>of</strong> the hill you’re<br />
examining. Knowing that the hill must follow freefall, the position function<br />
y(t)= -9.8t 2 + y(0), where y(0) is the initial height at the top <strong>of</strong> the hill. Complete<br />
this equation.<br />
5. Find the antiderivative (indefinite integral) <strong>of</strong> the x’(t) equation from part 3 to find the<br />
horizontal position function x(t). We’re assuming that friction is negligible for<br />
the distance we are examining.<br />
6. Solve the equation from part 5 for t and then substitute that expression into the<br />
equation from part 4 so that you have a rectangular equation for the shape <strong>of</strong> the<br />
hill rather than two parametric equations for the location <strong>of</strong> the train.
Calculus Invent-a-Lab<br />
MO CLEs<br />
A4AAlg1<br />
A4AGeom<br />
A4AInt2<br />
A4AAlg2<br />
A4AInt3<br />
G1BInt2<br />
G1BInt3<br />
M2EInt2<br />
M2EInt3<br />
M2CGeom<br />
A1DInt2<br />
A1DAlg2<br />
A1DInt3<br />
A1EAlg1<br />
A1EInt2<br />
A1EInt3<br />
A2AAlg2<br />
A2AInt3<br />
A2BAlg1<br />
A2BGeom<br />
A2BInt2<br />
A2BInt3<br />
Activity: Develop a specific lab activity (that could be carried out successfully by a<br />
student in a high school calculus course and that draws upon one or more items from the<br />
topic list below. Describe the ride(s) or specific section(s) <strong>of</strong> the ride(s), the<br />
measurements that would need to be taken or estimated and the equipment or instruments<br />
that would be needed, the calculations that would need to be done, the instruments that<br />
should be used, and the quality expected <strong>of</strong> the end results.<br />
Assessment: Does the activity display a good understanding <strong>of</strong> the underlying calculus<br />
concepts? Is it feasible? Does it present an element <strong>of</strong> challenge to the student’s ability or<br />
knowledge (or both)?<br />
Topic list:<br />
Limits<br />
Intermediate Value Theorem<br />
Derivatives<br />
Related Rates<br />
Approximations <strong>of</strong> derivatives<br />
Maximum or minimum<br />
Integrals<br />
Approximations <strong>of</strong> integrals<br />
Differential equations
Newton’s Law <strong>of</strong> Cooling<br />
Work (not yet covered in calc, but will be after the ap exams)<br />
Fluid force and pressure (not yet covered in calc, but will be after the ap exams)<br />
Hyperbolic functions (not yet covered in calc, but will be after the ap exams)<br />
Center <strong>of</strong> mass (not yet covered in calc, but will be after the ap exams)
Calculus Pedestrian Flow Rate at Six Flags Activity<br />
MO CLEs<br />
A4AAlg1<br />
A4AGeom<br />
A4AInt2<br />
A4AAlg2<br />
A4AInt3<br />
D1AAlg1<br />
D1AGeom<br />
1. Find some location in the park where people walk past, through, over, or under.<br />
Identify the location very clearly (How clearly? So that someone could find the exact<br />
spot without any doubt.) here:<br />
2. Count the number <strong>of</strong> people who pass by, through, over, or under that location, but<br />
count and record only in 1 minute intervals and only for those times in the table below.<br />
Use a stopwatch, watch, or a cell phone for the times. So, for example, if you time while<br />
eating lunch, you could time the following intervals:<br />
11:03-11:04, 11:04-11:05, 11:05-11:06, 11:07-11:08, 11:10-11:11, 11:12-11:13, 11:13-<br />
11:14, 11:14-11:15<br />
Time<br />
Interval<br />
Number<br />
<strong>of</strong><br />
People<br />
Passing<br />
1 st<br />
minute<br />
2 nd<br />
minute<br />
3 rd<br />
minute<br />
5 th<br />
minute<br />
8 th<br />
minute<br />
10 th<br />
minute<br />
11 th<br />
minute<br />
12 th<br />
minute<br />
3. Let P(t) be the function that describes the flow <strong>of</strong> people by this location where t is<br />
time in minutes and P(t) is measures in people per minute. Make and clearly label a<br />
reasonable graph <strong>of</strong> P(t) for the 12 minute interval you have timed.
4. Use the data you collected to estimate P ‘(2). Show your work and be sure to explain<br />
what P ‘(2) would mean with units.<br />
5. Use the data you collected to find a right approximation and a trapezoidal<br />
12<br />
approximation for ∫ P ( t)<br />
dt . Show your work and be sure to explain what this<br />
would mean with units.<br />
1
Calculus Scavenger Hunt<br />
MO CLEs<br />
M2EAlg2<br />
M2EInt3<br />
A1DInt2<br />
A1DInt3<br />
A4AAlg1<br />
A4AGeom<br />
A4AInt2<br />
A4AAlg2<br />
A4AInt3<br />
M2CGeom<br />
Find a place at Six Flags that exhibits an example <strong>of</strong> each <strong>of</strong> the descriptions below. Identify, Sketch<br />
and Justify. Use the back sides <strong>of</strong> the pages, if necessary. The same ride may be used more than once or<br />
not at all. Not all <strong>of</strong> the items are on rides. Not every ride will be open that day (you can include the closed<br />
rides). Be sure to describe the location fully. Do not just give the name <strong>of</strong> the ride/booth/building; tell<br />
where (on that ride/booth/building) it occurs, making a sketch as well. These are fully right or considered<br />
wrong, so it is a good idea to work with others. Extra credit will be given for unique (not used by anyone<br />
else) solutions, so it is a good idea to help one another come up with different examples! Remember to<br />
Identify, Sketch and Justify.<br />
Constant Horizontal Velocity<br />
Constant Vertical Velocity<br />
Constant Speed, but NOT constant velocity<br />
Acceleration in the horizontal direction
Acceleration in the vertical direction<br />
Periodic Motion<br />
Roller Coaster Track is Concave Up<br />
Roller Coaster Track is Concave Down<br />
Roller Coaster Track is Increasing<br />
Roller Coaster Track is Decreasing
Free Fall<br />
Velocity is zero, but the acceleration is<br />
non-zero<br />
Volume <strong>of</strong> Revolution could be determined Discontinuity would mean that someone<br />
could die or be seriously injured<br />
Differentiability was important when<br />
someone designed this<br />
Horizontal Asymptote
Vertical Asymptote<br />
Extrema<br />
Mean Value Theorem or Rolle’s Theorem
Scrambler Rides -<br />
SHAZAM!<br />
MO CLEs<br />
M2EAlg2<br />
M2EInt3<br />
A1DInt3<br />
A4AAlg1<br />
A4AGeom<br />
A4AInt2<br />
A4AAlg2<br />
A4AInt3<br />
A3AAlg1<br />
A3AGeom<br />
A3AInt2<br />
A3AAlg2<br />
A3AInt3<br />
DATA:<br />
Radius <strong>of</strong> primary axis (measured from center <strong>of</strong> ride to center <strong>of</strong> car cluster):<br />
________<br />
Radius <strong>of</strong> secondary axis (measured from center <strong>of</strong> car cluster to center <strong>of</strong> car):<br />
________<br />
Indicate on the diagram above the directions <strong>of</strong> rotation (as seen from above)<br />
Time for one rotation <strong>of</strong> the total ride: ________<br />
Time for one rotation <strong>of</strong> the car cluster: ________<br />
speed)<br />
Maximum lateral acceleration (a L ): __________ g's (measured on the ride at full<br />
Minimum lateral acceleration (a L ): __________ g's (measured on the ride at full<br />
speed)
In the problem that follows, ignore the fact that the entire ride is set at an <strong>angle</strong> to the<br />
horizontal. Consider the ride as if it were running in a horizontal manner. This is a place<br />
where your expertise in calculus will shine through. Good luck.<br />
PROBLEM<br />
(1) Given the rotation speed and the radius <strong>of</strong> the car cluster, write an equation to<br />
describe the position vs. time for an individual car in the frame <strong>of</strong> reference <strong>of</strong><br />
the car cluster.<br />
(2) Given the rotation speed and the radius <strong>of</strong> the car cluster on the total ride<br />
platform, write an equation to describe the ride position vs. time for a car cluster<br />
in the frame <strong>of</strong> reference <strong>of</strong> the stationary ground.<br />
(3) Add the results <strong>of</strong> your two equations to predict the overall position vs. time <strong>of</strong><br />
an individual car relative to the stationary ground. [This can be plotted on a<br />
graphing calculator if you have one with you. Hint: polar coordinates.]<br />
(4) Write the overall velocity vs. time equation for an individual car relative to the<br />
stationary ground.<br />
(5) Find the maximum and minimum accelerations (dv/dt) <strong>of</strong> an individual car as<br />
predicted by your equation.<br />
(6) Finally, compare your measured results with the calculated values.
The Highland Fling-- Calculus<br />
MO CLEs<br />
G1AAlg2<br />
G1AInt2<br />
M2BGeom<br />
M2CGeom<br />
Use indirect measurement techniques to find the dimensions <strong>of</strong> the wheel <strong>of</strong> the Highland<br />
Fling, the length <strong>of</strong> the giant arm that holds the wheel, and the number <strong>of</strong> degrees through<br />
which the giant arm passes. Calculate the volume swept out by the wheel as is rotates<br />
from horizontal to vertical.
Thunder River 1 – Calculus<br />
MO CLEs<br />
G1AAlg2<br />
G1AInt2<br />
M2EAlg1<br />
M2EGeom<br />
M2EAlg2<br />
M2EInt3<br />
M2CGeom<br />
Use indirect measurement techniques to estimate the dimensions <strong>of</strong> the water<br />
storage pool adjacent to Thunder River. Assume that the pool is a cylinder.<br />
Calculate the work done in pumping the water into (or out <strong>of</strong>) the pool through a<br />
pipe in the bottom <strong>of</strong> the pool. Remember that water weighs 62.4 pounds<br />
per square foot.<br />
Thunder River 2 – Calculus<br />
MO CLEs<br />
G1AAlg2<br />
G1AInt2<br />
M2EAlg1<br />
M2EGeom<br />
M2EAlg2<br />
M2EInt3<br />
M2CGeom<br />
Use indirect measurement techniques to estimate the dimensions <strong>of</strong> the doors<br />
that hold back the water in the water storage pool adjacent to thunder river.<br />
Calculate the fluid force <strong>of</strong> the water against the doors when closed. Remember<br />
that water weighs 62.4 pounds per square foot.
Hypothesis Testing and Confidence Intervals<br />
MO CLEs<br />
D1AAlg1<br />
D1AGeom<br />
D1CAlg1<br />
D1CGeom<br />
D1CAlg2<br />
D1CInt3<br />
D2AAlg1<br />
D2AInt2<br />
D2AAlg2<br />
D2CAlg1<br />
D2CInt2<br />
D2CAlg2<br />
D2CInt3<br />
D3AAlg1<br />
D3AInt3<br />
Hypothesis: The time for a circuit on Mr. Freeze and the temperature are associated.<br />
Hypothesis: There is a positive association between the time a guest stays at the park and<br />
the number <strong>of</strong> food products purchased.<br />
Hypothesis: There is no association between the time for a ride and the wait time for<br />
rides.<br />
Hypothesis: Gender and ride preference are independent variables.<br />
Construct an interval estimate for the level <strong>of</strong> Chlorine in the water used in a particular<br />
ride.<br />
Hypothesis: The time for a coaster to make a circuit is not associated with the total<br />
weight <strong>of</strong> the riders.<br />
Construct an interval estimate for the percent <strong>of</strong> Batman riders who also plan to ride Mr.<br />
Freeze.<br />
Construct an interval estimate for the average time (duration) for a particular ride.<br />
Construct an interval estimate for the difference in average wait times for two rides.<br />
Hypothesis: There is a significant difference in pulse between those who eat peppermint<br />
candy while in line for Mr. Freeze and those who do not eat peppermint candy while in<br />
line for Mr. Freeze.
Hypothesis: There is a significant difference in percent <strong>of</strong> men who indicate that they<br />
like to ride The Boss and the percent <strong>of</strong> women who indicate they like to ride The Boss.<br />
Hypothesis: There is an association between the time a guest leaves the park and the<br />
guest's satisfaction with the park, as measured on a student-generated survey.
Vertex-Edge Graphs<br />
MO CLEs<br />
G4AGeom<br />
Construct a Hamiltonian Circuit that could be followed to water hanging baskets, empty<br />
trash, or clean restrooms.
Adapted with permission<br />
from the presentation<br />
Trig Tools<br />
by Pam Burke<br />
as given at the<br />
T 3 Regional – MEGSL Conference<br />
Parkway West High School<br />
Ballwin, Missouri<br />
November 15, 2008<br />
Pam Burke<br />
Potosi High School<br />
Potosi, Missouri<br />
pamburke74@gmail.com<br />
pburke@potosir3.org
MO CLEs<br />
G1AINt2<br />
G1AAlg2<br />
N1BAlg1<br />
N1BGeom<br />
N1BAlg2<br />
N1BInt2<br />
N1BInt3<br />
G4AGeom<br />
G4AInt3<br />
G4BAlg1<br />
G4BGeom<br />
G4BAlg2<br />
G4BInt2<br />
G4BInt3
Name ____________________________________________<br />
Partners’ names<br />
______________________________________________<br />
______________________________________________<br />
______________________________________________<br />
Finding <strong>Measurement</strong>s <strong>Indirect</strong>ly Using Trigonometry<br />
Due date for project: _________________________<br />
Your task is to find the height <strong>of</strong> one corner <strong>of</strong> a building or other structure<br />
at Six Flags <strong>using</strong> an <strong>angle</strong> measuring device and trigonometry.<br />
Building the Clinometer<br />
The first part <strong>of</strong> your task is to build the clinometer you<br />
will use for measuring <strong>angle</strong>s.<br />
You will need the following materials:<br />
Protractor (these can be found online)<br />
rectangular-shaped piece <strong>of</strong> cardboard<br />
small straw or c<strong>of</strong>fee stirrer<br />
tape<br />
light-weight string or thread<br />
a weight (such as a fishing weight or a metal washer or nut)<br />
• Glue or tape the protractor to the piece <strong>of</strong> cardboard so that the zero line <strong>of</strong><br />
the protractor is on the edge <strong>of</strong> the cardboard.<br />
• Tape the straw on the edge <strong>of</strong> the cardboard along the zero line <strong>of</strong> the<br />
protractor.<br />
• Attach the string to the center vertex <strong>of</strong> the protractor.<br />
• Attach the weight to the bottom <strong>of</strong> the string.<br />
Collecting the Data<br />
At Six Flags, use your clinometers (or clinometers), measuring tapes, pencils,<br />
and paper, to gather data. Give all measurements in reasonable units.<br />
You will work in a group <strong>of</strong> three to five students. Partners are very important in
this project. Each person will make his own sightings, while the partners help<br />
take measurements. Within a group, the measurements should all be different.<br />
To ensure this, all group members should stand at different distances from the<br />
structure. But it is important that each person stand in the same spot to make all<br />
<strong>of</strong> his/her measurements. In your summary you will mention specifically how<br />
each person in your group helped you.<br />
You will be <strong>using</strong> right tri<strong>angle</strong> trigonometry, so you must have a right tri<strong>angle</strong> to<br />
work with. It would be nice if the buildings or other structures formed right <strong>angle</strong>s<br />
with the ground, but you are not always that lucky. You will need to “make” a<br />
b<br />
corner <strong>of</strong><br />
B°<br />
a<br />
h<br />
building,<br />
pole, etc.<br />
right tri<strong>angle</strong>. Study the diagram.<br />
• To find “h” you will need to use a measuring tape that you and your<br />
partners will have prepared before going outside. (This can be made from<br />
a piece <strong>of</strong> adding machine paper on which you have marked increments <strong>of</strong><br />
one inch.) Someone in your group should hold the piece <strong>of</strong> paper on the<br />
corner <strong>of</strong> the structure. You are to look through your clinometer at a 0°<br />
<strong>angle</strong>. One <strong>of</strong> your partners will look at the clinometer to make sure that<br />
your <strong>angle</strong> is exactly 0°. Another partner should be standing at the corner<br />
<strong>of</strong> the building. You are to direct that partner to take a reading on the<br />
measuring tape at the height you see when looking at a 0° <strong>angle</strong>.<br />
h = _______________<br />
• To find “a” you will need to carefully stretch a measuring tape so that it<br />
does not sag and read the distance. You will need the help <strong>of</strong> your<br />
partners to do this.<br />
a =_______________<br />
• To find the measure <strong>of</strong> the <strong>angle</strong> <strong>of</strong> elevation to the top <strong>of</strong> the building, use<br />
your clinometer.<br />
B = ________°<br />
• Now calculate b by <strong>using</strong> the correct trig function. Show work below.<br />
b = _______________
• For the total height <strong>of</strong> the corner <strong>of</strong> the building/pole, add “h” and “b.”<br />
The total height <strong>of</strong> the building/pole is _______________.<br />
• What heights did the rest <strong>of</strong> your group find? ______________________<br />
• What was the average height determined by your group? ___________<br />
Preparing the Report<br />
On graph paper make an accurate scale drawing, including all the measurements<br />
and the scale you used to make the drawing.<br />
Write a brief summary answering the following questions. This summary should<br />
be typed.<br />
• What is your calculated height <strong>of</strong> the building? Do you think this is a<br />
reasonable estimate? Why or why not?<br />
• How long did it take you to complete the task?<br />
• What difficulties did you encounter in completing the task?<br />
• What did each <strong>of</strong> your partners do in helping you take measurements?<br />
• What suggestions do you have for improving this project?<br />
• Would you recommend this project for future trig classes? Why or why not?<br />
Review your work for errors in spelling and grammar.<br />
Turn in this entire handout, along with your scale drawing and summary.<br />
☺☺☺☺☺☺☺☺☺☺☺☺☺☺☺☺☺☺☺☺☺☺☺☺☺☺☺☺☺☺☺☺☺☺☺☺☺☺☺☺☺☺<br />
☺☺☺☺☺<br />
To make 100% on the project, all criteria in the following scoring rubric must be<br />
met:<br />
• All required papers are turned in: complete handout, scale drawing, report,<br />
and any other work done on the project.<br />
• The scale drawings accurately depict the problem and show all<br />
measurements, including the scale used.<br />
• All questions are answered completely and accurately, with work shown<br />
where needed.<br />
• The computed height <strong>of</strong> the building/structure is reasonable.<br />
• There are no mathematical errors.
• Report was well written, with spelling and grammatical errors not significantly<br />
affecting the communication <strong>of</strong> ideas.<br />
If you turn your project in by the due date, your teacher will evaluate it. Then, if<br />
your project does not meet all the criteria, you will be given the opportunity to<br />
work more on it to bring it up to that standard.<br />
You may earn bonus points on your project by including the following: Interview an engineer or<br />
someone else who may use trig to take measurements in his/her work. Or <strong>using</strong> the Internet or<br />
other resource, research some use <strong>of</strong> trig in a comparable setting. Prepare a brief report (at least<br />
½ page typed). Include information about your source(s).
Name ______________________________________________<br />
Project Checklist<br />
____ All papers turned in<br />
____ Value <strong>of</strong> “h”<br />
____ Value <strong>of</strong> “a”<br />
____ <strong>Measurement</strong> <strong>of</strong> <strong>angle</strong><br />
____ Value <strong>of</strong> “b” (with work shown)<br />
____ Total height <strong>of</strong> the building<br />
____ Average height <strong>of</strong> the building for your group<br />
____ Accurate scale drawing (including all measurements and scale used)<br />
____ Report answers all questions and is well written<br />
• What is your calculated height <strong>of</strong> the building? Do you think this is a<br />
reasonable estimate? Why or why not?<br />
• How long did it take you to complete the task?<br />
• What difficulties did you encounter in completing the task?<br />
• What did each <strong>of</strong> your partners do in helping you take measurements?<br />
• What suggestions do you have for improving this project?<br />
• Would you recommend this project for future trig classes? Why or why<br />
not?