Yuan et al Remote Sensing of Env 2010.pdf - College of Natural ...
Yuan et al Remote Sensing of Env 2010.pdf - College of Natural ...
Yuan et al Remote Sensing of Env 2010.pdf - College of Natural ...

Create successful ePaper yourself
Turn your PDF publications into a flip-book with our unique Google optimized e-Paper software.
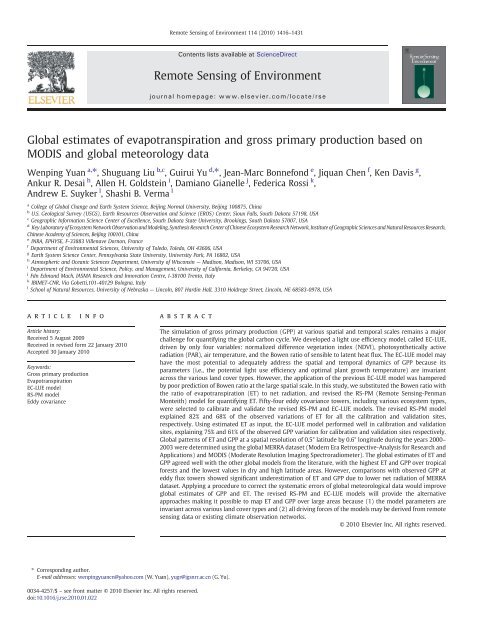
<strong>Remote</strong> <strong>Sensing</strong> <strong>of</strong> <strong>Env</strong>ironment 114 (2010) 1416–1431<br />
Contents lists available at ScienceDirect<br />
<strong>Remote</strong> <strong>Sensing</strong> <strong>of</strong> <strong>Env</strong>ironment<br />
journ<strong>al</strong> homepage: www.elsevier.com/locate/rse<br />
Glob<strong>al</strong> estimates <strong>of</strong> evapotranspiration and gross primary production based on<br />
MODIS and glob<strong>al</strong> m<strong>et</strong>eorology data<br />
Wenping <strong>Yuan</strong> a, ⁎, Shuguang Liu b,c , Guirui Yu d, ⁎, Jean-Marc Bonnefond e , Jiquan Chen f , Ken Davis g ,<br />
Ankur R. Desai h , Allen H. Goldstein i , Damiano Gianelle j , Federica Rossi k ,<br />
Andrew E. Suyker l , Shashi B. Verma l<br />
a <strong>College</strong> <strong>of</strong> Glob<strong>al</strong> Change and Earth System Science, Beijing Norm<strong>al</strong> University, Beijing 100875, China<br />
b U.S. Geologic<strong>al</strong> Survey (USGS), Earth Resources Observation and Science (EROS) Center, Sioux F<strong>al</strong>ls, South Dakota 57198, USA<br />
c Geographic Information Science Center <strong>of</strong> Excellence, South Dakota State University, Brookings, South Dakota 57007, USA<br />
d Key Laboratory <strong>of</strong> Ecosystem N<strong>et</strong>work Observation and Modeling, Synthesis Research Center <strong>of</strong> Chinese Ecosystem Research N<strong>et</strong>work, Institute <strong>of</strong> Geographic Sciences and Natur<strong>al</strong> Resources Research,<br />
Chinese Academy <strong>of</strong> Sciences, Beijing 100101, China<br />
e INRA, EPHYSE, F-33883 Villenave Dornon, France<br />
f Department <strong>of</strong> <strong>Env</strong>ironment<strong>al</strong> Sciences, University <strong>of</strong> Toledo, Toledo, OH 43606, USA<br />
g Earth System Science Center, Pennsylvania State University, University Park, PA 16802, USA<br />
h Atmospheric and Oceanic Sciences Department, University <strong>of</strong> Wisconsin — Madison, Madison, WI 53706, USA<br />
i Department <strong>of</strong> <strong>Env</strong>ironment<strong>al</strong> Science, Policy, and Management, University <strong>of</strong> C<strong>al</strong>ifornia, Berkeley, CA 94720, USA<br />
j Fdn Edmund Mach, IASMA Research and Innovation Centre, I-38100 Trento, It<strong>al</strong>y<br />
k IBIMET-CNR, Via Gob<strong>et</strong>ti,101-40129 Bologna, It<strong>al</strong>y<br />
l School <strong>of</strong> Natur<strong>al</strong> Resources, University <strong>of</strong> Nebraska — Lincoln, 807 Hardin H<strong>al</strong>l, 3310 Holdrege Stre<strong>et</strong>, Lincoln, NE 68583-0978, USA<br />
article<br />
info<br />
abstract<br />
Article history:<br />
Received 5 August 2009<br />
Received in revised form 22 January 2010<br />
Accepted 30 January 2010<br />
Keywords:<br />
Gross primary production<br />
Evapotranspiration<br />
EC-LUE model<br />
RS-PM model<br />
Eddy covariance<br />
The simulation <strong>of</strong> gross primary production (GPP) at various spati<strong>al</strong> and tempor<strong>al</strong> sc<strong>al</strong>es remains a major<br />
ch<strong>al</strong>lenge for quantifying the glob<strong>al</strong> carbon cycle. We developed a light use efficiency model, c<strong>al</strong>led EC-LUE,<br />
driven by only four variables: norm<strong>al</strong>ized difference veg<strong>et</strong>ation index (NDVI), photosynth<strong>et</strong>ic<strong>al</strong>ly active<br />
radiation (PAR), air temperature, and the Bowen ratio <strong>of</strong> sensible to latent heat flux. The EC-LUE model may<br />
have the most potenti<strong>al</strong> to adequately address the spati<strong>al</strong> and tempor<strong>al</strong> dynamics <strong>of</strong> GPP because its<br />
param<strong>et</strong>ers (i.e., the potenti<strong>al</strong> light use efficiency and optim<strong>al</strong> plant growth temperature) are invariant<br />
across the various land cover types. However, the application <strong>of</strong> the previous EC-LUE model was hampered<br />
by poor prediction <strong>of</strong> Bowen ratio at the large spati<strong>al</strong> sc<strong>al</strong>e. In this study, we substituted the Bowen ratio with<br />
the ratio <strong>of</strong> evapotranspiration (ET) to n<strong>et</strong> radiation, and revised the RS-PM (<strong>Remote</strong> <strong>Sensing</strong>-Penman<br />
Monteith) model for quantifying ET. Fifty-four eddy covariance towers, including various ecosystem types,<br />
were selected to c<strong>al</strong>ibrate and v<strong>al</strong>idate the revised RS-PM and EC-LUE models. The revised RS-PM model<br />
explained 82% and 68% <strong>of</strong> the observed variations <strong>of</strong> ET for <strong>al</strong>l the c<strong>al</strong>ibration and v<strong>al</strong>idation sites,<br />
respectively. Using estimated ET as input, the EC-LUE model performed well in c<strong>al</strong>ibration and v<strong>al</strong>idation<br />
sites, explaining 75% and 61% <strong>of</strong> the observed GPP variation for c<strong>al</strong>ibration and v<strong>al</strong>idation sites respectively.<br />
Glob<strong>al</strong> patterns <strong>of</strong> ET and GPP at a spati<strong>al</strong> resolution <strong>of</strong> 0.5° latitude by 0.6° longitude during the years 2000–<br />
2003 were d<strong>et</strong>ermined using the glob<strong>al</strong> MERRA datas<strong>et</strong> (Modern Era R<strong>et</strong>rospective-An<strong>al</strong>ysis for Research and<br />
Applications) and MODIS (Moderate Resolution Imaging Spectroradiom<strong>et</strong>er). The glob<strong>al</strong> estimates <strong>of</strong> ET and<br />
GPP agreed well with the other glob<strong>al</strong> models from the literature, with the highest ET and GPP over tropic<strong>al</strong><br />
forests and the lowest v<strong>al</strong>ues in dry and high latitude areas. However, comparisons with observed GPP at<br />
eddy flux towers showed significant underestimation <strong>of</strong> ET and GPP due to lower n<strong>et</strong> radiation <strong>of</strong> MERRA<br />
datas<strong>et</strong>. Applying a procedure to correct the systematic errors <strong>of</strong> glob<strong>al</strong> m<strong>et</strong>eorologic<strong>al</strong> data would improve<br />
glob<strong>al</strong> estimates <strong>of</strong> GPP and ET. The revised RS-PM and EC-LUE models will provide the <strong>al</strong>ternative<br />
approaches making it possible to map ET and GPP over large areas because (1) the model param<strong>et</strong>ers are<br />
invariant across various land cover types and (2) <strong>al</strong>l driving forces <strong>of</strong> the models may be derived from remote<br />
sensing data or existing climate observation n<strong>et</strong>works.<br />
© 2010 Elsevier Inc. All rights reserved.<br />
⁎ Corresponding author.<br />
E-mail addresses: wenpingyuancn@yahoo.com (W. <strong>Yuan</strong>), yugr@igsnrr.ac.cn (G. Yu).<br />
0034-4257/$ – see front matter © 2010 Elsevier Inc. All rights reserved.<br />
doi:10.1016/j.rse.2010.01.022
W. <strong>Yuan</strong> <strong>et</strong> <strong>al</strong>. / <strong>Remote</strong> <strong>Sensing</strong> <strong>of</strong> <strong>Env</strong>ironment 114 (2010) 1416–1431<br />
1417<br />
1. Introduction<br />
Terrestri<strong>al</strong> ecosystems drive most <strong>of</strong> the season<strong>al</strong> and interannu<strong>al</strong><br />
variations in atmospheric carbon dioxide (CO 2 ) concentration and<br />
have taken up about 20–30% annu<strong>al</strong> tot<strong>al</strong> anthropogenic CO 2 emission<br />
over the last two and h<strong>al</strong>f decades (Canadell <strong>et</strong> <strong>al</strong>., 2007). However,<br />
the geographic locations <strong>of</strong> this absorption are not well known<br />
(Friend <strong>et</strong> <strong>al</strong>., 2007). Moreover, atmospheric measurements and<br />
inverse modeling suggest that n<strong>et</strong> terrestri<strong>al</strong> carbon uptake substanti<strong>al</strong>ly<br />
increased from the 1980s to the 1990s (Battle <strong>et</strong> <strong>al</strong>., 2006;<br />
Bousqu<strong>et</strong> <strong>et</strong> <strong>al</strong>., 2000), but the causes <strong>of</strong> these increases are not well<br />
understood (Schimel <strong>et</strong> <strong>al</strong>., 2001). Veg<strong>et</strong>ation gross primary production<br />
(GPP) quantifies the gross carbon fixed by veg<strong>et</strong>ation in<br />
terrestri<strong>al</strong> ecosystems; in effect, it is the beginning <strong>of</strong> the carbon<br />
biogeochemic<strong>al</strong> cycle and the princip<strong>al</strong> indicator <strong>of</strong> biosphere carbon<br />
fluxes. Therefore, GPP is <strong>of</strong> great importance to the processes and<br />
factors regulating the terrestri<strong>al</strong> carbon sink.<br />
A number <strong>of</strong> ecosystem models have been widely applied as a<br />
means <strong>of</strong> quantifying spatio-tempor<strong>al</strong> variations in GPP at large sc<strong>al</strong>es<br />
(Cao & Woodward, 1998; Cramer <strong>et</strong> <strong>al</strong>., 1999; <strong>Yuan</strong> <strong>et</strong> <strong>al</strong>., 2007).<br />
However, different ecosystem models are inconclusive regarding the<br />
magnitude and spati<strong>al</strong> distribution <strong>of</strong> GPP at the region<strong>al</strong> and glob<strong>al</strong><br />
sc<strong>al</strong>es. For example, Cramer <strong>et</strong> <strong>al</strong>. (1999) compared 16 dynamic glob<strong>al</strong><br />
veg<strong>et</strong>ation models and suggested the lowest estimation <strong>of</strong> glob<strong>al</strong> NPP<br />
(39.9 Pg C) by the Hybrid model was approximately 50% sm<strong>al</strong>ler<br />
compared to what was estimated by the TURC model (Terrestri<strong>al</strong><br />
Uptake and Release <strong>of</strong> Carbon) (80.5 Pg C). Model outputs were<br />
indicated by low confidence at region<strong>al</strong> and glob<strong>al</strong> sc<strong>al</strong>es due to<br />
sever<strong>al</strong> major limitations: (1) spati<strong>al</strong> and tempor<strong>al</strong> h<strong>et</strong>erogeneity <strong>of</strong><br />
ecosystem processes used by models; (2) nonlinearity <strong>of</strong> the<br />
function<strong>al</strong> responses <strong>of</strong> ecosystem processes to environment<strong>al</strong><br />
variables; (3) requirement <strong>of</strong> both physiologic<strong>al</strong> or site-specific<br />
param<strong>et</strong>ers; and (4) inadequate v<strong>al</strong>idation against observation<br />
(B<strong>al</strong>docchi <strong>et</strong> <strong>al</strong>., 1996; Friend <strong>et</strong> <strong>al</strong>., 2007).<br />
The Light Use Efficiency (LUE) model may have the most potenti<strong>al</strong><br />
to adequately address the spati<strong>al</strong> and tempor<strong>al</strong> dynamics <strong>of</strong> GPP<br />
because it presents the consistent ecosystem processes across the<br />
various veg<strong>et</strong>ation types (Running <strong>et</strong> <strong>al</strong>., 2000), avoiding the problems<br />
on responsive nonlinearity <strong>of</strong> ecosystem processes to environment<strong>al</strong><br />
variables. The LUE model is built upon two fundament<strong>al</strong> assumptions<br />
(Running <strong>et</strong> <strong>al</strong>., 2004): (1) that ecosystem GPP is directly related to<br />
Absorbed Photosynth<strong>et</strong>ic<strong>al</strong>ly Active Radiation (APAR) through LUE,<br />
where LUE is defined as the amount <strong>of</strong> carbon produced per unit <strong>of</strong><br />
APAR and (2) that re<strong>al</strong>ized LUE may be reduced below its theor<strong>et</strong>ic<strong>al</strong><br />
potenti<strong>al</strong> v<strong>al</strong>ue by environment<strong>al</strong> stresses such as low temperatures<br />
or water shortages (Landsberg, 1986). The gener<strong>al</strong> form <strong>of</strong> the LUE<br />
model is:<br />
GPP = PAR × f PAR × ε max × f<br />
where PAR is the incident photosynth<strong>et</strong>ic<strong>al</strong>ly active radiation (MJ m −2 )<br />
per time period (e.g., day or month), fPAR is the fraction <strong>of</strong> PAR<br />
absorbed by the veg<strong>et</strong>ation canopy, ε max is the potenti<strong>al</strong> LUE (g C m −2<br />
MJ −1 APAR) without environment stress, and f is a sc<strong>al</strong>ar varying from 0<br />
to 1 and represents the effects <strong>of</strong> temperature, moisture, and other<br />
environment<strong>al</strong> conditions on LUE.<br />
We have developed a LUE model for simulating daily GPP, named<br />
the EC-LUE (Eddy Covariance Light Use Efficiency) model, derived by<br />
satellite data and eddy covariance measurements (<strong>Yuan</strong> <strong>et</strong> <strong>al</strong>., 2007).<br />
The EC-LUE model was c<strong>al</strong>ibrated and v<strong>al</strong>idated using estimated GPP<br />
from eddy covariance towers at the AmeriFlux and EuroFlux n<strong>et</strong>works,<br />
covering a vari<strong>et</strong>y <strong>of</strong> forests, grasslands, and savannas. More<br />
importantly, param<strong>et</strong>ers <strong>of</strong> the EC-LUE model are invariant across<br />
various veg<strong>et</strong>ation types, which make it possible to map daily GPP<br />
over large areas. The EC-LUE model uses the Bowen ratio <strong>of</strong> sensible to<br />
latent heat flux to present the moisture constraint to LUE, which<br />
ð1Þ<br />
hampers its applications due to the poor simulation <strong>of</strong> sensible and<br />
latent heat flux at large spati<strong>al</strong> sc<strong>al</strong>es. In addition, EC-LUE has not been<br />
v<strong>al</strong>idated at cropland ecosystems as a major ecosystem type<br />
impacting the region<strong>al</strong> and glob<strong>al</strong> carbon budg<strong>et</strong>s.<br />
Besides driving the EC-LUE model for simulating GPP, evapotranspiration<br />
(ET, equiv<strong>al</strong>ent <strong>of</strong> latent heat) over land is a key component<br />
<strong>of</strong> the climate system as it links the hydrologic<strong>al</strong>, energy, and carbon<br />
cycles (Dirmeyer, 1994; B<strong>et</strong>ts & B<strong>al</strong>l, 1997; Pielke <strong>et</strong> <strong>al</strong>., 1998).<br />
Accurate knowledge on tempor<strong>al</strong> and spati<strong>al</strong> variations <strong>of</strong> ET is critic<strong>al</strong><br />
for understanding the interactions b<strong>et</strong>ween land surfaces and the<br />
atmosphere, improving water and land resource management<br />
(Meyer, 1999; Raupach, 2001), drought d<strong>et</strong>ection and assessment<br />
(McVicar & Jupp, 1998), and region<strong>al</strong> hydrologic<strong>al</strong> applications<br />
(Kustas & Norman, 1996; Keane <strong>et</strong> <strong>al</strong>., 2002). However, ET remains<br />
the most problematic component <strong>of</strong> the water cycle because <strong>of</strong> the<br />
h<strong>et</strong>erogeneity <strong>of</strong> the landscape and the large number <strong>of</strong> controlling<br />
factors involved, including climate, plant biophysics, soil properties,<br />
and topography (Gash, 1987; Friedl, 1996; L<strong>et</strong>tenmaier & Famigli<strong>et</strong>ti,<br />
2006). <strong>Remote</strong>ly sensed data provides us with tempor<strong>al</strong>ly and<br />
spati<strong>al</strong>ly continuous information over veg<strong>et</strong>ated surfaces and is useful<br />
for accurately param<strong>et</strong>erizing surface biophysic<strong>al</strong> variables, such as<br />
leaf area index (LAI), and veg<strong>et</strong>ation cover, which can be used to<br />
develop a remotely sensed ET model.<br />
Eddy covariance (EC) measurements recorded by the increasing<br />
number <strong>of</strong> EC towers <strong>of</strong>fer the best opportunity for estimating<br />
veg<strong>et</strong>ation productivity and c<strong>al</strong>ibrating or v<strong>al</strong>idating ecosystem<br />
models. The concurrent measurements <strong>of</strong> m<strong>et</strong>eorologic<strong>al</strong> variables<br />
such as temperature and vapor pressure, as well as water b<strong>al</strong>ance<br />
variables including evapotranspiration and soil water statue, provide<br />
unprecedented datas<strong>et</strong>s for investigating the dynamics and driving<br />
variables <strong>of</strong> GPP. The CO 2 EC flux data now play a growing role in<br />
ev<strong>al</strong>uating process- and satellite-based models (Law <strong>et</strong> <strong>al</strong>., 2000). The<br />
n<strong>et</strong>work <strong>of</strong> EC towers (e.g., AmeriFlux) now covers a wide range <strong>of</strong><br />
biomes in contrast to most previous efforts, which focused on<br />
individu<strong>al</strong> sites or biomes. The overarching go<strong>al</strong>s <strong>of</strong> this study are to<br />
(1) refine GPP and ET models for mapping GPP and ET across the<br />
region<strong>al</strong> sc<strong>al</strong>es, and (2) investigate the spati<strong>al</strong> patterns <strong>of</strong> GPP and ET.<br />
2. Models and data<br />
2.1. Revised <strong>Remote</strong> <strong>Sensing</strong>-Penman Monteith (RS-PM) model<br />
The RS-PM model was origin<strong>al</strong>ly proposed by Cleugh <strong>et</strong> <strong>al</strong>. (2007).<br />
Mu <strong>et</strong> <strong>al</strong>. (2007) revised it by adding a soil evaporation component,<br />
using moisture and temperature constraints on stomat<strong>al</strong> conductance,<br />
and upsc<strong>al</strong>ing canopy conductance with leaf area index. In this study,<br />
we revised the equations de<strong>al</strong>ing with temperature constraint for<br />
stomat<strong>al</strong> conductance and energy <strong>al</strong>location b<strong>et</strong>ween veg<strong>et</strong>ation<br />
canopy and soil surface.<br />
Mu <strong>et</strong> <strong>al</strong>. (2007) c<strong>al</strong>culated the temperature and moisture<br />
constraints for stomat<strong>al</strong> conductance (m VPD and m TM ) as:<br />
8<br />
1:0 VPD≤VPD open<br />
><<br />
VPD<br />
m VPD =<br />
close −VPD<br />
VPD<br />
VPD close −VPD open bVPDbVPD close<br />
open<br />
>:<br />
0:1 VPD≥VPD close<br />
8<br />
1:0 TM≥TM open<br />
><<br />
TM−TM<br />
m TM =<br />
close<br />
TM<br />
TM open −TM close bTMbTM open<br />
close<br />
>:<br />
0:1 TM≤TM close<br />
where close indicates nearly compl<strong>et</strong>e inhibition (full stomat<strong>al</strong><br />
closure) and open indicates no inhibition to transpiration, TM is<br />
minimum air temperature (°C), and VPD is vapor pressure deficit<br />
ð2Þ<br />
ð3Þ
1418 W. <strong>Yuan</strong> <strong>et</strong> <strong>al</strong>. / <strong>Remote</strong> <strong>Sensing</strong> <strong>of</strong> <strong>Env</strong>ironment 114 (2010) 1416–1431<br />
(kPa). Studies have demonstrated, however, that high air temperature<br />
significantly decreases leaf stomat<strong>al</strong> conductance by closing stomata<br />
and causing structure defects (Schreiber <strong>et</strong> <strong>al</strong>., 2001). In our revised<br />
RS-PM <strong>al</strong>gorithm, the temperature constraint for stomat<strong>al</strong> conductance<br />
follows the equation d<strong>et</strong>ailed by June <strong>et</strong> <strong>al</strong>. (2004) and Fisher<br />
<strong>et</strong> <strong>al</strong>. (2008) with an optimum T opt s<strong>et</strong> as 25 °C.<br />
m T = exp − T−T ! 2<br />
!<br />
opt<br />
T opt<br />
where T is air temperature.<br />
N<strong>et</strong> radiation (R n ) is linearly partitioned b<strong>et</strong>ween the canopy and<br />
the soil surface using veg<strong>et</strong>ation cover fraction (F c ) in the study <strong>of</strong> Mu<br />
<strong>et</strong> <strong>al</strong>. (2007), such that:<br />
A c = F c × R n<br />
ð5Þ<br />
A soil = ð1−F c Þ × R n<br />
where A c and A soil are the tot<strong>al</strong> n<strong>et</strong> incoming radiation partitioned to<br />
the canopy and soil, respectively. F c is defined as the fraction <strong>of</strong><br />
ground surface covered by the maximum extent <strong>of</strong> the veg<strong>et</strong>ation<br />
canopy (varies b<strong>et</strong>ween 0 and 1). Mu <strong>et</strong> <strong>al</strong>. (2007) c<strong>al</strong>culated F c using<br />
EVI:<br />
F c =<br />
EVI−EVI min<br />
EVI max −EVI min<br />
where EVI min and EVI max are the sign<strong>al</strong>s from bare soil (LAI→0) and<br />
dense green veg<strong>et</strong>ation (LAI→∞),which are s<strong>et</strong> as season<strong>al</strong>ly and<br />
geographic<strong>al</strong>ly invariant constants 0.05 and 0.95, respectively.<br />
However, a number <strong>of</strong> studies have shown that irradiance decrease<br />
exponenti<strong>al</strong>ly with increasing canopy depth (Foroutan-Pour <strong>et</strong> <strong>al</strong>.,<br />
2001; Gholz <strong>et</strong> <strong>al</strong>., 1991; Monsi & Saeki, 1953; Vose <strong>et</strong> <strong>al</strong>., 1995). In our<br />
revised RS-PM <strong>al</strong>gorithm, we used the Beer–Lambert law to<br />
exponenti<strong>al</strong>ly partition n<strong>et</strong> radiation b<strong>et</strong>ween the canopy and the<br />
soil surface (Ruimy <strong>et</strong> <strong>al</strong>., 1999):<br />
A soil = R n × exp ð−k × LAIÞ<br />
A c = R n −A soil<br />
where LAI is leaf area index, and k is extinction coefficient (0.5).<br />
In addition, Mu <strong>et</strong> <strong>al</strong>. (2007) used a biome properties look-up table<br />
to d<strong>et</strong>ermine the param<strong>et</strong>ers: TM open , TM close , VPD close , and VPD open in<br />
the Eqs. (2) and (3). We conducted two sensitivity experiments in<br />
order to examine the necessity <strong>of</strong> varying param<strong>et</strong>ers with ecosystem<br />
types: (1) s<strong>et</strong>ting TM open and VPD close as the maximum v<strong>al</strong>ue (12 °C<br />
and 3.9 kPa) and TM close and VPD open as minimum v<strong>al</strong>ue (−8 °C and<br />
0.65 kPa) in the study <strong>of</strong> Mu <strong>et</strong> <strong>al</strong>. (2007) for <strong>al</strong>l study sites (see<br />
Table 1 <strong>of</strong> Mu <strong>et</strong> <strong>al</strong>. (2007)); and (2) s<strong>et</strong>ting TM open and VPD close as the<br />
minimum v<strong>al</strong>ue (8.31 °C and 2.5 kPa) and TM close and VPD open as<br />
maximum v<strong>al</strong>ue (−6 °C and 0.93 kPa) for <strong>al</strong>l study sites, respectively.<br />
There were not much differences <strong>of</strong> model simulations b<strong>et</strong>ween the<br />
two model experiments among various ecosystem types. The<br />
maximum difference <strong>of</strong> RPE (relative predictive errors, see Eq. (12))<br />
occurred at deciduous broadleaf forest with 2.9% and average v<strong>al</strong>ue<br />
was 2.4% in <strong>al</strong>l the ecosystem types. The maximum difference in<br />
coefficient <strong>of</strong> d<strong>et</strong>ermination was 0.04 at evergreen broadleaf forest,<br />
and average difference was 0.02 at <strong>al</strong>l ecosystem types. Therefore, it is<br />
possible to s<strong>et</strong> invariant model param<strong>et</strong>ers across the various<br />
veg<strong>et</strong>ation types. We c<strong>al</strong>ibrated three param<strong>et</strong>ers in the revised RS-<br />
PM model: VPD close , tot<strong>al</strong> aerodynamic conductance to vapor<br />
transport (C tot , the sum <strong>of</strong> soil surface conductance and the<br />
aerodynamic conductance for vapor transport), and mean potenti<strong>al</strong><br />
stomat<strong>al</strong> conductance (C l ) using observed ET from <strong>al</strong>l eddy flux<br />
towers in order to s<strong>et</strong> constant param<strong>et</strong>ers for <strong>al</strong>l veg<strong>et</strong>ation types.<br />
ð4Þ<br />
ð6Þ<br />
ð7Þ<br />
2.2. EC-LUE model<br />
The EC-LUE model is driven by only four variables: norm<strong>al</strong>ized<br />
difference veg<strong>et</strong>ation index (NDVI), photosynth<strong>et</strong>ic<strong>al</strong>ly active radiation<br />
(PAR), air temperature, and the Bowen ratio <strong>of</strong> sensible to latent<br />
heat flux. However, previous applications <strong>of</strong> the EC-LUE model were<br />
hampered by poor simulation <strong>of</strong> the Bowen ratio <strong>of</strong> sensible to latent<br />
heat flux at large spati<strong>al</strong> sc<strong>al</strong>es, which was used to present the<br />
moisture constraint on light use efficiency:<br />
W s = 1<br />
β +1 = LE<br />
LE + H<br />
where β is the Bowen ratio, and LE and H are ecosystem latent (MJ m −2 )<br />
and sensible heat flux (MJ m −2 ). In this study, we used R n to substitute<br />
the sum <strong>of</strong> LE and H, and revised downward-regulation sc<strong>al</strong>ar for<br />
moisture on LUE as:<br />
W s = LE<br />
R n<br />
LE is equiv<strong>al</strong>ence <strong>of</strong> ET, which could be estimated by the revised<br />
RS-PM model across the large spati<strong>al</strong> sc<strong>al</strong>es. R n can be derived from<br />
existing climate observation n<strong>et</strong>works (Zhang <strong>et</strong> <strong>al</strong>., 2004).<br />
2.3. Data at the EC sites<br />
The EC data were used in this study to c<strong>al</strong>ibrate and v<strong>al</strong>idate the<br />
revised RS-PM and EC-LUE model from the AmeriFLUX (http://public.<br />
ornl.gov/ameriflux) and EuroFLUX intern<strong>et</strong> Web pages (http://www.<br />
fluxn<strong>et</strong>.ornl.gov/fluxn<strong>et</strong>/index.cfm; V<strong>al</strong>entini, 2003). Fifty-four EC<br />
sites were included in this study (Table 1), covering six major<br />
terrestri<strong>al</strong> biomes: deciduous broadleaf forests, mixed forests,<br />
evergreen needleleaf forests, grasslands, savannas, and croplands.<br />
Supplementary information on the veg<strong>et</strong>ation, climate, and soil at<br />
each site is available on-line. H<strong>al</strong>f-hourly or hourly averaged glob<strong>al</strong><br />
radiation (R g ), photosynth<strong>et</strong>ic<strong>al</strong>ly active radiation (PAR), air temperature<br />
(T a ), and friction velocity (u*) were used tog<strong>et</strong>her with n<strong>et</strong><br />
ecosystem exchange <strong>of</strong> CO 2 (NEE) in this study. When available,<br />
datas<strong>et</strong>s that were gap-filled by site PIs were used for this study. For<br />
other sites, data filtering and gap-filling were conducted according to<br />
the following procedures.<br />
An outlier (“spike”) d<strong>et</strong>ection technique was applied, and the spikes<br />
were removed, following Pap<strong>al</strong>e <strong>et</strong> <strong>al</strong>. (2006). Because nighttime CO 2<br />
flux can be underestimated by eddy covariance measurements<br />
under stable conditions (F<strong>al</strong>ge <strong>et</strong> <strong>al</strong>., 2001), nighttime data with<br />
nonturbulent conditions were removed based on a u*-threshold<br />
criterion (site-specific 99% threshold criterion following Pap<strong>al</strong>e <strong>et</strong> <strong>al</strong>.,<br />
2006, and Reichstein <strong>et</strong> <strong>al</strong>., 2005).<br />
Nonlinear regression m<strong>et</strong>hods were used for filling NEE data gaps<br />
(F<strong>al</strong>ge <strong>et</strong> <strong>al</strong>., 2001). Nonlinear regression relationships b<strong>et</strong>ween<br />
measured fluxes and environment<strong>al</strong> factors were fit using a 15-day<br />
moving window. The Vant H<strong>of</strong>f (“Q 10 ”; see Lloyd & Taylor, 1994)<br />
equation was used to fill the missing nighttime fluxes (NEE night ):<br />
NEE night = Ae ðBTÞ<br />
ð10Þ<br />
where, A and B are fit model param<strong>et</strong>ers, T is air temperature (°C). A<br />
Michaelis–Menten light response equation was used to fill the missing<br />
daytime fluxes (NEE day )(F<strong>al</strong>ge <strong>et</strong> <strong>al</strong>., 2001):<br />
NEE day = α × PAR × F GPP;sat<br />
F GPP;sat + α × PAR −Re day<br />
ð8Þ<br />
ð9Þ<br />
ð11Þ<br />
where F GPP,sat (gross primary productivity at saturating light) and<br />
α (initi<strong>al</strong> slope <strong>of</strong> the light response function) are fit param<strong>et</strong>ers, and
W. <strong>Yuan</strong> <strong>et</strong> <strong>al</strong>. / <strong>Remote</strong> <strong>Sensing</strong> <strong>of</strong> <strong>Env</strong>ironment 114 (2010) 1416–1431<br />
1419<br />
Table 1<br />
Name, location, veg<strong>et</strong>ation type and available years <strong>of</strong> the study sites used for model c<strong>al</strong>ibration and v<strong>al</strong>idation.<br />
Site Latitude, longitude Veg<strong>et</strong>ation type Available years Reference<br />
C<strong>al</strong>ibration sites<br />
Aspen 53.62°N,106.19°W DBF 2002–2005 Griffis <strong>et</strong> <strong>al</strong>. (2003)<br />
Burn87 63.92°N,145.37°W DBF 2002–2004 Liu and Randerson (2008)<br />
Chestnut 35.93°N,84.33°W DBF 2006 /<br />
Goodwincreek 34.25°N,89.97°W DBF 2002–2006 /<br />
Toledo 41.55°N,83.84°W DBF 2004–2005 /<br />
Willowcreek 45.90°N,90.07°W DBF 2000–2006 Cook <strong>et</strong> <strong>al</strong>. (2004)<br />
Puechabon 43.73°N,3.58°E EBF 2000–2003 Ramb<strong>al</strong> <strong>et</strong> <strong>al</strong>. (2004)<br />
Blackspruce 53.98°N,105.12°W ENF 2000–2005 Griffis <strong>et</strong> <strong>al</strong>. (2003)<br />
Boeas_nsa 55.87°N,98.48°W ENF 2000–2004 Dunn <strong>et</strong> <strong>al</strong>. (2007)<br />
Dukepine 35.97°N,79.09°W ENF 2000–2005 Stoy <strong>et</strong> <strong>al</strong>. (2008)<br />
Howland 45.20°N,68.74°W ENF 2000–2004 Hollinger <strong>et</strong> <strong>al</strong>. (2004)<br />
Jackpine 53.91°N,104.69°W ENF 2000–2003 Griffis <strong>et</strong> <strong>al</strong>. (2003)<br />
Tharandt 50.95°N,13.56°E ENF 2000–2003 Grünw<strong>al</strong>d and Berh<strong>of</strong>er (2007)<br />
Uci1964 55.91°N,98.38°W ENF 2001–2005 Goulden <strong>et</strong> <strong>al</strong>. (2006)<br />
Uci1989 55.91°N,98.96°W ENF 2003–2005 /<br />
Windriver 45.82°N,121.95°W ENF 2004–2006 Paw <strong>et</strong> <strong>al</strong>. (2004)<br />
Dukegrass 35.97°N,79.09°W GRS 2001–2005 Novick <strong>et</strong> <strong>al</strong>. (2004)<br />
W<strong>al</strong>nutriver 37.52°N,96.85°W GRS 2001–2004 Song <strong>et</strong> <strong>al</strong>. (2005)<br />
Lavarone 45.95°N,11.26°E MIX 2000–2002 Fiora and Cescatti (2006)<br />
Sylvania 46.24°N,89.34°W MIX 2002–2006 Desai <strong>et</strong> <strong>al</strong>. (2005)<br />
Winmahard 46.63°N,91.09°W MIX 2004 /<br />
V<strong>al</strong>idation sites<br />
Bondville 40.00°N,88.29°W CRP 2002–2006 Meyers and Hollinger (2004)<br />
Meadirrigated 41.16°N,96.47°W CRP 2001–2004 Verma <strong>et</strong> <strong>al</strong>. (2005)<br />
Meadirrrotate 41.16°N,96.47°W CRP 2001–2004 Verma <strong>et</strong> <strong>al</strong>. (2005)<br />
Meadrainfed 41.17°N,96.43°W CRP 2001–2004 Verma <strong>et</strong> <strong>al</strong>. (2005)<br />
Dukehardwood 35.97°N,79.10°W DBF 2001–2005 Pataki and Oren (2003)<br />
Hainich 51.06°N,10.45°E DBF 2000–2003 Knohl <strong>et</strong> <strong>al</strong>. (2003)<br />
Hesse 48.66°N,7.05°E DBF 2000–2003 Granier <strong>et</strong> <strong>al</strong>. (2000)<br />
Indianammsf 39.32°N,86.41°W DBF 2000–2003 Schmid <strong>et</strong> <strong>al</strong>. (2000)<br />
W<strong>al</strong>kerbrach 35.95°N,84.28°W DBF 2000–2001, 2004 Wilson and B<strong>al</strong>docchi (2000)<br />
ParcoTicino 45.20°N,9.05°E DBF 2003 Migliavacca <strong>et</strong> <strong>al</strong>. (2009)<br />
Austincary 29.73°N,82.21°W EBF 2005–2006 Gholz and Clark (2002)<br />
Blackhill 44.15°N,103.65°W ENF 2004–2006 /<br />
Blodg<strong>et</strong>t 38.89°N,120.63°W ENF 2001–2004 Goldstein <strong>et</strong> <strong>al</strong>. (2000)<br />
Control 63.89°N,145.74°W ENF 2002–2004 Liu and Randerson (2008)<br />
Don<strong>al</strong>dson 29.75°N,82.16°W ENF 2000–2003 Gholz and Clark (2002)<br />
LeBray 44.71°N,0.76°E ENF 2000, 2003 Berbigier <strong>et</strong> <strong>al</strong>. (2001)<br />
M<strong>et</strong>oliusmidpine 44.45°N,121.55°W ENF 2002–2005 Law <strong>et</strong> <strong>al</strong>. (2004)<br />
M<strong>et</strong>oliusoldyoung 44.43°N,121.56°W ENF 2000–2002 Law <strong>et</strong> <strong>al</strong>. (2000)<br />
Niwotridge 40.03°N,105.54°W ENF 2000–2004 Monson <strong>et</strong> <strong>al</strong>. (2005)<br />
Uci1930 55.90°N,98.52°W ENF 2001–2004 Goulden <strong>et</strong> <strong>al</strong>. (2006)<br />
Uci1981 55.86°N,98.48°W ENF 2002–2003 Goulden <strong>et</strong> <strong>al</strong>. (2006)<br />
Uci1998 56.63°N,99.94°W ENF 2002–2005 Goulden <strong>et</strong> <strong>al</strong>. (2006)<br />
W<strong>et</strong>zstein 50.45°N,11.45°E ENF 2002–2003 Anthoni <strong>et</strong> <strong>al</strong>. (2004)<br />
Winmared 46.73°N,91.16°W ENF 2004–2005 Noorm<strong>et</strong>s <strong>et</strong> <strong>al</strong>. (2007)<br />
Burn99 63.92°N,145.74°W GRS 2002–2004 Liu and Randerson (2008)<br />
Canaanv<strong>al</strong>ley 39.06°N,79.42°W GRS 2004 /<br />
L<strong>et</strong>hbridge 49.70°N,112.94°W GRS 2000–2001 Flanagan and Johnson (2005)<br />
Monte Bondone 38.53°N,8.00°E GRS 2001 Marcolla and Cescatti (2005)<br />
Vairaranch 38.40°N,120.95°W GRS 2001–2006 Ryu <strong>et</strong> <strong>al</strong>. (2008)<br />
Fortdix 39.97°N,74.43°W MIX 2006 /<br />
Nonantola 44.68°N,11.08°E MIX 2001–2003 /<br />
Umichigan 45.55°N,84.71°W MIX 2000–2006 Curtis <strong>et</strong> <strong>al</strong>. (2005)<br />
Tonzi Ranch 38.43°N,120.96°W SAV 2002–2006 Ma <strong>et</strong> <strong>al</strong>. (2007)<br />
DBF: deciduous broadleaf fores; EBF: evergreen broadleaf forest; ENF: evergreen needleleaf forest; GRS: grassland; MIX: mixed forest; CRP: cropland; SAV: savanna.<br />
Re day (ecosystem respiration during the day) was estimated by<br />
extrapolation <strong>of</strong> Eq. (10) using the daytime air temperature.<br />
Daily NEE, Re, and m<strong>et</strong>eorologic<strong>al</strong> variables were synthesized<br />
based on h<strong>al</strong>f-hourly or hourly v<strong>al</strong>ues and the daily v<strong>al</strong>ues were<br />
indicated as missing when missing data was more than 20% <strong>of</strong> entire<br />
data at a given day, otherwise daily v<strong>al</strong>ues were c<strong>al</strong>culated by<br />
multiplying averaged hourly rate by 24 (hours). GPP was c<strong>al</strong>culated as<br />
the sum <strong>of</strong> NEE and Re. Based on the daily datas<strong>et</strong>, yearly v<strong>al</strong>ues <strong>of</strong><br />
various variables can be c<strong>al</strong>culated by multiplying averaged daily rate<br />
by 365 (days). If missing daily data was more than 20% <strong>of</strong> entire year<br />
data, the v<strong>al</strong>ue <strong>of</strong> this year was indicated as missing.<br />
Norm<strong>al</strong>ized difference veg<strong>et</strong>ation index (NDVI) and leaf area index<br />
(LAI) for the sites were d<strong>et</strong>ermined from the Moderate Resolution<br />
Imaging Spectroradiom<strong>et</strong>er (MODIS). MODIS ASCII subs<strong>et</strong> data were<br />
used in this study and generated from MODIS Collection 5 data, which<br />
was downloaded directly from the Oak Ridge Nation<strong>al</strong> Laboratory<br />
Distributed Active Center (ORNL DAAC) Web site. The 8-day MODIS LAI<br />
(MOD15A2) and 16-day MODIS NDVI (MOD13A2) data at 1-km spati<strong>al</strong><br />
resolution were the basis for models verification in the flux sites. Only the<br />
NDVI and LAI v<strong>al</strong>ues <strong>of</strong> the pixel containing the tower were used. Qu<strong>al</strong>ity<br />
control (QC) flags,whichsign<strong>al</strong>cloudcontaminationineachpixel,were<br />
examined to screen and reject NDVI and LAI data <strong>of</strong> insufficient qu<strong>al</strong>ity.
1420 W. <strong>Yuan</strong> <strong>et</strong> <strong>al</strong>. / <strong>Remote</strong> <strong>Sensing</strong> <strong>of</strong> <strong>Env</strong>ironment 114 (2010) 1416–1431<br />
2.4. Data at the glob<strong>al</strong> sc<strong>al</strong>e<br />
For glob<strong>al</strong> estimates <strong>of</strong> ET and GPP, we used input datas<strong>et</strong>s for n<strong>et</strong><br />
radiation (R n ), air temperature (T), relative humidity (R h ) and<br />
photosynth<strong>et</strong>ic<strong>al</strong>ly active radiation (PAR) from the MERRA (Modern<br />
Era R<strong>et</strong>rospective-An<strong>al</strong>ysis for Research and Applications) archive for<br />
2000–2003 (Glob<strong>al</strong> Modeling and Assimilation Office, 2004). MERRA<br />
is a NASA rean<strong>al</strong>ysis for the satellite era using a major new version <strong>of</strong><br />
the Goddard Earth Observing System Data Assimilation System<br />
Version 5 (GEOS-5). MERRA uses data from <strong>al</strong>l available surface<br />
weather observations glob<strong>al</strong>ly every 3 h, and GEOS-5 was used to<br />
interpolate and grid these point data on a short time sequence, and<br />
produces an estimate <strong>of</strong> climatic conditions for the world, at 10<br />
m<strong>et</strong>ers above the land surface (approximating canopy height<br />
conditions) and at a resolution <strong>of</strong> 0.5° latitude by 0.6° longitude.<br />
MERRA rean<strong>al</strong>yses datas<strong>et</strong> has been v<strong>al</strong>idated carefully at the glob<strong>al</strong><br />
sc<strong>al</strong>e using surface m<strong>et</strong>eorologic<strong>al</strong> data s<strong>et</strong>s to ev<strong>al</strong>uate the uncertainty<br />
<strong>of</strong> various m<strong>et</strong>eorologic<strong>al</strong> factors (e.g. temperature, radiation,<br />
humidity, energy b<strong>al</strong>ance), which showed MERRA considerably<br />
reduced the energy and water imb<strong>al</strong>ance. D<strong>et</strong>ailed information on<br />
the MERRA datas<strong>et</strong> is available at the website (http://gmao.gsfc.nasa.<br />
gov/research/merra/).<br />
The glob<strong>al</strong> 8-day MODIS LAI (MOD15A2) and 16-day MODIS NDVI<br />
(MOD13A2) data were used in this study. Qu<strong>al</strong>ity control (QC) flags<br />
were examined to screen and reject NDVI and LAI data <strong>of</strong> insufficient<br />
qu<strong>al</strong>ity. We tempor<strong>al</strong>ly filled the missing or unreliable LAI and NDVI at<br />
each 1-km MODIS pixel based on their corresponding qu<strong>al</strong>ity<br />
assessment data fields as proposed by Zhao <strong>et</strong> <strong>al</strong>. (2005). If the first<br />
(or last) 8-day LAI (16-day NDVI) data are unreliable or missing, they<br />
will be replaced by the closest reliable 8-day (16-day) v<strong>al</strong>ues.<br />
Fig. 1. Variation in 8-day mean v<strong>al</strong>ue <strong>of</strong> predicted and observed ET at model c<strong>al</strong>ibration sites. The black solid lines represent the predicted ET, and the open circle dots represent<br />
observed ET.
W. <strong>Yuan</strong> <strong>et</strong> <strong>al</strong>. / <strong>Remote</strong> <strong>Sensing</strong> <strong>of</strong> <strong>Env</strong>ironment 114 (2010) 1416–1431<br />
1421<br />
2.5. Nonlinear optimization and statistic<strong>al</strong> an<strong>al</strong>ysis<br />
The nonlinear regression procedure (Proc NLIN) in the Statistic<strong>al</strong><br />
An<strong>al</strong>ysis System (SAS, SAS Institute Inc., Cary, NC, USA) was applied to<br />
two c<strong>al</strong>culations: (1) to d<strong>et</strong>ermine the param<strong>et</strong>er v<strong>al</strong>ues in the<br />
equation filling NEE data gaps and c<strong>al</strong>culating daytime ecosystem<br />
respiration (i.e., Eqs. (10) and (11)), and (2) to optimize the v<strong>al</strong>ues for<br />
VPD close , R tot and C l in the revised RS-PM model (see Mu <strong>et</strong> <strong>al</strong>., 2007),<br />
and T opt and ε max (see <strong>Yuan</strong> <strong>et</strong> <strong>al</strong>., 2007) in the EC-LUE model across <strong>al</strong>l<br />
the c<strong>al</strong>ibration sites.<br />
Fig. 2. Variation in 8-day mean v<strong>al</strong>ue <strong>of</strong> predicted ET and observed ET at model v<strong>al</strong>idation sites. The black solid lines represent the predicted ET, and the open circle dots represent observed ET.
1422 W. <strong>Yuan</strong> <strong>et</strong> <strong>al</strong>. / <strong>Remote</strong> <strong>Sensing</strong> <strong>of</strong> <strong>Env</strong>ironment 114 (2010) 1416–1431<br />
Three m<strong>et</strong>rics were used to ev<strong>al</strong>uate the performance <strong>of</strong> the<br />
revised RS-PM and EC-LUE model in this study:<br />
(1) The coefficient <strong>of</strong> d<strong>et</strong>ermination, R 2 , representing how much<br />
variation in the observations was explained by the models.<br />
(2) Absolute predictive error (PE), quantifying the difference<br />
b<strong>et</strong>ween simulated and observed v<strong>al</strong>ues:<br />
PE = P S − P O<br />
ð12Þ<br />
where − S and − O are mean simulated and mean observed v<strong>al</strong>ues,<br />
respectively.<br />
(3) Relative predictive error (RPE), computed as:<br />
P P S − O<br />
RPE = P × 100% ð13Þ<br />
O<br />
3. Results<br />
3.1. C<strong>al</strong>ibration and v<strong>al</strong>idation <strong>of</strong> the revised RS-PM model<br />
Twenty-one sites were selected to c<strong>al</strong>ibrate the revised RS-PM<br />
model, and other thirty-three sites were to v<strong>al</strong>idate the model<br />
(Table 1). Both c<strong>al</strong>ibration and v<strong>al</strong>idation sites covered sever<strong>al</strong><br />
dominant natur<strong>al</strong> and agricultur<strong>al</strong> ecosystem types, including:<br />
evergreen needleleaf forests, mixed forests, deciduous broadleaf<br />
forests, grasslands, savannas, and croplands.<br />
The c<strong>al</strong>ibrated v<strong>al</strong>ues for C tot , C l and VPD close were 0.008 m s − 1 ,<br />
0.003 m s − 1 , and 2.79 kPa in the revised RS-PM model, respectively.<br />
Fig. 1 shows the range <strong>of</strong> predicted ET and observed ET at the 21<br />
c<strong>al</strong>ibration sites (Fig. 1). The model <strong>al</strong>so successfully predicted the<br />
magnitudes and season<strong>al</strong> variations <strong>of</strong> the observed ET at the v<strong>al</strong>idation<br />
sites (Fig. 2). Collectively, the revised RS-PM model explained<br />
about 82% <strong>of</strong> the variation <strong>of</strong> 8-day ET at <strong>al</strong>l c<strong>al</strong>ibration sites (Fig. 3a).<br />
Model performance was similar to that at the c<strong>al</strong>ibration sites and<br />
explained 68% <strong>of</strong> the ET variations at these new sites (Fig. 3b).<br />
However, large differences b<strong>et</strong>ween predicted and observed ET<br />
still existed in a few sites. Predicted ET v<strong>al</strong>ues were higher than<br />
observed ET at Aspen, Jackpine, and Tonzi Ranch with RPE v<strong>al</strong>ues <strong>of</strong><br />
41%, 30%, and 93%, respectively (Table 2). The model underestimated<br />
the ET at Bondville, Monte Bondone, and Canaanv<strong>al</strong>ley with the RPE<br />
varying from 31% to 39%. At the other 48 sites, the RPE v<strong>al</strong>ues were<br />
lower than 30%.<br />
Our revised RS-PM <strong>al</strong>gorithm improved the ET estimates at most <strong>of</strong><br />
the 54 flux towers compared with these estimated using the origin<strong>al</strong><br />
RS-PM <strong>al</strong>gorithm, and reduced RPE at 36 <strong>of</strong> the 54 flux tower sites<br />
(data not shown). The average absolute v<strong>al</strong>ue <strong>of</strong> RPE <strong>of</strong> the 8-day<br />
latent heat fluxes over the 54 flux towers was decreased using the<br />
revised RS-PM <strong>al</strong>gorithm to 15% compared with the 22% <strong>of</strong> the origin<strong>al</strong><br />
<strong>al</strong>gorithm. The coefficient <strong>of</strong> d<strong>et</strong>ermination (R 2 ) b<strong>et</strong>ween the ET<br />
estimates and observations for the 8-day results are higher at 48 sites,<br />
averaging 0.78 using revised RS-PM <strong>al</strong>gorithm and 0.67 using the<br />
origin<strong>al</strong> version.<br />
Fig. 4 showed the model performance <strong>of</strong> our revised RS-PM model<br />
driven by tower-specific m<strong>et</strong>eorology and the glob<strong>al</strong> MERRA<br />
m<strong>et</strong>eorology datas<strong>et</strong>, respectively. The model driven by towerspecific<br />
m<strong>et</strong>eorology data explained 83% variations <strong>of</strong> annu<strong>al</strong> mean<br />
ET across 54 flux sites (Fig. 4a), and provided no systematic errors in<br />
model predictions. In contrast, using the MERRA datas<strong>et</strong> significantly<br />
decreased model performance, and explained 67% <strong>of</strong> the variations <strong>of</strong><br />
ET and underestimated ET at the most sites (Fig. 4b).<br />
3.2. C<strong>al</strong>ibration and v<strong>al</strong>idation <strong>of</strong> EC-LUE model<br />
Using ET simulated by the revised RS-PM model, the c<strong>al</strong>ibrated<br />
v<strong>al</strong>ues for optim<strong>al</strong> temperature and potenti<strong>al</strong> LUE were 21 °C and<br />
2.25 g C MJ − 1 . The EC-LUE model successfully predicted the magnitudes<br />
and season<strong>al</strong> variations <strong>of</strong> the estimated GPP from EC measurements<br />
at c<strong>al</strong>ibration and v<strong>al</strong>idation sites (Figs. 5, 6). The model<br />
explained about 75% and 61% <strong>of</strong> the variation <strong>of</strong> 8-day GPP estimated at<br />
c<strong>al</strong>ibration and v<strong>al</strong>idation sites, respectively (Fig. 7). There were no<br />
significant systematic errors in model predictions. Although the EC-<br />
LUE model explained significant amounts <strong>of</strong> GPP variability at the<br />
individu<strong>al</strong> sites, large differences b<strong>et</strong>ween predicted GPP and estimated<br />
GPP v<strong>al</strong>ues from EC measurements still existed at a few sites. The<br />
model underestimated GPP at sever<strong>al</strong> European sites (e.g., Hesse,<br />
MonteBondone and Nonantola) with RPE higher than 40% (Table 2).<br />
Predictions were higher than observed for GPP at sever<strong>al</strong> high latitude<br />
sites (Uci 1989, Uci1930, Uci1998 and Burn99) and at Tonzi Ranch PE<br />
v<strong>al</strong>ues varied from 0.41 g C m −2 day − 1 to 1.25 g C m −2 day − 1 and<br />
RPE v<strong>al</strong>ues from 35% to 63%, respectively. At the other 37 sites, the EC-<br />
LUE model gave accurate predictions with RPE v<strong>al</strong>ues lower than 30%<br />
(Table 2).<br />
Using n<strong>et</strong> radiation to substitute the sum <strong>of</strong> H and LE, the revised<br />
EC-LUE <strong>al</strong>gorithm gener<strong>al</strong>ly performed worse than the origin<strong>al</strong> GPP<br />
<strong>al</strong>gorithm at most <strong>of</strong> the 54 flux sites. The revised EC-LUE model<br />
produced higher predictive errors at 35 <strong>of</strong> the 54 flux towers, and the<br />
absolute RPE <strong>of</strong> the 8-day GPP increased from 18% <strong>of</strong> the origin<strong>al</strong> EC-<br />
LUE <strong>al</strong>gorithm to 24% using the revised <strong>al</strong>gorithm. The coefficient <strong>of</strong><br />
d<strong>et</strong>ermination (R 2 ) b<strong>et</strong>ween the GPP estimates and observations for<br />
the 8-day results decreases from 0.89 <strong>of</strong> origin<strong>al</strong> EC-LUE to 0.73 <strong>of</strong><br />
revised version. Predictive errors <strong>of</strong> ET significantly induced the biases<br />
Fig. 3. Observed and predicted ET at the model c<strong>al</strong>ibration (a) and v<strong>al</strong>idation (b) sites in Table 1. The short dash lines are 1:1 line and the solid lines are linear regression line.
W. <strong>Yuan</strong> <strong>et</strong> <strong>al</strong>. / <strong>Remote</strong> <strong>Sensing</strong> <strong>of</strong> <strong>Env</strong>ironment 114 (2010) 1416–1431<br />
1423<br />
Table 2<br />
Predicted results <strong>of</strong> the revised RS-PM and EC-LUE model at c<strong>al</strong>ibration and v<strong>al</strong>idation sites.<br />
Site Revised RS-PM model Revised EC-LUE model<br />
a<br />
ET o<br />
b<br />
ET p R 2 PE RPE<br />
c<br />
GPP o<br />
d<br />
GPP p R 2 PE RPE<br />
C<strong>al</strong>ibration sites<br />
Aspen 1.81 2.58 0.84 0.75 0.41 3.23 3.22 0.83 −0.01 0.00<br />
Burn87 2.03 2.01 0.89 −0.03 −0.01 1.79 1.83 0.80 0.04 0.02<br />
Chestnut 2.78 3.14 0.93 0.35 0.13 3.50 4.02 0.90 0.52 0.13<br />
Goodwincreek 4.69 4.64 0.85 −0.04 −0.01 3.99 4.48 0.71 0.49 0.11<br />
Toledo 4.86 4.87 0.83 0.01 0.00 5.63 5.69 0.78 0.06 0.01<br />
Willowcreek 2.60 2.79 0.81 0.19 0.07 4.88 4.12 0.76 −0.76 −0.18<br />
Puechabon 3.15 2.97 0.74 −0.17 −0.05 3.76 2.88 0.40 −0.88 −0.31<br />
Blackspruce 1.80 2.10 0.87 0.31 0.17 2.37 2.07 0.82 −0.30 −0.14<br />
Boeas_nsa 1.84 1.92 0.83 0.08 0.04 2.46 1.92 0.86 −0.54 −0.28<br />
Dukepine 4.82 4.57 0.79 −0.25 −0.05 5.24 4.79 0.75 −0.45 −0.09<br />
Howland 2.77 3.04 0.86 0.28 0.10 4.29 4.57 0.88 0.28 0.06<br />
Jackpine 1.72 2.25 0.67 0.52 0.30 2.07 2.35 0.84 0.28 0.12<br />
Tharandt 3.09 2.70 0.80 −0.39 −0.13 5.12 3.64 0.83 −1.48 −0.41<br />
Uci1964 1.76 1.75 0.84 −0.01 0.00 1.66 1.82 0.84 0.16 0.09<br />
Uci1989 1.79 2.00 0.83 0.21 0.12 1.25 2.50 0.72 1.25 0.50<br />
Windriver 3.42 3.20 0.74 −0.23 −0.07 3.67 3.50 0.57 −0.17 −0.05<br />
Dukegrass 4.13 4.09 0.74 −0.04 −0.01 3.07 2.18 0.74 −0.89 −0.41<br />
W<strong>al</strong>nutriver 3.77 3.56 0.86 −0.21 −0.06 2.78 2.64 0.90 −0.14 −0.05<br />
Lavarone 3.41 2.47 0.74 −0.94 −0.28 5.05 3.31 0.72 −1.74 −0.52<br />
Sylvania 2.27 2.66 0.87 0.40 0.17 3.34 3.96 0.90 0.62 0.16<br />
Winmahard 4.65 4.43 0.81 −0.22 −0.05 5.91 4.81 0.88 −1.10 −0.23<br />
V<strong>al</strong>idation sites<br />
Bondville 3.82 2.63 0.68 −1.19 −0.31 2.81 1.73 0.67 −0.92 −0.35<br />
Meadirrigated 3.95 3.30 0.87 −0.64 −0.16 5.26 3.52 0.84 −1.74 −0.33<br />
Meadirrrotate 4.00 3.31 0.82 −0.69 −0.17 4.06 3.21 0.82 −0.85 −0.21<br />
Meadrainfed 3.95 3.47 0.79 −0.48 −0.12 4.31 3.55 0.74 −0.76 −0.18<br />
Dukehardwood 4.33 4.42 0.85 0.08 0.02 4.15 4.58 0.77 0.43 0.10<br />
Hainich 2.23 2.55 0.82 0.32 0.14 4.94 3.93 0.85 −1.01 −0.20<br />
Hesse 2.78 2.53 0.87 −0.25 −0.09 5.37 2.73 0.71 −2.64 −0.49<br />
Indianammsf 4.03 3.77 0.76 −0.26 −0.06 5.49 5.05 0.59 −0.44 −0.08<br />
W<strong>al</strong>kerbrach 5.11 4.63 0.73 −0.48 −0.09 4.90 5.95 0.41 0.96 0.19<br />
ParcoTicino 3.90 3.51 0.88 −0.39 −0.10 4.50 2.51 0.91 −1.99 −0.44<br />
Austincary 3.54 4.27 0.69 0.74 0.21 4.21 5.14 0.56 0.92 0.22<br />
Blackhill 3.35 2.44 0.67 −0.90 −0.27 2.22 1.59 0.64 −0.63 −0.28<br />
Blodg<strong>et</strong>t 3.17 3.65 0.73 0.48 0.15 3.25 3.50 0.61 0.24 0.08<br />
Control 2.35 2.49 0.75 0.14 0.06 1.94 1.64 0.68 −0.30 −0.16<br />
Don<strong>al</strong>dson 5.85 4.91 0.42 −0.93 −0.16 6.93 5.88 0.42 −1.05 −0.15<br />
LeBray 4.67 3.32 0.68 −1.35 −0.29 6.20 3.87 0.65 −2.37 −0.38<br />
M<strong>et</strong>oliusmidpine 2.82 3.39 0.50 0.57 0.20 3.89 3.36 0.69 −0.53 −0.14<br />
M<strong>et</strong>oliusoldyoung 2.52 3.09 0.68 0.57 0.23 2.23 2.56 0.69 0.34 0.15<br />
Niwotridge 3.39 2.96 0.81 −0.43 −0.13 2.10 2.26 0.70 0.16 0.08<br />
Uci1930 2.03 2.21 0.82 0.18 0.09 1.54 2.40 0.67 0.93 0.63<br />
Uci1981 2.85 2.57 0.84 −0.28 −0.10 1.20 1.28 0.61 0.09 0.08<br />
Uci1998 1.80 1.38 0.91 −0.42 −0.23 1.12 1.48 0.83 0.46 0.45<br />
W<strong>et</strong>zstein 2.79 2.28 0.75 −0.51 −0.18 4.45 2.89 0.82 −1.56 −0.35<br />
Winmared 5.39 5.54 0.43 0.16 0.03 6.19 5.52 0.68 −0.75 −0.12<br />
Burn99 2.19 2.30 0.73 0.11 0.05 1.02 1.65 0.67 0.63 0.62<br />
Canaanv<strong>al</strong>ley 5.23 3.28 0.20 −1.95 −0.37 3.53 4.01 0.52 0.49 0.14<br />
L<strong>et</strong>hbridge 1.90 1.84 0.59 −0.06 −0.03 0.92 0.53 0.28 −0.39 −0.43<br />
Monte Bondone 3.37 2.04 0.91 −1.33 −0.39 3.67 2.11 0.80 −1.55 −0.42<br />
Vairaranch 2.25 2.09 0.51 −0.16 −0.07 2.97 2.94 0.55 −0.07 −0.02<br />
Fortdix 3.14 2.60 0.78 −0.59 −0.18 1.76 2.73 0.86 0.97 0.55<br />
Nonantola 2.99 2.52 0.54 −0.47 −0.16 4.61 2.52 0.47 −2.09 −0.45<br />
Umichigan 3.60 3.19 0.86 −0.41 −0.11 4.73 5.96 0.78 1.12 0.23<br />
Tonzi Ranch 1.15 2.21 0.57 1.06 0.93 1.11 2.09 0.80 0.98 0.89<br />
a<br />
b<br />
c<br />
d<br />
Observed ET from eddy covariance measurements.<br />
Predicted ET by the revised RS-PM model.<br />
Observed GPP from eddy covariance measurements.<br />
Predicted GPP by the revised EC-LUE model.<br />
<strong>of</strong> GPP simulations in the some study sites. For example, overestimates<br />
<strong>of</strong> ET at Tonzi Ranch induced overestimates <strong>of</strong> GPP.<br />
Four cropland sites were included in this study for testing the<br />
performance <strong>of</strong> EC-LUE at cropland ecosystems. These four sites were<br />
characterized by different ecosystem features: (a) irrigated continuous<br />
maize (Meadirrigated), (b) irrigated maize–soybean rotation<br />
(Bondville and Meadirrotate), and (c) rainfed maize–soybean rotation<br />
(Meadrainfed). The EC-LUE model performed very well for predicting<br />
the soybean ecosystem, but significantly underestimated the GPP for<br />
maize. There was similar model performance in irrigated and rain fed<br />
ecosystems.<br />
We compared the annu<strong>al</strong> mean GPP observations measured at the<br />
flux towers and two s<strong>et</strong>s <strong>of</strong> estimated GPP with the revised EC-LUE<br />
driven by tower-specific m<strong>et</strong>eorology (Fig. 8a) and the glob<strong>al</strong> MERRA<br />
m<strong>et</strong>eorology (Fig. 8b), respectively. The coefficient <strong>of</strong> d<strong>et</strong>ermination<br />
b<strong>et</strong>ween the GPP observations and the tower-driven <strong>al</strong>gorithm<br />
estimates was 0.81 with a slight underestimate <strong>of</strong> GPP (Fig. 8a). The<br />
model explained 67% <strong>of</strong> the variations <strong>of</strong> GPP using MERRA datas<strong>et</strong>,
1424 W. <strong>Yuan</strong> <strong>et</strong> <strong>al</strong>. / <strong>Remote</strong> <strong>Sensing</strong> <strong>of</strong> <strong>Env</strong>ironment 114 (2010) 1416–1431<br />
Fig. 4. Comparison <strong>of</strong> annu<strong>al</strong> mean evapotranspiration (ET) observations from the flux<br />
tower sites and estimated by the revised RS-PM model. These data were created using<br />
(a) tower-specific m<strong>et</strong>eorology (y=0.91x+0.24, R 2 =0.83) and (b) the glob<strong>al</strong> MERRA<br />
m<strong>et</strong>eorology (y=0.57x+0.57, R 2 =0.67).<br />
and significantly underestimated GPP across the spati<strong>al</strong> sc<strong>al</strong>es<br />
(Fig. 8b).<br />
3.3. Glob<strong>al</strong> spati<strong>al</strong> patterns <strong>of</strong> ET and GPP<br />
We assessed the glob<strong>al</strong> spati<strong>al</strong> patterns <strong>of</strong> ET and GPP averaged<br />
from 2000 to 2003 using 0.5°×0.6° monthly gridded MERRA input<br />
data. ET was high over the tropic<strong>al</strong> rain forests and subtropic<strong>al</strong> forest<br />
regions like the southeastern United States and the Pantan<strong>al</strong> region <strong>of</strong><br />
South American. ET was low over deserts, high mountain regions, and<br />
the polar zones (Fig. 9). The southern hemispheric tropics remained<br />
consistently high, while the major deserts <strong>of</strong> northern Africa and<br />
Austr<strong>al</strong>ia remain consistently low. Glob<strong>al</strong> mean ET estimated by our<br />
revised RS-PM model was 417±38 mm year − 1 across the veg<strong>et</strong>ated<br />
area.<br />
Glob<strong>al</strong> annu<strong>al</strong> GPP was 110.5±21.3 Pg C. The highest annu<strong>al</strong><br />
production (N2000 g C m − 2 ) is found in the humid tropics (Amazonia,<br />
Centr<strong>al</strong> Africa, South-east Asia), where both temperature and moisture<br />
requirements are fully satisfied for photosynthesis. Temperate regions<br />
have an intermediate GPP (1000–1400 g C m − 2 ), and the lowest GPP<br />
(b400 g C m − 2 ) is found in both cold and arid regions, where either<br />
temperature or precipitation are limiting factors (Fig. 10).<br />
4. Discussion<br />
4.1. Model performance an<strong>al</strong>ysis<br />
Model c<strong>al</strong>ibration and v<strong>al</strong>idation at 54 EC sites in North America<br />
and Europe suggested that the revised RS-PM and EC-LUE models<br />
were robust and reliable across the most <strong>of</strong> biomes and geographic<br />
regions. Fig. 3 showed that the revised RS-PM model did not produce<br />
significant predictive errors <strong>of</strong> ET across the c<strong>al</strong>ibration and v<strong>al</strong>idation<br />
sites (Fig. 3). The EC-LUE model underestimated GPP at the v<strong>al</strong>idation<br />
sites (Fig. 7b), however, sever<strong>al</strong> croplands were included in v<strong>al</strong>idation<br />
sites, and the EC-LUE model significantly underestimated the GPP for<br />
maize. When excluding the data from the four croplands, the<br />
performance <strong>of</strong> EC-LUE model g<strong>et</strong> much b<strong>et</strong>ter.<br />
Under the same climate conditions, C 4 crops have greater<br />
photosynth<strong>et</strong>ic capacity and more rapid accumulation <strong>of</strong> green leaf<br />
area than C 3 crops (Suyker <strong>et</strong> <strong>al</strong>., 2005). Param<strong>et</strong>ers <strong>of</strong> EC-LUE model,<br />
however, were c<strong>al</strong>ibrated at C 3 plant dominant ecosystems, which<br />
was the major cause for underestimation <strong>of</strong> GPP at the maize crops. It<br />
is worth noting, however, that overestimating magnitude <strong>of</strong> GPP for<br />
maize were close at the four croplands, and peak simulated GPP were<br />
50% sm<strong>al</strong>ler than observed GPP. Consistent potenti<strong>al</strong> light use<br />
efficiency can be derived for C 4 crop to improve the performance <strong>of</strong><br />
EC-LUE model at the maize croplands. Meadirrigated site was selected<br />
to c<strong>al</strong>ibrate the EC-LUE model for maize croplands, and the c<strong>al</strong>ibrated<br />
v<strong>al</strong>ues for optim<strong>al</strong> temperature and potenti<strong>al</strong> LUE were 19 °C and<br />
4.06 g C MJ − 1 . The EC-LUE model successfully predicted the magnitudes<br />
and season<strong>al</strong> variations <strong>of</strong> observed GPP at the Meadirrigated<br />
site and other three croplands using different param<strong>et</strong>ers v<strong>al</strong>ue for C 3<br />
and C 4 crops (Fig. 11). This result implied that it is necessary to use a<br />
spati<strong>al</strong> distribution map <strong>of</strong> C 3 and C 4 crops for improving the accuracy<br />
for quantifying GPP across the glob<strong>al</strong> sc<strong>al</strong>e.<br />
The revised RS-PM and EC-LUE models used satellite data to<br />
provide tempor<strong>al</strong>ly and spati<strong>al</strong>ly continuous information over<br />
veg<strong>et</strong>ated surfaces, which significantly strengthened model performances<br />
across the region<strong>al</strong> sc<strong>al</strong>es. This study used MODIS/Terra<br />
NDVI and LAI products, directly downloaded from the MODIS<br />
Web site. No attempt was made to improve the qu<strong>al</strong>ity <strong>of</strong> the<br />
NDVI or LAI data. Therefore, any noise or errors in the satellite<br />
data was transferred to ET and GPP predictions. In addition, we used<br />
1-km 2 MODIS NDVI and LAI pixels for amorphous polygon eddy flux<br />
footprints that change throughout the day and year. If the veg<strong>et</strong>ation<br />
and environment<strong>al</strong> characteristics within the footprint are representative<br />
<strong>of</strong> the surrounding area in which the MODIS pixels contain,<br />
then the pixel-to-footprint match should be adequate. A forested<br />
eddy flux site adjacent to a clear cut, for example, would induce<br />
problems if both the forest and clear cut were included in the MODIS<br />
overlap. Thus, some error in our model estimates for the eddy flux<br />
sites can be attributed to inaccurate NDVI and LAI estimates for the<br />
footprints.<br />
In order to strengthen the applicability <strong>of</strong> EC-LUE at the region<strong>al</strong><br />
sc<strong>al</strong>e, n<strong>et</strong> radiation was used to substitute the summation <strong>of</strong> H and LE<br />
for representing the downward-regulation sc<strong>al</strong>ars for the effect <strong>of</strong><br />
moisture on LUE <strong>of</strong> veg<strong>et</strong>ation. However, we reasoned that soil heat flux<br />
(G s ) has high spati<strong>al</strong> variability mismatching with the R n and (H+LE)<br />
measurement, which resulted in prediction errors <strong>of</strong> modeling GPP.<br />
Clearly, the uncertainty in the G s is large because <strong>of</strong> the spati<strong>al</strong><br />
variability <strong>of</strong> veg<strong>et</strong>ation and soil (Mayocchi & Bristow, 1995; Twine<br />
<strong>et</strong> <strong>al</strong>., 2000). In grasslands and other ecosystems with sparse canopies,<br />
G s plays a more critic<strong>al</strong> role in the energy fluxes. For example,<br />
Meyers (2001) found in grasslands that G s accounted for 25% <strong>of</strong> R n .In<br />
forests, however, G s usu<strong>al</strong>ly accounts for b5% <strong>of</strong> R n (Beringer <strong>et</strong> <strong>al</strong>.,<br />
2005; Chen <strong>et</strong> <strong>al</strong>., 2002), and can be neglected. Estimation <strong>of</strong> G s across<br />
the region<strong>al</strong> sc<strong>al</strong>es will improve the accuracy for quantifying GPP at<br />
large regions.<br />
Significant underestimation <strong>of</strong> GPP was found at sever<strong>al</strong> European<br />
sites (e.g., Hesse, MonteBondone, Nonantola) (Fig. 3). Recent studies<br />
found increased fraction <strong>of</strong> diffuse radiation results in higher light use<br />
efficiencies <strong>of</strong> plant canopies (Alton <strong>et</strong> <strong>al</strong>., 2007; Gu <strong>et</strong> <strong>al</strong>., 2003)<br />
because increases in the blue/red light ratio may lead to higher<br />
photosynthesis rates per unit leaf area with diffuse radiation (Urban<br />
<strong>et</strong> <strong>al</strong>., 2007). Our results showed significantly higher proportion <strong>of</strong><br />
cloudy days (the ratio <strong>of</strong> gross radiation at the top <strong>of</strong> the canopy with<br />
its top-<strong>of</strong>-atmosphere is less than 0.5) in Europe (32±7%) compared<br />
with American and Asian sites (14±9%), which was likely a major<br />
cause for underestimation <strong>of</strong> GPP at sever<strong>al</strong> European sites.<br />
The EC-LUE model obviously overestimated GPP at sever<strong>al</strong> high<br />
latitude sites: Burn99, Uci1930, Uci1981, Uci1989 and Uci1998. For<br />
example, predicted GPP was higher than estimated GPP at Burn99<br />
with PE v<strong>al</strong>ues being 0.7 g C m − 2 day − 1 and RPE v<strong>al</strong>ues were 69%,<br />
respectively (Table 2). Mosses probably play an important role for<br />
quantifying GPP at the northern regions. Mosses are an important<br />
component <strong>of</strong> ecosystem at the high latitude regions, where they
W. <strong>Yuan</strong> <strong>et</strong> <strong>al</strong>. / <strong>Remote</strong> <strong>Sensing</strong> <strong>of</strong> <strong>Env</strong>ironment 114 (2010) 1416–1431<br />
1425<br />
Fig. 5. Variation in 8-day mean v<strong>al</strong>ue <strong>of</strong> predicted GPP and observed GPP at model c<strong>al</strong>ibration sites. The black solid lines represent the predicted GPP, and the open circle dots<br />
represent observed GPP.<br />
<strong>of</strong>ten dominate the ground cover. For example, at Burn99 site, in<br />
2002, 30% <strong>of</strong> the surface was covered by grasses and deciduous<br />
shrubs, and the remaining 70% <strong>of</strong> the surface was covered by moss<br />
(Liu & Randerson, 2008). The northern ecosystems are relatively<br />
open, due to the narrow canopy and low density <strong>of</strong> trees, which<br />
makes mosses an important contributor to the NDVI sign<strong>al</strong>. On the<br />
other hand, mosses are fundament<strong>al</strong>ly different from vascular plants<br />
with respect to veg<strong>et</strong>ation production. Field experiments showed<br />
significantly low light use efficiency in mosses, ranging from 10 to<br />
50% <strong>of</strong> that found in vascular plants (Whitehead & Gower, 2001).<br />
Therefore, high distribution and low photosynth<strong>et</strong>ic<strong>al</strong>ly capacity<br />
<strong>of</strong> mosses resulted in a significant overestimation <strong>of</strong> GPP at the high<br />
latitude ecosystems. Further improvement <strong>of</strong> the light use efficiency<br />
model needs to consider the function <strong>of</strong> mosses across the entire<br />
northern ecosystems.<br />
4.2. Glob<strong>al</strong> estimates <strong>of</strong> ET and GPP<br />
Although glob<strong>al</strong> v<strong>al</strong>idation <strong>of</strong> ET or GPP is problematic, we are able<br />
to investigate its reliability by comparison with other glob<strong>al</strong> models<br />
from the literature. Our estimate <strong>of</strong> annu<strong>al</strong> glob<strong>al</strong> mean ET was<br />
417 mm year −1 , which was comparable to other estimations. The<br />
comparison <strong>of</strong> 15-model simulation from the Glob<strong>al</strong> Soil W<strong>et</strong>ness<br />
Project-2 (GSWP-2; Dirmeyer <strong>et</strong> <strong>al</strong>., 2006) suggested that the annu<strong>al</strong><br />
ET ranges from 272 to 441 mm year − 1 . A glob<strong>al</strong> evapotranspiration<br />
estimation <strong>of</strong> ET by Fisher <strong>et</strong> <strong>al</strong>. (2008) showed 444 mm year − 1 using<br />
glob<strong>al</strong>ly consistent datas<strong>et</strong>s from the Internation<strong>al</strong> Satellite Land-<br />
Surface Climatology Project, Initiative II (ISLSCP-II) and the Advanced<br />
Very High Resolution Spectroradiom<strong>et</strong>er (AVHRR).<br />
The glob<strong>al</strong> magnitude <strong>of</strong> GPP agreed, in gener<strong>al</strong>, with results<br />
obtained by an increasing number <strong>of</strong> models (Cramer <strong>et</strong> <strong>al</strong>., 1999;
1426 W. <strong>Yuan</strong> <strong>et</strong> <strong>al</strong>. / <strong>Remote</strong> <strong>Sensing</strong> <strong>of</strong> <strong>Env</strong>ironment 114 (2010) 1416–1431<br />
Fig. 6. Variation in 8-day mean v<strong>al</strong>ue <strong>of</strong> predicted GPP and observed GPP at model v<strong>al</strong>idation sites. The black solid lines represent the predicted GPP, and the open circle dots<br />
represent observed GPP.<br />
Go<strong>et</strong>z <strong>et</strong> <strong>al</strong>., 2000). Comparison <strong>of</strong> 16 glob<strong>al</strong> NPP models showed a range<br />
<strong>of</strong> glob<strong>al</strong> NPP from 39.9 to 80 Pg C m −2 year −1 with a mean <strong>of</strong><br />
54.9 Pg C m − 2 year − 1 (Cramer <strong>et</strong> <strong>al</strong>., 1999). The EC-LUE model<br />
estimated glob<strong>al</strong> GPP at 110.5 Pg C year −1 , which f<strong>al</strong>ls in the range <strong>of</strong><br />
Cramer's representation (0.5 as ratio <strong>of</strong> NPP and GPP). The MODIS-GPP<br />
product (MOD17A) estimates glob<strong>al</strong> GPP at 113 Pg C. Fig. 12 showed
W. <strong>Yuan</strong> <strong>et</strong> <strong>al</strong>. / <strong>Remote</strong> <strong>Sensing</strong> <strong>of</strong> <strong>Env</strong>ironment 114 (2010) 1416–1431<br />
1427<br />
Fig. 7. Observed vs. the predicted GPP at the model c<strong>al</strong>ibration (a) and v<strong>al</strong>idation (b) sites in Table 1. The short dash lines are 1:1 line and the solid lines are linear regression line.<br />
Triangles in b indicate the data <strong>of</strong> four cropland sites, and short-dot–dot line is linear regression line after excluding the data <strong>of</strong> four cropland sites (y=0.84x, R 2 =0.62).<br />
these estimates aggregated for veg<strong>et</strong>ation types. On a biome basis, the<br />
EC-LUE model had good agreement in its representation <strong>of</strong> MODIS-GPP.<br />
The accuracy <strong>of</strong> glob<strong>al</strong> estimates in ET and GPP are highly<br />
dependent on the glob<strong>al</strong> m<strong>et</strong>eorology datas<strong>et</strong>. The accuracy <strong>of</strong> the<br />
existing m<strong>et</strong>eorologic<strong>al</strong> rean<strong>al</strong>ysis data s<strong>et</strong>s showed marked differences<br />
both spati<strong>al</strong>ly and tempor<strong>al</strong>ly. Zhao <strong>et</strong> <strong>al</strong>. (2006) compared<br />
surface m<strong>et</strong>eorologic<strong>al</strong> datas<strong>et</strong>s from three well-documented glob<strong>al</strong><br />
rean<strong>al</strong>yses: DAO (NASA Data Assimilation Office), ECMWF (European<br />
Centre for Medium-Range Weather Forecasts), and NCEP/NCAR<br />
(Nation<strong>al</strong> Centers for <strong>Env</strong>ironment<strong>al</strong> Prediction/Nation<strong>al</strong> Center for<br />
Atmospheric Research rean<strong>al</strong>ysis) with observed weather station<br />
data. The results showed NCEP tends to overestimate surface solar<br />
radiation, and underestimate both temperature and vapor pressure<br />
deficit (VPD). ECMWF has the highest accuracy, but its radiation is<br />
lower in tropic<strong>al</strong> regions, and the accuracy <strong>of</strong> DAO lies b<strong>et</strong>ween NCEP<br />
and ECMWF. Glob<strong>al</strong> MODIS-GPP driven by DAO, ECMWF, and NCEP<br />
displayed notable differences (N20 Pg C m − 2 year − 1 ). In this study,<br />
MERRA tended to underestimate surface n<strong>et</strong> radiation (Fig. 13), which<br />
resulted in lower predicted ET and GPP. Our results reve<strong>al</strong>ed that the<br />
Fig. 8. Comparison <strong>of</strong> annu<strong>al</strong> mean GPP observations from the flux tower sites and the<br />
ET estimates by the revised EC-LUE model. These data were created using (a) towerspecific<br />
m<strong>et</strong>eorology (y =0.77x+0.64, R 2 =0.81) and (b) the glob<strong>al</strong> MERRA m<strong>et</strong>eorology<br />
(y=0.59x+0.73, R 2 =0.67).<br />
biases in m<strong>et</strong>eorologic<strong>al</strong> rean<strong>al</strong>ysis can introduce substanti<strong>al</strong> errors<br />
into GPP and ET estimations, and emphasize the need to minimize<br />
these biases to improve the qu<strong>al</strong>ity <strong>of</strong> GPP and ET products. In<br />
addition, due to the complex terrain and resulting h<strong>et</strong>erogeneity <strong>of</strong><br />
the landscape surrounding flux towers, model biases resulted in part<br />
by upsc<strong>al</strong>ing from flux tower to the larger 0.5°×0.6° area. The<br />
comparison <strong>of</strong> observed ET or GPP with the estimated using MERRA<br />
datas<strong>et</strong> across <strong>al</strong>l 54 sites may introduce uncertainties due to the<br />
differences in tower footprints and under varying environment<strong>al</strong><br />
conditions for a given tower.<br />
4.3. Model advantages and limitations<br />
A broad range <strong>of</strong> models exist now, and they are being used to<br />
investigate the magnitude and geographic<strong>al</strong> distributions <strong>of</strong> carbon<br />
and water fluxes at a glob<strong>al</strong> sc<strong>al</strong>e (Brisson <strong>et</strong> <strong>al</strong>., 1998; Foley <strong>et</strong> <strong>al</strong>.,<br />
1996; Potter <strong>et</strong> <strong>al</strong>., 1993; Running <strong>et</strong> <strong>al</strong>., 2000). Many models are now<br />
being compared to d<strong>et</strong>ailed biophysic<strong>al</strong> measurements obtained at<br />
individu<strong>al</strong> field sites. However, for glob<strong>al</strong>- and region<strong>al</strong>-sc<strong>al</strong>e<br />
ecosystem models, it is necessary to make these comparisons at<br />
various geographic<strong>al</strong> regions for accurate quantification <strong>of</strong> tempor<strong>al</strong><br />
and spati<strong>al</strong> variations in veg<strong>et</strong>ation production (Delire & Foley, 1999).<br />
In this study, 54 eddy covariance towers were included to c<strong>al</strong>ibrate<br />
and v<strong>al</strong>idate the models, which confirmed the accuracy and<br />
applicability <strong>of</strong> the EC-LUE and revised RS-PM models across wide<br />
range <strong>of</strong> climate and ecosystem types.<br />
Param<strong>et</strong>erization is critic<strong>al</strong> for glob<strong>al</strong> simulation <strong>of</strong> carbon and<br />
water fluxes, and directly d<strong>et</strong>ermines the model performance. For<br />
example, <strong>al</strong>though PLAI (Potsdam Land Atmosphere Interaction<br />
Model, Plőchl & Cramer, 1995) uses the same function<strong>al</strong> formulations<br />
for simulating veg<strong>et</strong>ation production as FBM (Frankfurt Biosphere<br />
Model, Kindermann <strong>et</strong> <strong>al</strong>., 1993), the season<strong>al</strong> and spati<strong>al</strong> distribution<br />
<strong>of</strong> veg<strong>et</strong>ation production estimated by PLAI is different from FBM due<br />
to differences in param<strong>et</strong>erization and veg<strong>et</strong>ation classification<br />
schemes (Kicklighter <strong>et</strong> <strong>al</strong>., 1999). However, region<strong>al</strong> param<strong>et</strong>erization<br />
<strong>of</strong> ecosystem models probably presents the most difficult task for<br />
estimating water and carbon fluxes. The light use efficiency (LUE)<br />
model may have the most potenti<strong>al</strong> to successfully solve the problems<br />
because <strong>of</strong> its theor<strong>et</strong>ic<strong>al</strong> basis (Running <strong>et</strong> <strong>al</strong>., 2000). Potenti<strong>al</strong> light<br />
use efficiencies in light use efficiency models are theor<strong>et</strong>ic<strong>al</strong>ly<br />
consistent in various veg<strong>et</strong>ation types (Monteith, 1972, 1977), except<br />
the difference b<strong>et</strong>ween C 4 and C 3 veg<strong>et</strong>ation types. Most light use<br />
efficiency models, however, did not achieve this assumption because<br />
they failed to develop the uniform environment<strong>al</strong> constraint equations<br />
to LUE among the various ecosystems. The EC-LUE model
1428 W. <strong>Yuan</strong> <strong>et</strong> <strong>al</strong>. / <strong>Remote</strong> <strong>Sensing</strong> <strong>of</strong> <strong>Env</strong>ironment 114 (2010) 1416–1431<br />
Fig. 9. Glob<strong>al</strong> evapotranspiration (ET) driven by interpolated 0.5°×0.6° MERRA m<strong>et</strong>eorologic<strong>al</strong> data and MODIS data averaged from 2000 to 2003.<br />
Fig. 10. Glob<strong>al</strong> GPP driven by interpolated 0.5° ×0.6° MERRA m<strong>et</strong>eorologic<strong>al</strong> data and MODIS data averaged from 2000 to 2003.<br />
successfully generated invariant potenti<strong>al</strong> light use efficiency with<br />
veg<strong>et</strong>ation types by using the gener<strong>al</strong> water and temperature<br />
constrains equations to downsc<strong>al</strong>e potenti<strong>al</strong> light use efficiency.<br />
Uniform model param<strong>et</strong>ers <strong>of</strong> the EC-LUE model across the various<br />
ecosystem types and geographic<strong>al</strong> regions produced many benefits to<br />
map GPP over large areas with high accuracy and applicability<br />
avoiding region<strong>al</strong> model param<strong>et</strong>erization.<br />
The EC-LUE and revised RS-PM models based on remote sensing<br />
data have a relatively strong potenti<strong>al</strong> to an<strong>al</strong>yze tempor<strong>al</strong> changes.<br />
Without addition<strong>al</strong> <strong>al</strong>gorithms for simulating changes in NDVI under<br />
<strong>al</strong>tered conditions, however, these two models have limited use for<br />
climate- or veg<strong>et</strong>ation-change scenarios. Extensions and improvements<br />
in the satellite record will serve to enhance remote sensing's<br />
usefulness for d<strong>et</strong>ecting and quantifying glob<strong>al</strong> change.<br />
Acknowledgements<br />
We acknowledge the financi<strong>al</strong> support from Nation<strong>al</strong> Key Basic<br />
Research and Development Plan <strong>of</strong> China (2010CB800504 and<br />
2009AA122101) and the Glob<strong>al</strong> Modeling and Assimilation Office.
W. <strong>Yuan</strong> <strong>et</strong> <strong>al</strong>. / <strong>Remote</strong> <strong>Sensing</strong> <strong>of</strong> <strong>Env</strong>ironment 114 (2010) 1416–1431<br />
1429<br />
Fig. 11. Simulations <strong>of</strong> EC-LUE model at the four croplands using different param<strong>et</strong>er v<strong>al</strong>ues for C 3 and C 4 crops. Meadirrigated site was planted with continuous maize. Other three<br />
sites were planted with maize–soybean rotation, and “C 3 ” and “C 4 ” were used to indicate maize and soybean crops respectively.<br />
Fig. 12. Comparison <strong>of</strong> EC-LUE and MODIS-GPP product at the various ecosystem types.<br />
ENF: evergreen needleleaf forest; EBF: evergreen broadleaf forest; DNF: deciduous<br />
needleleaf forest; DBF: deciduous broadleaf forest; MIX: mixed forest <strong>of</strong> DBF and ENF;<br />
CSH: closed shrubland; OSH: open shrubland; WSA: woody savanna; SAV: savanna;<br />
GRS: grassland; CRP: cropland.<br />
Fig. 13. Correlation <strong>of</strong> n<strong>et</strong> radiaton (R n ) b<strong>et</strong>ween EC tower and MERRA datas<strong>et</strong>.<br />
References<br />
Alton, P. B., North, P. R., & Los, S. O. (2007). The impact <strong>of</strong> diffuse sunlight on canopy<br />
light-use efficiency gross photosynth<strong>et</strong>ic product and n<strong>et</strong> ecosystem exchange in<br />
three forest biomes. Glob<strong>al</strong> Change Biology, 13, 1−12.<br />
Anthoni, P. M., Knohl, A., Rebmann, C., Freibauer, A., Mund, M., Ziegler, W., <strong>et</strong> <strong>al</strong>. (2004).<br />
Forest and agricultur<strong>al</strong> land-use-dependent CO 2 exchange in Thuringia, Germany.<br />
Glob<strong>al</strong> Change Biology, 10, 2005−2019.<br />
B<strong>al</strong>docchi, D. D., V<strong>al</strong>entini, R., Running, S. R., Oechel, W., & Dahlman, R. (1996).<br />
Strategies for measuring and modelling CO 2 and water vapor fluxes over terrestri<strong>al</strong><br />
ecosystems. Glob<strong>al</strong> Change Biology, 2, 159−168.<br />
Battle, M., Fl<strong>et</strong>cher, S. M., Bender, M. L., Keeling, R. F., Manning, A. C., Gruber, N., <strong>et</strong> <strong>al</strong>.<br />
(2006). Atmospheric potenti<strong>al</strong> oxygen: New observations and their implications<br />
for some atmospheric and oceanic models.Glob<strong>al</strong> Biogeochemic<strong>al</strong> Cycles, 20 B1010-<br />
1-B1010-15.<br />
Berbigier, P., Bonnefond, J. M., & Mellmann, P. (2001). CO 2 and water vapour fluxes for<br />
2 years above Eur<strong>of</strong>lux forest site. Agricultur<strong>al</strong> and Forest M<strong>et</strong>eorology, 108,<br />
183−197.<br />
Beringer, J., Chapin, F. S., Thompson, C. C., & McGuire, A. D. (2005). Surface energy<br />
exchanges <strong>al</strong>ong a tundra–forest transition and feedbacks to climate. Agricultur<strong>al</strong><br />
and Forest M<strong>et</strong>eorology, 131, 143−161.<br />
B<strong>et</strong>ts, A. K., & B<strong>al</strong>l, J. H. (1997). Albedo over the bore<strong>al</strong> forest. Journ<strong>al</strong> Geophysic<strong>al</strong><br />
Research, 102, 28,901−28,909.<br />
Bousqu<strong>et</strong>, P., Peylin, P., Ciais, P., LeQuere, C., Friedlingstein, P., & Tans, P. (2000).<br />
Region<strong>al</strong> changes in carbon dioxide fluxes <strong>of</strong> land and oceans since 1980. Science,<br />
290, 1342−1346.<br />
Brisson, N., Itier, B., L'Hotel, J. C., & Lorendeau, J. Y. (1998). Param<strong>et</strong>erization <strong>of</strong> the<br />
Shuttleworth–W<strong>al</strong>lace model to estimate daily maximum transpiration for use in<br />
crop models. Ecologic<strong>al</strong> Modelling, 107, 159−169.<br />
Canadell, J. G., Pataki, D., Gifford, R., Houghton, R., Luo, Y., Raupach, M., <strong>et</strong> <strong>al</strong>. (2007).<br />
Saturation <strong>of</strong> the terrestri<strong>al</strong> carbon sink. In J. G. Canadell, D. Pataki, & L. Pitelka<br />
(Eds.), Terrestri<strong>al</strong> ecosystems in a changing worldIGBP Series. (pp. 81−100) Berlin:<br />
Springer.<br />
Cao, M. K., & Woodward, F. I. (1998). N<strong>et</strong> primary and ecosystem production and carbon<br />
stocks <strong>of</strong> terrestri<strong>al</strong> ecosystems and their responses to climate change. Glob<strong>al</strong><br />
Change Biology, 4, 185−198.<br />
Chen, J. Q., F<strong>al</strong>k, M., Euskirchen, E., Paw, K. T. U., Suchanek, T. H., Ustin, S. L., <strong>et</strong> <strong>al</strong>. (2002).<br />
Biophysic<strong>al</strong> controls <strong>of</strong> carbon flows in three succession<strong>al</strong> Douglas-fir stands based<br />
on eddy-covariance measurements. Tree Physiology, 22, 169−177.<br />
Cleugh, H. A., Leuning, R., Mu, Q., & Running, S. W. (2007). Region<strong>al</strong> evaporation<br />
estimates from flux tower and MODIS satellite data. <strong>Remote</strong> <strong>Sensing</strong> <strong>of</strong> <strong>Env</strong>ironment,<br />
106, 285−304.<br />
Cook, B. D., Davis, K. J., Wang, W., Desai, A. R., Berger, B. W., Teclaw, R. M., <strong>et</strong> <strong>al</strong>. (2004).<br />
Carbon exchange and venting anom<strong>al</strong>ies in an upland deciduous forest in northern<br />
Wisconsin, USA. Agricultur<strong>al</strong> and Forest M<strong>et</strong>eorology, 126, 271−295.<br />
Cramer, W., Bondeau, A., Moore, B., Churkina, C., Nemry, B., Ruimy, A., <strong>et</strong> <strong>al</strong>. (1999).<br />
Comparing glob<strong>al</strong> models <strong>of</strong> terrestri<strong>al</strong> n<strong>et</strong> primary productivity (NPP): Overview<br />
and key results. Glob<strong>al</strong> Change Biology, 5, 1−15.<br />
Curtis, P. S., Vogel, C. S., Gough, C. M., Schmid, H. P., Su, H. B., & Bovard, B. D. (2005).<br />
Respiratory carbon losses and the carbon use efficiency <strong>of</strong> a northern hardwood<br />
forest, 1999–2003. New Phytologist, 167, 437−456.<br />
Delire, C., & Foley, J. A. (1999). Ev<strong>al</strong>uating the performance <strong>of</strong> a land surface/ecosystem<br />
model with biophysic<strong>al</strong> measurements from contrasting environments. Journ<strong>al</strong> <strong>of</strong><br />
Geophysic<strong>al</strong> Research, 104, 16,895−16,909.<br />
Desai, A. R., Bolstad, P. V., Cook, B. D., Davis, K. J., & Carey, E. V. (2005). Comparing n<strong>et</strong><br />
ecosystem exchange <strong>of</strong> carbon dioxide b<strong>et</strong>ween an old-growth and mature forest<br />
in the upper Midwest, USA. Agricultur<strong>al</strong> and Forest M<strong>et</strong>eorology, 128, 33−55.<br />
Dirmeyer, P. A. (1994). Veg<strong>et</strong>ation stress as a feedback mechanism in mid-latitude<br />
drought. Journ<strong>al</strong> <strong>of</strong> Climate, 7, 1463−1483.<br />
Dirmeyer, P. A., Gao, X., Zhao, M., Guo, Z., Oki, T., & Hanasaki, N. (2006). GSWP-2:<br />
Multimodel an<strong>al</strong>ysis and implications for our perception <strong>of</strong> the land surface.<br />
Bull<strong>et</strong>in <strong>of</strong> the American M<strong>et</strong>eorologic<strong>al</strong> Soci<strong>et</strong>y, 87, 1381−1397.<br />
Dunn, A. L., Barford, C. C., W<strong>of</strong>sy, S. C., Goulden, M. L., & Daube, B. C. (2007). A long-term<br />
record <strong>of</strong> carbon exchange in a bore<strong>al</strong> black spruce forest: Means, responses to<br />
interannu<strong>al</strong> variability, and decad<strong>al</strong> trends. Glob<strong>al</strong> Change Biology, 13, 577−590.<br />
F<strong>al</strong>ge, E., B<strong>al</strong>docchi, D., Olson, R., Anthoni, P., Aubin<strong>et</strong>, M., Bernh<strong>of</strong>er, C., <strong>et</strong> <strong>al</strong>. (2001).<br />
Gap filling strategies for defensible annu<strong>al</strong> sums <strong>of</strong> n<strong>et</strong> ecosystem exchange.<br />
Agricultur<strong>al</strong> and Forest M<strong>et</strong>eorology, 107, 43−69.<br />
Fiora, A., & Cescatti, A. (2006). Diurn<strong>al</strong> and season<strong>al</strong> variability in radi<strong>al</strong> distribution <strong>of</strong><br />
sap flux density: Implications for the estimates <strong>of</strong> stand transpiration. Tree<br />
Physiology, 26, 1217−1225.<br />
Fisher, J. B., Tu, K. P., & B<strong>al</strong>docchi, D. D. (2008). Glob<strong>al</strong> estimates <strong>of</strong> the land–atmosphere<br />
water flux based on monthly AVHRR and ISLSCP-II data, v<strong>al</strong>idated at 16 FLUXNET<br />
sites. <strong>Remote</strong> <strong>Sensing</strong> <strong>of</strong> <strong>Env</strong>ironment, 112, 901−919.
1430 W. <strong>Yuan</strong> <strong>et</strong> <strong>al</strong>. / <strong>Remote</strong> <strong>Sensing</strong> <strong>of</strong> <strong>Env</strong>ironment 114 (2010) 1416–1431<br />
Flanagan, L. B., & Johnson, B. G. (2005). Interacting effects <strong>of</strong> temperature, soil moisture<br />
and plant biomass production on ecosystem respiration in a northern temperate<br />
grassland. Agricultur<strong>al</strong> and Forest M<strong>et</strong>eorology, 130, 237−253.<br />
Foley, J. A., Prentice, I. C., Ramankutty, N., Levis, S., Pollard, D., Sitch, S., <strong>et</strong> <strong>al</strong>. (1996). An<br />
integrated biosphere model <strong>of</strong> land surface processes, terrestri<strong>al</strong> carbon b<strong>al</strong>ance,<br />
and veg<strong>et</strong>ation dynamics. Glob<strong>al</strong> Biogeochemic<strong>al</strong> Cycles, 10, 603−628.<br />
Foroutan-Pour, K., Dutilleul, P., & Smith, D. L. (2001). Inclusion <strong>of</strong> the fract<strong>al</strong> dimension<br />
<strong>of</strong> leafless plant structure in the Beer–Lambert Law. Agronomy Journ<strong>al</strong>, 93,<br />
333−338.<br />
Friedl, M. A. (1996). Relationships among remotely sensed data, surface energy b<strong>al</strong>ance,<br />
and area-averaged fluxes over parti<strong>al</strong>ly veg<strong>et</strong>ated land surfaces. Journ<strong>al</strong> <strong>of</strong> Applied<br />
M<strong>et</strong>eorology, 35, 2091−2103.<br />
Friend, A. D., Arn<strong>et</strong>h, A., Kiang, N. Y., Lomas, M., Ogee, J., Rodenbeck, C., <strong>et</strong> <strong>al</strong>. (2007).<br />
FLUXNET and modelling the glob<strong>al</strong> carbon cycle. Glob<strong>al</strong> Change Biology, 13,<br />
610−633.<br />
Gash, J. H. C. (1987). An an<strong>al</strong>ytic<strong>al</strong> framework for extrapolating evaporation<br />
measurements by remote sensing surface temperature. Internation<strong>al</strong> Journ<strong>al</strong> <strong>of</strong><br />
<strong>Remote</strong> <strong>Sensing</strong>, 8, 1245−1249.<br />
Gholz, H. L., & Clark, K. L. (2002). Energy exchange across a chronosequence <strong>of</strong> slash<br />
pine forests in Florida. Agricultur<strong>al</strong> and Forest M<strong>et</strong>eorology, 112, 87−102.<br />
Gholz, H. L., Vogel, S. A., Cropper, W. P., Jr., McKelvey, K., Ewel, K. C., Teskey, R. O., <strong>et</strong> <strong>al</strong>.<br />
(1991). Dynamics <strong>of</strong> canopy structure and light interception in Pinus elliottii stands<br />
<strong>of</strong> north Florida. Ecologic<strong>al</strong> Monograph, 61, 33−51.<br />
Glob<strong>al</strong> Modeling and Assimilation Office (2004). File specification for GEOSDAS gridded<br />
output version 5.3, report. Greenbelt, Md: NASA Goddard Space Flight Cent.<br />
Go<strong>et</strong>z, S. J., Prince, S. D., Sm<strong>al</strong>l, J., & Gleason, C. R. (2000). Interannu<strong>al</strong> variability <strong>of</strong> glob<strong>al</strong><br />
terrestri<strong>al</strong> primary production: Results <strong>of</strong> a model driven with satellite observations.<br />
Journ<strong>al</strong> <strong>of</strong> Geophysic<strong>al</strong> Research, 105, 20,077−20,091.<br />
Goldstein, A. H., Hultman, N. E., Fracheboud, J. M., Bauer, M. R., Panek, J. A., Xu, M., <strong>et</strong> <strong>al</strong>.<br />
(2000). Effects <strong>of</strong> climate variability on the carbon dioxide, water, and sensible heat<br />
fluxes above a ponderosa pine plantation in the Sierra Nevada (CA). Agricultur<strong>al</strong><br />
and Forest M<strong>et</strong>eorology, 101, 113−129.<br />
Goulden, M. L., Winston, G. C., McMillan, A. M. S., Litvak, M. E., Read, E. L., Rocha, A. V.,<br />
<strong>et</strong> <strong>al</strong>. (2006). An eddy covariance meson<strong>et</strong> to measure the effect <strong>of</strong> forest age on<br />
land–atmosphere exchange. Glob<strong>al</strong> Change Biology, 12, 2146−2162.<br />
Granier, A., Ceschia, C., Damesin, C., Dufrene, E., & Epron, D. (2000). The carbon b<strong>al</strong>ance<br />
<strong>of</strong> a young Beech forest. Function<strong>al</strong> Ecology, 14, 312−325.<br />
Griffis, T. J., Black, T. A., Morgenstern, K., Barr, A. G., Nesic, Z., Drewitt, G. B., <strong>et</strong> <strong>al</strong>. (2003).<br />
Ecophysiologic<strong>al</strong> controls on the carbon b<strong>al</strong>ances <strong>of</strong> three southern bore<strong>al</strong> forests.<br />
Agricultur<strong>al</strong> and Forest M<strong>et</strong>eorology, 117, 53−71.<br />
Grünw<strong>al</strong>d, T., & Berh<strong>of</strong>er, C. (2007). A decade <strong>of</strong> carbon, water and energy flux<br />
measurements <strong>of</strong> an old spruce forest at the Anchor Station Tharandt. Tellus, 59B,<br />
387−396.<br />
Gu, L. H., B<strong>al</strong>docchi, D. D., W<strong>of</strong>sy, S. C., Munger, J. W., Mich<strong>al</strong>sky, J. J., Urbanski, S. P., <strong>et</strong> <strong>al</strong>.<br />
(2003). Response <strong>of</strong> a deciduous forest to the Mount Pinatubo Eruption: Enhanced<br />
photosynthesis. Science, 299, 2035−2038.<br />
Hollinger, D. Y., Aber, J., Dail, B., Davidson, E. A., Goltz, S. M., Hughes, H., <strong>et</strong> <strong>al</strong>. (2004).<br />
Spati<strong>al</strong> and tempor<strong>al</strong> variability in forest–atmosphere CO 2 exchange. Glob<strong>al</strong> Change<br />
Biology, 10, 1689−1706.<br />
June, T., Evans, J. R., & Farquhar, G. D. (2004). A simple new equation for the reversible<br />
temperature dependence <strong>of</strong> photosynth<strong>et</strong>ic electron transport: A study on soybean<br />
leaf. Function<strong>al</strong> Plant Biology, 31, 275−283.<br />
Keane, R. E., Ryan, K. C., Veblen, T. T., Allen, C. D., Logan, J., & Hawkes, B. (2002).<br />
Cascading effects <strong>of</strong> fire exclusion in Rocky Mountain ecosystems: A literature<br />
review. USDA forest service gen. tech. report RMRS-GTR-91 (24 pp.).<br />
Kicklighter, D. W., Bondeau, A., Schloss, A. L., Kaduk, J., & Mcguire, A. D.the Participants<br />
<strong>of</strong> the Potsdam NPP model intercomparison. (1999). Comparing glob<strong>al</strong> models <strong>of</strong><br />
terrestri<strong>al</strong> n<strong>et</strong> primary productivity (NPP): Glob<strong>al</strong> pattern and differentiation by<br />
major biomes. Glob<strong>al</strong> Change Biology, 5, 16−24.<br />
Kindermann, J., Lüdeke, M. K. B., Badeck, F. W., Otto, R. D., Klaudius, A., Häger, C. H., <strong>et</strong> <strong>al</strong>.<br />
(1993). Structure <strong>of</strong> a glob<strong>al</strong> and season<strong>al</strong> carbon exchange model for the terrestri<strong>al</strong><br />
biosphere: The Frankfurt Biosphere Model (FBM). Water, Air and Soil Pollution, 70,<br />
675−684.<br />
Knohl, A., Schulze, E. D., Kolle, O., & Buchmann, N. (2003). Large carbon uptake by an<br />
unmanaged 250-year-old deciduous forest in Centr<strong>al</strong> Germany. Agricultur<strong>al</strong> and<br />
Forest M<strong>et</strong>eorology, 118, 151−167.<br />
Kustas, W. P., & Norman, J. M. (1996). Use <strong>of</strong> remote sensing for evapotranspiration<br />
monitoring over land surfaces. Hydrologic<strong>al</strong> Sciences, 41, 495−516.<br />
Landsberg, J. J. (1986). Physiologic<strong>al</strong> ecology <strong>of</strong> forest production (pp. 165−178). London:<br />
Academic Press.<br />
Law, B. E., Turner, D., Campbell, J., Sun, O. J., Tuyl, S. V., Ritts, W. D., <strong>et</strong> <strong>al</strong>. (2004).<br />
Disturbance and climate effects on carbon stocks and fluxes across Western Oregon<br />
USA. Glob<strong>al</strong> Change Biology, 10, 1429−1444.<br />
Law, B. E., Williams, M., Anthoni, P. M., B<strong>al</strong>docchi, D. D., & Unsworth, M. H. (2000).<br />
Measuring and modelling season<strong>al</strong> variation <strong>of</strong> carbon dioxide and water vapour<br />
exchange <strong>of</strong> a Pinus ponderosa forest subject to soil water deficit. Glob<strong>al</strong> Change<br />
Biology, 6, 613−630.<br />
L<strong>et</strong>tenmaier, D. P., & Famigli<strong>et</strong>ti, J. S. (2006). Water from on high. Nature, 444, 562−563.<br />
Liu, H. P., & Randerson, J. T. (2008). Interannu<strong>al</strong> variability <strong>of</strong> surface energy exchange<br />
depends on stand age in a bore<strong>al</strong> forest fire chronosequence. Journ<strong>al</strong> <strong>of</strong> Geophysic<strong>al</strong><br />
Research, 13, G01006, doi:10.1029/2007JG000483.<br />
Lloyd, J., & Taylor, J. A. (1994). On the temperature dependence <strong>of</strong> soil respiration.<br />
Function<strong>al</strong> Ecology, 8, 315−323.<br />
Ma, S., B<strong>al</strong>docchi, D. D., Xu, L., & Hehn, T. (2007). Inter-annu<strong>al</strong> variability in carbon<br />
dioxide exchange <strong>of</strong> an oak/grass savanna and open grassland in C<strong>al</strong>ifornia.<br />
Agricultur<strong>al</strong> and Forest M<strong>et</strong>eorology, 147, 157−171.<br />
Marcolla, B., & Cescatti, A. (2005). Experiment<strong>al</strong> an<strong>al</strong>ysis <strong>of</strong> flux footprint for varying<br />
stability conditions in an <strong>al</strong>pine meadow. Agricultur<strong>al</strong> and Forest M<strong>et</strong>eorology, 135,<br />
291−301.<br />
Mayocchi, C. L., & Bristow, K. L. (1995). Soil surface heat flux: some gener<strong>al</strong> questions<br />
and comments on measurements. Agricultur<strong>al</strong> and Forest M<strong>et</strong>eorology, 75, 43−50.<br />
McVicar, T. R., & Jupp, D. L. B. (1998). The current and potenti<strong>al</strong> operation<strong>al</strong> uses <strong>of</strong><br />
remote sensing to aid decisions on drought exception<strong>al</strong> circumstances in Austr<strong>al</strong>ia:<br />
A review. Agricultur<strong>al</strong> Systems, 57, 399−468.<br />
Meyer, W. (1999). Standard reference evaporation c<strong>al</strong>culation for inland, south eastern<br />
Austr<strong>al</strong>ia. Technic<strong>al</strong> report, 35/98,Adelaide, South Austr<strong>al</strong>ia: CSIRO Land and Water.<br />
Meyers, T. P. (2001). A comparison <strong>of</strong> summertime water and CO 2 fluxes over<br />
rangeland for well watered and drought conditions. Agricultur<strong>al</strong> and Forest<br />
M<strong>et</strong>eorology, 106, 205−214.<br />
Meyers, T. P., & Hollinger, S. E. (2004). An assessment <strong>of</strong> storage terms in the surface<br />
energy b<strong>al</strong>ance <strong>of</strong> maize and soybean. Agricultur<strong>al</strong> and Forest M<strong>et</strong>eorology, 125,<br />
105−115.<br />
Migliavacca, M., Meroni, M., Bus<strong>et</strong>to, L., Colombo, R., Zenone, T., Matteucci, G., <strong>et</strong> <strong>al</strong>.<br />
(2009). Modeling gross primary production <strong>of</strong> agro-forestry ecosystems by<br />
assimilation <strong>of</strong> satellite derived information in a process-based model. Sensors, 9,<br />
922−942.<br />
Monsi, M., & Saeki, T. (1953). Über den Lichtfaktor in den Pflanzengesellschaften und<br />
seine Bedeutung für die St<strong>of</strong>fproduktion. Japanese Journ<strong>al</strong> <strong>of</strong> Botany, 14, 22−52.<br />
Monson, R. K., Sparks, J. P., Rosenstiel, T. N., Scott-Denton, L. E., Huxman, T. E., Harley, P. C.,<br />
<strong>et</strong> <strong>al</strong>. (2005). Climatic influences on n<strong>et</strong> ecosystem CO 2 exchange during the<br />
transition from wintertime carbon source to springtime carbon sink in a highelevation,<br />
sub<strong>al</strong>pine forest. Oecologia, 146, 130−147.<br />
Monteith, J. L. (1972). Solar radiation and productivity in tropic<strong>al</strong> ecosystems. Journ<strong>al</strong> <strong>of</strong><br />
Applied Ecology, 9, 747−766.<br />
Monteith, J. L. (1977). Climate and the efficiency <strong>of</strong> crop production in Britain.<br />
Philosophic<strong>al</strong> Transactions <strong>of</strong> the Roy<strong>al</strong> Soci<strong>et</strong>y <strong>of</strong> London, 281, 277−294.<br />
Mu, Q. Z., Heinsch, F. A., Zhao, M. S., & Running, S. W. (2007). Development <strong>of</strong> a glob<strong>al</strong><br />
evapotranspiration <strong>al</strong>gorithm based on MODIS and glob<strong>al</strong> m<strong>et</strong>eorology data.<br />
<strong>Remote</strong> <strong>Sensing</strong> <strong>of</strong> <strong>Env</strong>ironment, 111, 519−536.<br />
Noorm<strong>et</strong>s, A., Chen, J. Q., & Crow, T. R. (2007). Age-dependent changes in ecosystem<br />
carbon fluxes in managed forests in Northern Wisconsin, USA. Ecosystems, 10,<br />
1432−9840.<br />
Novick, K. A., Stoy, P. C., Katul, G. G., Ellsworth, D. S., Siqueira, D. S., Juang, J., <strong>et</strong> <strong>al</strong>. (2004).<br />
Carbon dioxide and water vapor exchange in a warm temperate grassland.<br />
Oecologia, 138, 259−274.<br />
Pap<strong>al</strong>e, D., Reichstein, M., Aubin<strong>et</strong>, M., Canfora, E., Bernh<strong>of</strong>er, C., Kutsch, W., <strong>et</strong> <strong>al</strong>.<br />
(2006). Towards a standardized processing <strong>of</strong> N<strong>et</strong> Ecosystem Exchange measured<br />
with eddy covariance technique: Algorithms and uncertainty estimation. Biogeosciences,<br />
3, 571−583.<br />
Pataki, D. E., & Oren, R. (2003). Species differences in stomat<strong>al</strong> control <strong>of</strong> water loss at<br />
the canopy sc<strong>al</strong>e in a mature bottomland deciduous forest. Advances in Water<br />
Resources, 26, 1267−1278.<br />
Paw, U. K. T., F<strong>al</strong>k, M., Suchanek, T. H., Ustin, S. L., Chen, J. Q., Park, Y. S., <strong>et</strong> <strong>al</strong>. (2004).<br />
Carbon dioxide exchange b<strong>et</strong>ween an old-growth forest and the atmosphere.<br />
Ecosystems, 7, 513−524.<br />
Pielke, R. S., Sr., Avissar, R., Raupach, M., Dolman, A. J., Zeng, X., & Denning, A. S. (1998).<br />
Interactions b<strong>et</strong>ween the atmosphere and terrestri<strong>al</strong> ecosystems: Influence on<br />
weather and climate. Glob<strong>al</strong> Change Biology, 4, 461−475.<br />
Plőchl, M., & Cramer, W. (1995). Coupling glob<strong>al</strong> models <strong>of</strong> veg<strong>et</strong>ation structure and<br />
ecosystem processes an example from arctic and bore<strong>al</strong> ecosystems. Tellus(B), 47,<br />
240−250.<br />
Potter, C. B., Randerson, J. T., Field, C. B., Matson, P. A., Vitousek, P. M., Mooney, H. A.,<br />
<strong>et</strong> <strong>al</strong>. (1993). Terrestri<strong>al</strong> ecosystem production: A process model based on glob<strong>al</strong><br />
satellite and surface data. Glob<strong>al</strong> Biogeochemistry Cycle, 7, 811−841.<br />
Ramb<strong>al</strong>, S., J<strong>of</strong>fre, R., Ourciv<strong>al</strong>, J. M., Cavender-Bares, J., & Roch<strong>et</strong>eau, A. (2004). The<br />
growth respiration component in eddy CO 2 flux from a Quercusilex Mediterranean<br />
forest. Glob<strong>al</strong> Change Biology, 10, 1460−1469.<br />
Raupach, M. R. (2001). Combination theory and equilibrium evaporation. Quarterly<br />
Journ<strong>al</strong> <strong>of</strong> the Roy<strong>al</strong> M<strong>et</strong>eorologic<strong>al</strong> Soci<strong>et</strong>y, 127, 1149−1181.<br />
Reichstein, M., F<strong>al</strong>ge, E., B<strong>al</strong>docchi, D., Pap<strong>al</strong>e, D., Aubin<strong>et</strong>, M., Berbigier, P., <strong>et</strong> <strong>al</strong>. (2005). On<br />
the separation <strong>of</strong> n<strong>et</strong> ecosystem exchange into assimilation and ecosystem<br />
respiration: Review and improved <strong>al</strong>gorithm. Glob<strong>al</strong> Change Biology, 11, 1424−1439.<br />
Ruimy, A., Kergoat, L., & Bondeau, A.the Participants <strong>of</strong> the Potsdam NPP model<br />
intercomparison. (1999). Comparing glob<strong>al</strong> models <strong>of</strong> terrestri<strong>al</strong> n<strong>et</strong> primary<br />
productivity (NPP): an<strong>al</strong>ysis <strong>of</strong> differences in light absorption and light-use<br />
efficiency. Glob<strong>al</strong> Change Biology, 5, 56−64.<br />
Running, S. W., Nemani, R. R., Heinsch, F. A., Zhao, M. S., Reeves, M., & Hashimoto, H.<br />
(2004). A continuous satellite-derived measure <strong>of</strong> glob<strong>al</strong> terrestri<strong>al</strong> primary<br />
production. Bioscience, 54, 547−560.<br />
Running, S. W., Thornton, P. E., Nemani, R., & Glassy, J. M. (2000). Glob<strong>al</strong> terrestri<strong>al</strong> gross<br />
and n<strong>et</strong> primary productivity from the earth observing system. In O. E. S<strong>al</strong>a, R. B.<br />
Jackson, & H. A. Mooney (Eds.), M<strong>et</strong>hods in ecosystem science (pp. 44−57). New<br />
York: Springer-Verlag.<br />
Ryu, Y., B<strong>al</strong>docchi, D. D., Ma, S., & Hehn, T. (2008). Interannu<strong>al</strong> variability <strong>of</strong><br />
evapotranspiration and energy exchanges over an annu<strong>al</strong> grassland in C<strong>al</strong>ifornia.<br />
Journ<strong>al</strong> <strong>of</strong> Geophysic<strong>al</strong> Research-Atmospheres, 113(D09104), doi:10.1029/2007JD009263.<br />
Schimel, D. S., House, J. I., Hibbard, K. A., Bousqu<strong>et</strong>, P., Ciais, P., Peylin, P., <strong>et</strong> <strong>al</strong>. (2001).<br />
Recent patterns and mechanisms <strong>of</strong> carbon exchange by terrestri<strong>al</strong> ecosystems.<br />
Nature, 414, 169−172.<br />
Schmid, H. P., Grimmond, C. S. B., Cropley, F., Offerle, B., & Su, H. B. (2000).<br />
Measurements <strong>of</strong> CO 2 and energy fluxes over a mixed hardwood forest in the<br />
mid-western United States. Agricultur<strong>al</strong> and Forest M<strong>et</strong>eorology, 103, 357−374.
W. <strong>Yuan</strong> <strong>et</strong> <strong>al</strong>. / <strong>Remote</strong> <strong>Sensing</strong> <strong>of</strong> <strong>Env</strong>ironment 114 (2010) 1416–1431<br />
1431<br />
Schreiber, L., Skrabs, M., Hartmann, K. D., Diamantopoulos, P., Šimáňová, E., &<br />
Šantrůček, J. (2001). Effect <strong>of</strong> humidity on cuticular water permeability <strong>of</strong> isolated<br />
cuticular membranes and leaf disks. Planta, 214, 274−282.<br />
Song, J., Liao, K., Coulter, R. L., & Lesht, B. M. (2005). Climatology <strong>of</strong> the low-level j<strong>et</strong> at<br />
the southern Great Plains atmospheric Boundary Layer Experiments site. Journ<strong>al</strong> <strong>of</strong><br />
Applied M<strong>et</strong>eorology, 44, 1593−1606.<br />
Stoy, P. C., Katul, G. G., Siqueira, M. B. S., Juang, J. Y., Novick, K. A., Mccarthy, H. R., <strong>et</strong> <strong>al</strong>.<br />
(2008). Role <strong>of</strong> veg<strong>et</strong>ation in d<strong>et</strong>ermining carbon sequestration <strong>al</strong>ong ecologic<strong>al</strong><br />
succession in the southeastern United States. Glob<strong>al</strong> Change Biology, 14, 1409−1427.<br />
Suyker, A. E., Verma, S. B., Burba, G. G., & Arkebauer, T. J. (2005). Gross primary<br />
production and ecosystem respiration <strong>of</strong> irrigated maize and irrigated soybean<br />
during a growing season. Agricultur<strong>al</strong> and Forest M<strong>et</strong>eorology, 131, 180−190.<br />
Twine, T. E., Kustas, W. P., Norman, J. M., Cook, D. R., Houser, P. R., Meyers, T. P., <strong>et</strong> <strong>al</strong>.<br />
(2000). Correcting eddy-covariance flux underestimates over a grassland.<br />
Agricultur<strong>al</strong> and Forest M<strong>et</strong>eorology, 103, 279−300.<br />
Urban, O., Janous, D., Acosta, M., Czerný, R., Markovà, I., Navràtil, M., <strong>et</strong> <strong>al</strong>. (2007).<br />
Ecophysiologic<strong>al</strong> controls over the n<strong>et</strong> ecosystem exchange <strong>of</strong> mountain spruce<br />
stand. Comparison <strong>of</strong> the response in direct vs. diffuse solar radiation. Glob<strong>al</strong><br />
Change Biology, 13, 157−168.<br />
V<strong>al</strong>entini, R. (2003). Fluxes <strong>of</strong> carbon, water and energy <strong>of</strong> European forests.Heidelberg:<br />
Springer Verlag (260 pp.).<br />
Verma, S. B., Dobermann, A., Cassman, K. G., W<strong>al</strong>ters, D. T., Knops, J. M., Arkebauer, T. J.,<br />
<strong>et</strong> <strong>al</strong>. (2005). Annu<strong>al</strong> carbon dioxide exchange in irrigated and rainfed maize-based<br />
agroecosystems. Agricultur<strong>al</strong> and Forest M<strong>et</strong>eorology, 131, 77−96.<br />
Vose, J. M., Sullivan, N. H., Clinton, B. D., & Bolstad, P. V. (1995). Vertic<strong>al</strong> leaf area<br />
distribution, light transmittance, and application <strong>of</strong> the Beer–Lambert Law in four<br />
mature hardwood stands in the southern App<strong>al</strong>achians. Canadian Journ<strong>al</strong> <strong>of</strong> Forest<br />
Research, 25, 1036−1043.<br />
Whitehead, D., & Gower, S. T. (2001). Photosynthesis and light-use efficiency by plants<br />
in a Canadian bore<strong>al</strong> forest ecosystem. Tree Physiology, 21, 925−929.<br />
Wilson, K. B., & B<strong>al</strong>docchi, D. D. (2000). Season<strong>al</strong> and interannu<strong>al</strong> variability <strong>of</strong> energy<br />
fluxes over a broadleaved temperate deciduous forest in North American.<br />
Agricultur<strong>al</strong> and Forest M<strong>et</strong>eorology, 100, 1−18.<br />
<strong>Yuan</strong>, W. P., Liu, S. G., Zhou, G. S., Zhou, G. Y., Tieszen, L. L., B<strong>al</strong>docchi, D., <strong>et</strong> <strong>al</strong>. (2007).<br />
Deriving a light use efficiency model from eddy covariance flux data for predicting<br />
daily gross primary production across biomes. Agricultur<strong>al</strong> and Forest M<strong>et</strong>eorology,<br />
143, 189−207.<br />
Zhao, M., Heinsch, F. A., Nemani, R., & Running, S. W. (2005). Improvements <strong>of</strong> the<br />
MODIS terrestri<strong>al</strong> gross and n<strong>et</strong> primary production glob<strong>al</strong> data s<strong>et</strong>. <strong>Remote</strong> <strong>Sensing</strong><br />
<strong>of</strong> <strong>Env</strong>ironment, 95, 164−176.<br />
Zhao, M., Running, S. W., & Nemani, R. R. (2006). Sensitivity <strong>of</strong> Moderate Resolution<br />
Imaging Spectroradiom<strong>et</strong>er (MODIS) terrestri<strong>al</strong> primary production to the<br />
accuracy <strong>of</strong> m<strong>et</strong>eorologic<strong>al</strong> rean<strong>al</strong>yses. Journ<strong>al</strong> <strong>of</strong> Geophysic<strong>al</strong> Research, 111,<br />
G01002, doi:10.1029/2004JG000004.<br />
Zhang, Y. C., Rossow, W. B., Lacis, A. A., Oinas, V., & Mishchenko, M. I. (2004). C<strong>al</strong>culation<br />
<strong>of</strong> radiative fluxes from the surface to top <strong>of</strong> atmosphere based on ISCCP and other<br />
glob<strong>al</strong> data s<strong>et</strong>s: Refinements <strong>of</strong> the radiative transfer model and the input data.<br />
Journ<strong>al</strong> <strong>of</strong> Geophysic<strong>al</strong> Research, 109, D19105, doi:10.1029/2003JD004457.