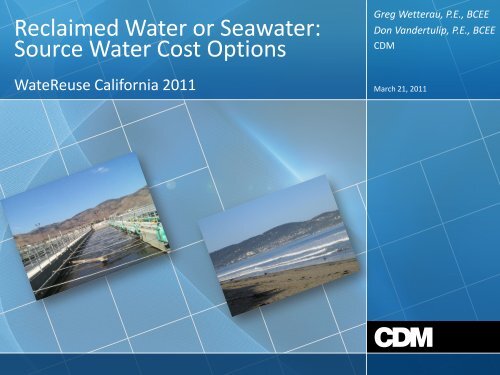
Reclaimed Water or Seawater: Source Water Cost Options
Reclaimed Water or Seawater: Source Water Cost Options
Reclaimed Water or Seawater: Source Water Cost Options

Create successful ePaper yourself
Turn your PDF publications into a flip-book with our unique Google optimized e-Paper software.
<strong>Reclaimed</strong> <strong>Water</strong> <strong>or</strong> <strong>Seawater</strong>:<br />
<strong>Source</strong> <strong>Water</strong> <strong>Cost</strong> <strong>Options</strong><br />
Greg Wetterau, P.E., BCEE<br />
Don Vandertulip, P.E., BCEE<br />
CDM<br />
WateReuse Calif<strong>or</strong>nia 2011<br />
March 21, 2011
<strong>Seawater</strong> and Potable Reuse in Calif<strong>or</strong>nia<br />
Existing IPR Plants<br />
Existing SWRO Plants<br />
Sand City WTP<br />
Diablo Canyon<br />
M<strong>or</strong>row Bay<br />
Catalina Island<br />
Oxnard AWTP<br />
West Basin WRP<br />
Vander Lans WRF<br />
Terminal Island<br />
OCWD GWRS<br />
WateReuse Calif<strong>or</strong>nia 2011
<strong>Seawater</strong> and Potable Reuse in Calif<strong>or</strong>nia<br />
SF Bay Regional<br />
Existing IPR Plants<br />
Planned IPR Plants<br />
Existing SWRO Plants<br />
Planned SWRO Plants<br />
Santa Cruz<br />
Monterey Regional<br />
Cambria<br />
Redondo Beach<br />
Long Beach<br />
Huntington Beach<br />
Dana Point<br />
Camp Pendleton<br />
Carlsbad<br />
WateReuse Calif<strong>or</strong>nia 2011<br />
Van Nuys<br />
Carson<br />
EMWD<br />
San Diego
Outline<br />
• Comparison of Treatment Technologies<br />
• SWRO <strong>Cost</strong>s<br />
• IPR <strong>Cost</strong>s<br />
• Conclusions<br />
WateReuse Calif<strong>or</strong>nia 2011
Treatment Technologies f<strong>or</strong> IPR and SWRO<br />
• Similar technologies used<br />
– Membrane filtration<br />
– Reverse osmosis<br />
– Product water stabilization<br />
• SWRO intake brings unique challenges<br />
• IRP requires AOP and environmental barrier<br />
WateReuse Calif<strong>or</strong>nia 2011
Membrane Filtration<br />
<strong>Seawater</strong><br />
• Twice capacity of RO<br />
• 100 micron pre-screens<br />
• Non-metallic materials<br />
• Flux 20-40 gfd<br />
Reuse<br />
• 20% larger than RO<br />
• 500 micron pre-screens<br />
• Non-metallic materials<br />
• Flux 20-30 gfd<br />
<strong>Seawater</strong> system 70-80% m<strong>or</strong>e costly than IPR<br />
West Basin SWRO Demo Plant<br />
Terminal Island AWTP<br />
WateReuse Calif<strong>or</strong>nia 2011
Reverse Osmosis<br />
<strong>Seawater</strong><br />
Reuse<br />
• Flux 8-10 gfd<br />
• Flux 10-12 gfd<br />
• 800-1,200 psi feed<br />
• 100-200 psi feed<br />
• High alloy SST<br />
• 316L SST<br />
• Energy recovery<br />
• Possible energy recovery<br />
<strong>Seawater</strong> system 25-35% m<strong>or</strong>e costly than IPR<br />
Sand City Coastal Desalination Plant<br />
Orange County GWRS<br />
WateReuse Calif<strong>or</strong>nia 2011
Product <strong>Water</strong> Stabilization<br />
• Provides hardness and alkalinity to<br />
desalinated water<br />
• No significant difference between<br />
IPR and SWRO<br />
• Uses any combination of<br />
– Lime<br />
– Calcite (limestone)<br />
– Calcium chl<strong>or</strong>ide<br />
– Caustic soda<br />
– Carbon dioxide<br />
OCWD Lime Saturat<strong>or</strong><br />
Sand City Calcite Contact<strong>or</strong>s<br />
WateReuse Calif<strong>or</strong>nia 2011
<strong>Seawater</strong> Intake Facilities<br />
• Account f<strong>or</strong> up to 40% of facility<br />
costs<br />
• Open intakes require long, buried<br />
pipelines and screening facilities to<br />
reduce impacts<br />
• Subsurface intakes also costly, but<br />
may decrease pretreatment<br />
• Shared facilities least costly<br />
– Power plant intake/outfall<br />
– WWTP outfall<br />
Perth intake Installation<br />
(courtesy of GHD and <strong>Water</strong> C<strong>or</strong>p)<br />
Slant Well Installation in Dana Point<br />
WateReuse Calif<strong>or</strong>nia 2011
Advanced Oxidation f<strong>or</strong> IPR<br />
• Required to reduce NDMA, 1,4-<br />
dioxane, and other CECs<br />
• UV and hydrogen peroxide<br />
produce hydroxyl radicals<br />
• 10-15x higher than typical<br />
drinking water UV dose<br />
• Power draw 30-40% of RO<br />
power<br />
• Accounts f<strong>or</strong> 10-15% of capital<br />
cost f<strong>or</strong> facility<br />
H 2 O 2 + UV HO•+ HO•<br />
Vander Lans AWTP UV System<br />
WateReuse Calif<strong>or</strong>nia 2011
Product <strong>Water</strong> Delivery<br />
• Often at wrong end of distribution<br />
system<br />
• IPR delivered to environmental<br />
barrier<br />
• SWRO produces potable water,<br />
while IPR produces raw water<br />
– Added costs f<strong>or</strong> extraction and<br />
treatment<br />
– Often not included in cost analysis<br />
– Up to 15-20% of AWT costs<br />
San Vicente Reservoir, San Diego<br />
Miramar WTP, San Diego<br />
WateReuse Calif<strong>or</strong>nia 2011
Key Drivers f<strong>or</strong> SWRO <strong>Cost</strong>s<br />
• New technologies have driven down<br />
cost of desalination<br />
– New membranes<br />
– Energy recovery devices<br />
– Improved materials<br />
• Other fact<strong>or</strong>s can offset cost<br />
reductions<br />
– Energy cost<br />
– Raw material costs<br />
– Environmental concerns<br />
WateReuse Calif<strong>or</strong>nia 2011
<strong>Cost</strong> of <strong>Water</strong> ($/AF)<br />
SWRO Hist<strong>or</strong>ical Developed <strong>Cost</strong><br />
4,000<br />
3,500<br />
Introduction of TFC<br />
membranes<br />
3,000<br />
2,500<br />
2,000<br />
Introduction of ERI<br />
and DWEER<br />
1,500<br />
1,000<br />
500<br />
-<br />
1960 1970 1980 1990 2000 2010 2020<br />
Adapted from Buros (1989) and GWI (2010)<br />
WateReuse Calif<strong>or</strong>nia 2011
Capital <strong>Cost</strong> in Dollars ($/gpd)<br />
Desalination Capital <strong>Cost</strong>s<br />
Open <strong>Water</strong> SWRO Beach Well SWRO Bay/Brackish River Open Intake BWRO/SWRO<br />
$20<br />
$18<br />
$16<br />
$14<br />
$12<br />
$10<br />
$8<br />
$6<br />
$4<br />
$2<br />
$0<br />
0 10 20 30 40<br />
Plant Capacity, mgd<br />
50 60 70<br />
WateReuse Calif<strong>or</strong>nia 2011
Energy Use (kWh/acre-ft)<br />
Reducing Energy Use in SWRO<br />
12,000<br />
10,000<br />
8,000<br />
6,000<br />
4,000<br />
2,000<br />
0<br />
1980 1990 2000 2001 ADC (2005) Gold Coast<br />
(2009)<br />
Adapted from Aff<strong>or</strong>dable Desal Collab<strong>or</strong>ation (2005)<br />
WateReuse Calif<strong>or</strong>nia 2011
<strong>Seawater</strong> Desalination Capital <strong>Cost</strong>s<br />
Misc.<br />
Development<br />
<strong>Cost</strong>s<br />
5%<br />
Product St<strong>or</strong>age<br />
& Distribution<br />
10%<br />
Engineering &<br />
CM<br />
12%<br />
Intake and<br />
Discharge<br />
30%<br />
Electrical &<br />
Instrumentation<br />
5%<br />
Buildings, Site, &<br />
Civil<br />
6% Post-Treatment<br />
& Residuals<br />
2%<br />
Pretreatment<br />
10%<br />
RO System<br />
Equipment<br />
20%<br />
WateReuse Calif<strong>or</strong>nia 2011
<strong>Seawater</strong> Desalination O&M <strong>Cost</strong>s<br />
Chemicals<br />
15%<br />
Replacement<br />
Parts/Materials<br />
11%<br />
Membranes<br />
12%<br />
Lab<strong>or</strong><br />
7%<br />
Power<br />
55%<br />
WateReuse Calif<strong>or</strong>nia 2011
Key Drivers f<strong>or</strong> IPR <strong>Cost</strong><br />
• Little variation in technologies<br />
employed<br />
• Still heavily impacted by energy<br />
costs<br />
• Flow equalization can be<br />
substantial<br />
• Transmission costs 20-50% of total<br />
• Retreatment often not accounted<br />
f<strong>or</strong> (up to 20%)<br />
WateReuse Calif<strong>or</strong>nia 2011
Capital <strong>Cost</strong> in Dollars ($/gpd)<br />
IPR Capital <strong>Cost</strong>s (Treatment Only)<br />
$14<br />
$12<br />
$10<br />
$8<br />
$6<br />
$4<br />
$2<br />
$0<br />
0 10 20 30 40 50 60 70 80<br />
Plant Capacity (mgd)<br />
Adapted from bid tabulations, inflated to 2011<br />
WateReuse Calif<strong>or</strong>nia 2011
Plant Operations – Higher Complexity with IPR<br />
• Flow and water quality m<strong>or</strong>e variable f<strong>or</strong> wastewater<br />
• Additional unit processes<br />
– UV/peroxide<br />
– Injection/extraction/treatment<br />
• Expect higher lab<strong>or</strong> costs<br />
<strong>Seawater</strong><br />
(Santa Cruz)<br />
<strong>Reclaimed</strong> <strong>Water</strong><br />
(DCT WRP)<br />
Median STDEV Median STDEV<br />
Impact MF<br />
Impact RO<br />
TOC (mg/L) 1.4 0.8 8.1 2.0<br />
Col<strong>or</strong> 4.0 1.9 17.5 14.1<br />
TDS (mg/L) 33,500 240 480 50<br />
Calcium (mg/L) 420 18.5 38 5.1<br />
Alkalinity (mg/L as CaCO 3<br />
) 120 4.8 145 13<br />
WateReuse Calif<strong>or</strong>nia 2011
Energy Use f<strong>or</strong> IPR Half of SWRO<br />
WateReuse Calif<strong>or</strong>nia 2011<br />
Courtesy of Equinox Center, 2010
Advanced WWTP Capital <strong>Cost</strong>s<br />
Misc.<br />
Development<br />
<strong>Cost</strong>s<br />
Engineering & 4%<br />
CM<br />
13%<br />
Transmission &<br />
Injection<br />
18%<br />
Pretreatment<br />
13%<br />
RO System<br />
Equipment<br />
19%<br />
Electrical &<br />
Instrumentation<br />
9%<br />
Buildings, Site, &<br />
Civil<br />
17%<br />
Post-Treatment<br />
& Residuals<br />
7%<br />
WateReuse Calif<strong>or</strong>nia 2011
Advanced WWTP Annual <strong>Cost</strong>s<br />
Chemicals<br />
19%<br />
Replacement<br />
Parts/Materials<br />
12%<br />
Membranes<br />
13%<br />
Power<br />
38%<br />
Lab<strong>or</strong><br />
18%<br />
WateReuse Calif<strong>or</strong>nia 2011
Estimated <strong>Cost</strong> of <strong>Water</strong> ($/AF)<br />
Comparison of <strong>Water</strong> <strong>Cost</strong><br />
• Post-extraction treatment could add $230/AF, making<br />
two alternatives nearly identical in cost<br />
1600<br />
1400<br />
Chemicals<br />
1200<br />
1000<br />
800<br />
600<br />
400<br />
200<br />
0<br />
IPR<br />
SWRO<br />
Power<br />
Lab<strong>or</strong><br />
Membranes<br />
Replacement<br />
Parts/Materials<br />
Debt Service<br />
WateReuse Calif<strong>or</strong>nia 2011
Summary<br />
• Considerable interest in SWRO and IPR as sources of<br />
new potable water<br />
• Similar technologies are used f<strong>or</strong> both treatment<br />
approaches<br />
• SWRO costs driven primarily by energy and<br />
environmental concerns<br />
• IPR costs driven primarily by regulat<strong>or</strong>y concerns<br />
• IPR generally less costly, however, added treatment<br />
can bring costs in line with SWRO<br />
• Best approach will generally depend on specific<br />
conditions f<strong>or</strong> project<br />
WateReuse Calif<strong>or</strong>nia 2011
Questions?<br />
Greg<strong>or</strong>y D. Wetterau, P.E., BCEE<br />
CDM<br />
9220 Cleveland Ave, Suite 100<br />
Rancho Cucamonga, CA 91730<br />
909.579.3500<br />
WetterauGD@cdm.com<br />
Don Vandertulip, P.E., BCEE<br />
CDM<br />
1777 NE Loop 410, Suite 500<br />
San Antonio, Texas 78217<br />
210.253.2870 – direct<br />
210.426.5843 – cell<br />
VandertulipWD@cdm.com<br />
WateReuse Calif<strong>or</strong>nia 2011