Report for EnergiNet - May 2013.pdf - Wave Star
Report for EnergiNet - May 2013.pdf - Wave Star
Report for EnergiNet - May 2013.pdf - Wave Star

You also want an ePaper? Increase the reach of your titles
YUMPU automatically turns print PDFs into web optimized ePapers that Google loves.
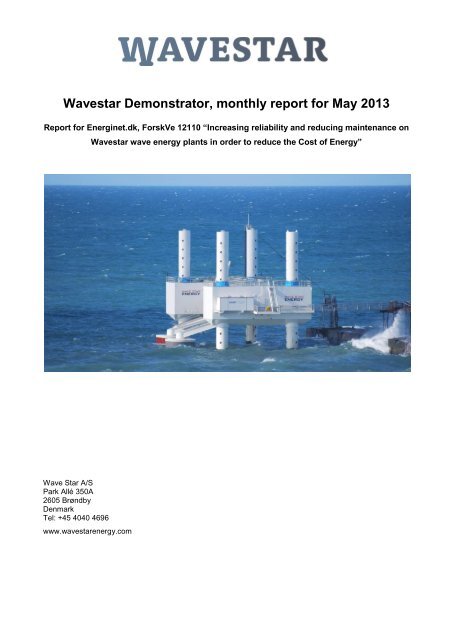
<strong>Wave</strong>star Demonstrator, monthly report <strong>for</strong> <strong>May</strong> 2013<br />
<strong>Report</strong> <strong>for</strong> Energinet.dk, ForskVe 12110 “Increasing reliability and reducing maintenance on<br />
<strong>Wave</strong>star wave energy plants in order to reduce the Cost of Energy”<br />
<strong>Wave</strong> <strong>Star</strong> A/S<br />
Park Allé 350A<br />
2605 Brøndby<br />
Denmark<br />
Tel: +45 4040 4696<br />
www.wavestarenergy.com
<strong>Wave</strong>star Demonstrator, monthly report <strong>for</strong> <strong>May</strong> 2013<br />
Version: 1 Created by: BHE Date: 2013-06-06<br />
Background<br />
In January 2013 the project titled “Increasing reliability and reducing maintenance on <strong>Wave</strong>star wave energy<br />
plants in order to reduce the Cost of Energy” was initiated. The project is running over two years, January<br />
2013 to December 2014. The project is subsidized by the Energinet.dk ForskVE program, project no. 12110.<br />
The project is an extension of the successful completion of the ForskVE project 2009-1-10305, which ended<br />
in December 2012. The previous project was spilt in two phases “Phase 1” and “Phase 2”, and <strong>for</strong> this<br />
reason the new project is termed “Phase 3”. An overview of the purpose <strong>for</strong> three phases is given below:<br />
Phase 1, <strong>May</strong> 2010 to September 2011: Focus was to demonstrate that the hydraulic power was<br />
higher than a specified target power per<strong>for</strong>mance curve. Phase 1 was finished in September 2011<br />
where 14754 valid ten minute records with power production higher than the specifications, were<br />
recorded, documented and approved by <strong>EnergiNet</strong>.dk.<br />
Phase 2, October 2012 to December 2012 (three months): Emphasis was on the electrical energy.<br />
In phase 2 the capability of the machine to deliver the expected number of electrical kWh’s in a three<br />
month period was documented. Phase 2 was completed after phase 1 was completed when the<br />
machine was ready <strong>for</strong> automatic continuous unmanned operation.<br />
Phase 3, January 2013 to December 2014 (two years). The purpose of the project is to continue<br />
operation and development of the <strong>Wave</strong>star Demonstrator at Hanstholm with the focus on increasing<br />
the life time and reducing operating and maintenance costs, thus improving the overall Cost of<br />
Energy. This will be achieved through a targeted collection of statistics on maintenance and time<br />
consumption, and the subsequent replacement, testing and optimization of the critical components.<br />
The goal is to minimize the number of service calls and downtime on the upcoming full-scale<br />
machine in the open sea.<br />
Every month since <strong>May</strong> 2010 <strong>Wave</strong>star has published a monthly report with a summary of the achieved<br />
results and activities at the <strong>Wave</strong>star demonstrator at Hanstholm. The monthly reports are supplemented by<br />
an Excel file containing data records with all the raw data presented in tables and figures.<br />
References:<br />
http://www.fi.dk/filer/publikationer/2010/energi_2010/html/kap03.htm<br />
http://www.energinet.dk/DA/FORSKNING/ForskVE-programmet/Sider/ForskVE-udbud.aspx<br />
Page 2 of 12
<strong>Wave</strong>star Demonstrator, monthly report <strong>for</strong> <strong>May</strong> 2013<br />
Version: 1 Created by: BHE Date: 2013-06-06<br />
Table of contents<br />
1 Activities and special events in present month ......................................................................................... 3<br />
2 Per<strong>for</strong>mance in present month .................................................................................................................. 4<br />
3 Summary of per<strong>for</strong>mance since installation .............................................................................................. 6<br />
4 Downtime registration ............................................................................................................................... 8<br />
5 Guest book ................................................................................................................................................ 9<br />
6 Economic data .......................................................................................................................................... 9<br />
7 Maintenance activities ............................................................................................................................. 10<br />
8 Development activities ............................................................................................................................ 11<br />
Appendix A: Explanations on wave and power measurements ...................................................................... 12<br />
1 Activities and special events in present month<br />
A combination of three faults caused the machine to be out of operation <strong>for</strong> about one week:<br />
<br />
<br />
<br />
In the beginning of the month we noticed, that the ultrasonic wave measurement unit delivered faulty<br />
in<strong>for</strong>mation. This showed up to be caused by some connectors <strong>for</strong> the reference sensor, which were<br />
corroded, and new cables were ordered.<br />
When the wave measurement equipment at the machine does not function, data read from<br />
Hanstholm Harbour can be used instead. But un<strong>for</strong>tunately the wave measurement buoy was out of<br />
order due to a collision with a boat. Other wave in<strong>for</strong>mation is available but only the two here<br />
mentioned are currently accepted <strong>for</strong> control of the machine. So the machine went into hibernation<br />
mode.<br />
The third fault was that the internet modem (where the fibre optic cable to the machine ends) ceased<br />
to function. It was replaced by the network operator. During this time all data were collected and<br />
stored as normal, but no data were visible at the internet or on remote control screens.<br />
All faults were handled correctly, but the resulting operation and production figures suffered from this.<br />
Page 3 of 12
<strong>Wave</strong>star Demonstrator, monthly report <strong>for</strong> <strong>May</strong> 2013<br />
Version: 1 Created by: BHE Date: 2013-06-06<br />
2 Per<strong>for</strong>mance in present month<br />
This month the machine has been operational <strong>for</strong> 73.3% of the time of the month, and in production <strong>for</strong><br />
63.9% of this time.<br />
The operational status, the energy production, and the wave height <strong>for</strong> the month are displayed here below.<br />
Operational status<br />
Energy production<br />
Significant wave height<br />
Page 4 of 12
<strong>Wave</strong>star Demonstrator, monthly report <strong>for</strong> <strong>May</strong> 2013<br />
Version: 1 Created by: BHE Date: 2013-06-06<br />
10 minute average production registrations<br />
Page 5 of 12
<strong>Wave</strong>star Demonstrator, monthly report <strong>for</strong> <strong>May</strong> 2013<br />
Version: 1 Created by: BHE Date: 2013-06-06<br />
3 Summary of per<strong>for</strong>mance since installation<br />
Page 6 of 12
<strong>Wave</strong>star Demonstrator, monthly report <strong>for</strong> <strong>May</strong> 2013<br />
Version: 1 Created by: BHE Date: 2013-06-06<br />
Period<br />
Operational<br />
time<br />
[%]<br />
Production<br />
time<br />
[hours]<br />
Hydraulic<br />
energy<br />
[MWh]<br />
Electrical<br />
energy<br />
[MWh]<br />
PTO<br />
efficiency<br />
[%]<br />
Sept-09 to Apr-10 - 149 0.8 0.2 18.0<br />
<strong>May</strong>-10 to Sep-11 (phase 1) 45.8 3547 51.6 6.9 13.3<br />
Oct-11 to Sep-12 66.3 3697 52.8 30.4 57.6<br />
Oct-12 to Dec-12 (phase 2) 99.4 1805 26.0 15.6 60.1<br />
Jan-13 to Apr-13 (phase 3) 90.3 2275 28.1 16.2 57.4<br />
Total 62.8 11473 159.3 69.3 43.5<br />
Summary of the measured energy production since installation in September 2009.<br />
Page 7 of 12
<strong>Wave</strong>star Demonstrator, monthly report <strong>for</strong> <strong>May</strong> 2013<br />
Version: 1 Created by: BHE Date: 2013-06-06<br />
4 Downtime registration<br />
Each time the machine or a single float leaves automatic operation it is automatically registered in the<br />
database.<br />
If it is due to a fault, the fault description is written.<br />
If it is due to the operator changing mode, the operator is requested to indicate the reason <strong>for</strong> this.<br />
The reason can be Demonstration, Inspection, Maintenance, Planned stop, or Development.<br />
If the reason is other than Demonstration, the operator is further requested to indicate which FDS<br />
(Functional Design Specification) area this stop regards, and an optional comment can be written.<br />
When the float or the machine returns to operational state, the time is registered and the downtime duration<br />
is calculated.<br />
As the machine is still half operational if only one float is operational a weighted downtime is calculated,<br />
where a single float only count half.<br />
By accumulating the weighted downtimes, the number of minutes where the machine has been not<br />
operational is found. From this, the percentage of the month where the machine has been not operational is<br />
found.<br />
The complete Downtime log can be seen in the Downtime log sheet in the Excel file of this report. An extract<br />
covering the present month is shown below.<br />
In future status reports the downtime events will be grouped to show the downtime per downtime reason.<br />
Page 8 of 12
<strong>Wave</strong>star Demonstrator, monthly report <strong>for</strong> <strong>May</strong> 2013<br />
Version: 1 Created by: BHE Date: 2013-06-06<br />
5 Guest book<br />
Registration of all visitors on the machine was started from January 1 st 2013.<br />
Visitors are grouped in the following categories: Politicians, Energy companies, Business partners,<br />
Journalists, Students, and Others.<br />
The complete guest book can be viewed in the Excel file of this report. The visits in the present month are<br />
extracted and shown below.<br />
6 Economic data<br />
Operation and maintenance activities are registered in the accounting system at the following accounts:<br />
<br />
<br />
<br />
<br />
Planned maintenance<br />
Unplanned maintenance<br />
Test and development<br />
Others (include insurances, direct cost like energy…)<br />
The overview shown below will be updated as data becomes available.<br />
cost €<br />
planned<br />
maintenance<br />
unplanned<br />
maintenance<br />
test and<br />
development others total<br />
2010 167351<br />
2011 138964<br />
2012 39476<br />
2013 Q1 237 4273 4510<br />
2013 Q2<br />
2013 Q3<br />
2013 Q4<br />
total 350301<br />
No detailed registration was made during the first three years. The first two years most expenses went to<br />
unplanned maintenance, while the expenses in 2012 mainly were <strong>for</strong> development.<br />
Page 9 of 12
<strong>Wave</strong>star Demonstrator, monthly report <strong>for</strong> <strong>May</strong> 2013<br />
Version: 1 Created by: BHE Date: 2013-06-06<br />
7 Maintenance activities<br />
Each time a maintenance operation on the machine is completed, it is registered in the database via the HMI<br />
faceplate of the component in question.<br />
The complete Maintenance log can be seen in the Maintenance log sheet in the Excel file of this report. An<br />
extract covering the present month is shown below.<br />
The complete maintenance log holds additional in<strong>for</strong>mation like reference to the FDS (Functional Design<br />
Specification) that covers the component, and time and money spent on the operation.<br />
In future status reports the maintenance operations will be grouped to show maintenance demand per FDS<br />
area and <strong>for</strong> evaluation of maintenance need <strong>for</strong> the machine as time, cost, and number of maintenance<br />
trips. The complete maintenance log will also serve as a valuable input to a future service manual.<br />
Page 10 of 12
<strong>Wave</strong>star Demonstrator, monthly report <strong>for</strong> <strong>May</strong> 2013<br />
Version: 1 Created by: BHE Date: 2013-06-06<br />
The following table lists maintenance activities that are planned <strong>for</strong> the near future.<br />
Activity Description Status<br />
Ladder repair New ladder <strong>for</strong> float 1 float arm Planned <strong>for</strong> spring 2013<br />
Bearing repair New rod end bearing <strong>for</strong> float 2, and repair of Planned <strong>for</strong> summer 2013<br />
gyro suspension<br />
Filter change Hydraulic oil filter change, all systems Planned <strong>for</strong> summer 2013<br />
Hydraulic tank repair Change of seals <strong>for</strong> hydraulic oil tank Planned <strong>for</strong> summer 2013<br />
Zinc anodes Change of zinc anodes on legs Planned <strong>for</strong> 2013<br />
Bearing repair New rod end bearing <strong>for</strong> float 2, and repair of Planned <strong>for</strong> summer 2013<br />
gyro suspension<br />
Test of essential<br />
sub-systems<br />
Test of jacking system and diesel engine Every second month<br />
8 Development activities<br />
The following table lists development activities that are planned <strong>for</strong> the near future.<br />
Activity Description Status<br />
Service log<br />
Finishing of Service log to include components, Planned <strong>for</strong> 2 st quarter 2013<br />
that are not yet defined in the control system<br />
<strong>Wave</strong> analysis Software update with <strong>Wave</strong>lab Planned <strong>for</strong> 2013<br />
Load pin analysis Software analysis and database update Planned <strong>for</strong> 2013<br />
Jack seals<br />
Construction of a opening/closing mechanism Planned <strong>for</strong> 2013<br />
<strong>for</strong> the new type of seals around legs<br />
Reprogramming Reprogramming of PLC programs <strong>for</strong> “Power Planned <strong>for</strong> spring 2013<br />
systems” to current standard<br />
New PTO test Test new digital hydraulic high efficient PTO Planned <strong>for</strong> 2014<br />
Development activities are moved to the table below when completed.<br />
Activity Description Completed<br />
Maintenance costs<br />
Guest book<br />
Downtime<br />
registration<br />
Reprogramming<br />
Extraction of maintenance costs <strong>for</strong> 2010 to<br />
2012 <strong>for</strong> display in the table in section 6,<br />
“Economic data”<br />
It is defined how visitors on the machine are<br />
registered in the calendar system of MS<br />
Outlook. In<strong>for</strong>mation from here is extracted to<br />
the monthly Excel report.<br />
Programming of the Downtime registration<br />
system has been finished. Final adjustments<br />
will be made concurrently.<br />
Reprogramming of PLC programs <strong>for</strong> the area<br />
“Main machine control” has been updated to<br />
current standard<br />
January 2013<br />
February 2013<br />
February 2013<br />
Marts 2013<br />
Page 11 of 12
<strong>Wave</strong>star Demonstrator, monthly report <strong>for</strong> <strong>May</strong> 2013<br />
Version: 1 Created by: BHE Date: 2013-06-06<br />
Appendix A: Explanations on wave and power measurements<br />
<strong>Wave</strong>s and power production are measured directly on-board the <strong>Wave</strong>star prototype. An ultrasonic wave<br />
sensor is providing wave recordings at the exact location of the device. The diagram below shows the<br />
different power conversion stages. Two definitions are important in the report.<br />
Hydraulic power, P h [W]: The hydraulic power is measured at the hydraulic actuator, calculated by<br />
multiplying of the pressure across the cylinder and the flow in the cylinder. The hydraulic power of the<br />
prototype is the sum of the hydraulic power of both floats, P h = P h1 + P h2 . The hydraulic energy, referred to as<br />
E h , is the integration of the instantaneous hydraulic power over time.<br />
Electrical power, P e [W]: The electrical and consequently generated power is measured at the output of the<br />
generator, calculated by multiplying the voltage and the current. The electrical power of the prototype is the<br />
sum of the electric power of both floats, P e = P e1 + P e2 . The electrical energy, referred to as E e , is the<br />
integration of the instantaneous electrical power over time.<br />
Overview of energy conversion stages of the <strong>Wave</strong>star Demonstrator at Hanstholm. The hydraulic power<br />
P h [W] is measured at the hydraulic actuator (pressure across the cylinder multiplied by the flow in the<br />
cylinder). The electrical power P e [W] is measured at the output of the generator (voltage multiplied by<br />
current).<br />
Page 12 of 12