Box and Whisker Graphs Homework - Lewiston School District
Box and Whisker Graphs Homework - Lewiston School District
Box and Whisker Graphs Homework - Lewiston School District

You also want an ePaper? Increase the reach of your titles
YUMPU automatically turns print PDFs into web optimized ePapers that Google loves.
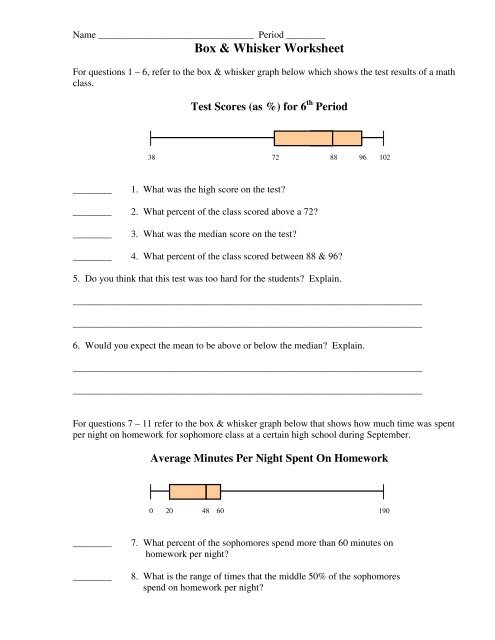
Name ________________________________ Period ________<br />
<strong>Box</strong> & <strong>Whisker</strong> Worksheet<br />
For questions 1 – 6, refer to the box & whisker graph below which shows the test results of a math<br />
class.<br />
Test Scores (as %) for 6 th Period<br />
38 72 88 96 102<br />
________<br />
1. What was the high score on the test?<br />
________ 2. What percent of the class scored above a 72?<br />
________<br />
3. What was the median score on the test?<br />
________ 4. What percent of the class scored between 88 & 96?<br />
5. Do you think that this test was too hard for the students? Explain.<br />
________________________________________________________________________<br />
________________________________________________________________________<br />
6. Would you expect the mean to be above or below the median? Explain.<br />
________________________________________________________________________<br />
________________________________________________________________________<br />
For questions 7 – 11 refer to the box & whisker graph below that shows how much time was spent<br />
per night on homework for sophomore class at a certain high school during September.<br />
Average Minutes Per Night Spent On <strong>Homework</strong><br />
0 20 48 60 190<br />
________<br />
________<br />
7. What percent of the sophomores spend more than 60 minutes on<br />
homework per night?<br />
8. What is the range of times that the middle 50% of the sophomores<br />
spend on homework per night?
________<br />
________<br />
9. How many sophomores do not do homework?<br />
10. What percent of the sophomores spend less than 20 minutes per night<br />
on homework?<br />
<strong>Box</strong> & <strong>Whisker</strong><br />
11. Would you expect the mean number of minutes per night to be higher or lower than<br />
the median? Explain.<br />
________________________________________________________________________<br />
________________________________________________________________________<br />
For questions 12 – 23, refer to the box & whisker graphs below that compare homework time per<br />
night with TV time per night for the same group of sophomores.<br />
TV & <strong>Homework</strong> Minutes per Night<br />
0 20 48 60 190<br />
<strong>Homework</strong> Time<br />
0 15 60 110 225<br />
TV Time<br />
________<br />
________<br />
12. What percent of the sophomores watch TV for at least 15 minutes per night?<br />
13. What is the 3 rd quartile for the TV time data?<br />
14. Is it more common for a sophomore at this high school to spend more than 1 hour on homework<br />
or more than 1 hour watching TV? Explain.<br />
_________________________________________________________________________________<br />
_________________________________________________________________________________<br />
_________________________________________________________________________________<br />
For questions 15 – 23, identify if each statement is true, false, or cannot be determined.<br />
________<br />
________<br />
________<br />
15. Some sophomores didn’t watch TV that month.<br />
16. The TV box & whisker graph contains more data than the homework graph.<br />
17. 25% of the sophomores spend between 48 & 60 minutes per night on homework.
________<br />
18. 15% of the sophomores didn’t watch TV that month.<br />
<strong>Box</strong> & <strong>Whisker</strong><br />
________<br />
________<br />
________<br />
________<br />
________<br />
19. In general, these sophomores spend more time watching TV than doing<br />
homework.<br />
20. The TV data is more varied than the homework data.<br />
21. The ratio of sophomores who spend more than 110 minutes per night watching<br />
TV to those who spend less is about 2:1.<br />
22. 225 sophomores watch TV.<br />
23. Twice as many sophomores watch TV for more than 1 hour than do homework<br />
for more than 1 hour.<br />
For question 24, refer to the box & whisker graphs below that show the average monthly high<br />
temperatures for Milwaukee, Wisconsin & Honolulu, Hawaii.<br />
Average Monthly High Temperatures<br />
26 35 57 73 80<br />
Milwaukee<br />
80 81 84.5 87 88 Honolulu<br />
25. Write a short paragraph comparing the temperatures in both cities.<br />
_________________________________________________________________________________<br />
_________________________________________________________________________________<br />
_________________________________________________________________________________<br />
_________________________________________________________________________________<br />
_________________________________________________________________________________
<strong>Box</strong> & <strong>Whisker</strong><br />
For questions 27 – 35, refer to the following data that shows the total number of points scored in<br />
each of the rose bowls from 1970 until 2006.<br />
Year<br />
Total<br />
Points<br />
Year<br />
Total<br />
Points<br />
Year<br />
Total<br />
Points<br />
Year<br />
Total<br />
Points<br />
1970 13 1980 33 1990 27 2000 26<br />
1971 44 1981 29 1991 60 2001 58<br />
1972 25 1982 28 1992 48 2002 51<br />
1973 59 1983 38 1993 69 2003 48<br />
1974 63 1984 54 1994 37 2004 42<br />
1975 35 1985 37 1995 58 2005 75<br />
1976 33 1986 73 1996 73 2006 79<br />
1977 20 1987 37 1997 37 2007 50<br />
1978 47 1988 37 1998 37<br />
1979 27 1989 36 1999 69<br />
27. Make a box & whisker graph for the total points scored in each decade. Make sure your 4<br />
graphs are drawn with the same scale so you can compare them.<br />
Refer to your box & whisker graphs to answer the following questions.<br />
________<br />
________<br />
________<br />
________<br />
________<br />
________<br />
________<br />
28. In which decade is the total points scored the most consistent?<br />
29. In which decade is the total points scored the most diverse?<br />
30. In which decade is the largest number of total points scored?<br />
31. In which decade is the 3 rd quartile the highest?<br />
32. In which decade is the median the highest?<br />
33. In which decade is the 1 st quartile the highest?<br />
34. In which decade is the outlier the most dramatic? Explain.<br />
_________________________________________________________________________________<br />
_________________________________________________________________________________<br />
35. What is the general trend that your 4 box & whisker graphs reveal?<br />
_________________________________________________________________________________