NHBC NEW HOMES STATISTICS REVIEW Q1 2012 - NHBC Home
NHBC NEW HOMES STATISTICS REVIEW Q1 2012 - NHBC Home
NHBC NEW HOMES STATISTICS REVIEW Q1 2012 - NHBC Home
You also want an ePaper? Increase the reach of your titles
YUMPU automatically turns print PDFs into web optimized ePapers that Google loves.
<strong>NHBC</strong> <strong>NEW</strong> <strong>HOMES</strong><br />
<strong>STATISTICS</strong> <strong>REVIEW</strong> <strong>Q1</strong> <strong>2012</strong><br />
With Richard Tamayo – Commercial Director at <strong>NHBC</strong><br />
CONTENTS<br />
THE BIG NUMBERS<br />
FOR <strong>Q1</strong> <strong>2012</strong><br />
1<br />
REGIONAL<br />
OVERVIEW<br />
2<br />
PUBLIC VS. PRIVATE<br />
3<br />
APPENDIX<br />
4<br />
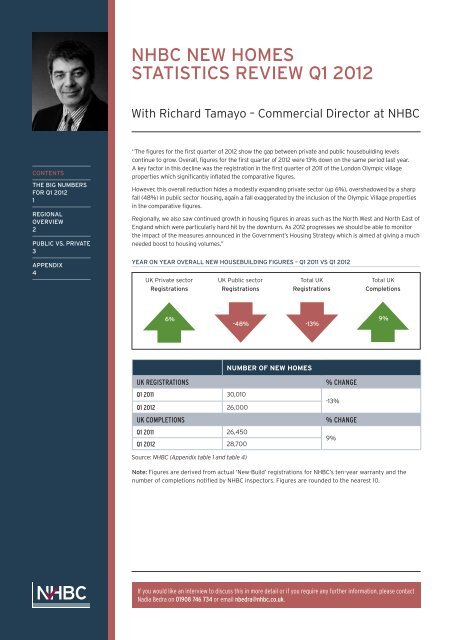
“The figures for the first quarter of <strong>2012</strong> show the gap between private and public housebuilding levels<br />
continue to grow. Overall, figures for the first quarter of <strong>2012</strong> were 13% down on the same period last year.<br />
A key factor in this decline was the registration in the first quarter of 2011 of the London Olympic village<br />
properties which significantly inflated the comparative figures.<br />
However, this overall reduction hides a modestly expanding private sector (up 6%), overshadowed by a sharp<br />
fall (48%) in public sector housing, again a fall exaggerated by the inclusion of the Olympic Village properties<br />
in the comparative figures.<br />
Regionally, we also saw continued growth in housing figures in areas such as the North West and North East of<br />
England which were particularly hard hit by the downturn. As <strong>2012</strong> progresses we should be able to monitor<br />
the impact of the measures announced in the Government’s Housing Strategy which is aimed at giving a much<br />
needed boost to housing volumes.”<br />
YEAR ON YEAR OVERALL <strong>NEW</strong> HOUSEBUILDING FIGURES – <strong>Q1</strong> 2011 VS <strong>Q1</strong> <strong>2012</strong><br />
UK Private sector<br />
Registrations<br />
UK Public sector<br />
Registrations<br />
Total UK<br />
Registrations<br />
Total UK<br />
Completions<br />
6%<br />
-48% -13%<br />
9%<br />
NUMBER OF <strong>NEW</strong> <strong>HOMES</strong><br />
UK REGISTRATIONS<br />
<strong>Q1</strong> 2011 30,010<br />
<strong>Q1</strong> <strong>2012</strong> 26,000<br />
UK COMPLETIONS<br />
<strong>Q1</strong> 2011 26,450<br />
<strong>Q1</strong> <strong>2012</strong> 28,700<br />
% CHANGE<br />
-13%<br />
% CHANGE<br />
9%<br />
Source: <strong>NHBC</strong> (Appendix table 1 and table 4)<br />
Note: Figures are derived from actual ‘New-Build’ registrations for <strong>NHBC</strong>’s ten-year warranty and the<br />
number of completions notified by <strong>NHBC</strong> inspectors. Figures are rounded to the nearest 10.<br />
If you would like an interview to discuss this in more detail or if you require any further information, please contact<br />
Nadia Bedra on 01908 746 734 or email nbedra@nhbc.co.uk.
page 2 of 10<br />
<strong>NHBC</strong> <strong>NEW</strong> <strong>HOMES</strong><br />
<strong>STATISTICS</strong> <strong>REVIEW</strong> <strong>Q1</strong> <strong>2012</strong><br />
Regional Overview<br />
Quarterly registrations for all sectors (% change <strong>Q1</strong> 2011 on <strong>Q1</strong> <strong>2012</strong>)<br />
DAVID LITTLE, <strong>NHBC</strong> DIRECTOR<br />
NORTHERN IRELAND<br />
“The registration figures for <strong>Q1</strong> show a small but<br />
welcome increase over the same period in 2011.<br />
They are hopefully an indication that we are seeing<br />
the end of the decline in the local housing market<br />
which started in 2007. The figures unsuprisingly<br />
show that most activity is concentrated in the<br />
Belfast commuter area, with an increase also in<br />
the North West.”<br />
PETER WATTON, <strong>NHBC</strong> DIRECTOR<br />
WALES<br />
21%<br />
“The market in Wales continues to be difficult with<br />
the availability of mortgages being the principle<br />
problem. In the first quarter of <strong>2012</strong> <strong>NHBC</strong> has<br />
seen registrations for 731 homes for sale and 147<br />
social homes; 4% down on last year. Many builders<br />
remain upbeat about sales and continue to<br />
open new developments in readiness for the<br />
Spring market.”<br />
38%<br />
-4%<br />
15%<br />
1%<br />
3%<br />
55%<br />
21%<br />
7%<br />
-17%<br />
MALCOLM MACLEOD, <strong>NHBC</strong> DIRECTOR<br />
SCOTLAND<br />
“Although the latest quarterly statistics portray<br />
a positive increase of nearly 40% in the number<br />
of homes registered with <strong>NHBC</strong> compared to the<br />
same quarter last year, these statistics have been<br />
influenced by the registration of the homes forming<br />
the Glasgow Commonwealth Games Athletes village<br />
which is currently under construction. When the<br />
latter homes are discounted the quarterly increase<br />
in registrations over the preceding year, although<br />
remaining positive, reduces to 2% and continues to<br />
run at 44% below its ten year average trend.”<br />
-47%<br />
-29%<br />
STEVE CATT, <strong>NHBC</strong> DIRECTOR<br />
ENGLAND<br />
“The London/South East regions<br />
continue to provide the strongest<br />
registration figures, contributing<br />
nearly 1/3 of all plot registrations<br />
in the UK during <strong>Q1</strong> <strong>2012</strong>.<br />
However, this dominance is not<br />
as strong as it was in the same<br />
period in 2011 and both regions<br />
show a significant decrease in<br />
registrations and ongoing site<br />
activity. Regions in the north of<br />
England have shown the<br />
strongest year on year quarterly<br />
increase, but from a very low<br />
base in 2011.”<br />
Source: <strong>NHBC</strong> (Appendix table 3)<br />
Note: The comparison is based on ‘New-Build’ registrations for <strong>NHBC</strong>’s ten-year warranty.<br />
PERCENTAGE OF UK HOUSE TYPES IN TOTAL REGISTRATIONS - ALL SECTORS<br />
Percentage<br />
50<br />
45<br />
40<br />
35<br />
30<br />
25<br />
20<br />
15<br />
10<br />
5<br />
0<br />
17<br />
Detached houses<br />
22<br />
1 1<br />
Detached bungalows<br />
16<br />
Semi-detached houses<br />
20 21<br />
Terraced houses<br />
24<br />
1 1<br />
Attached bungalows<br />
45<br />
Flats and maisonettes<br />
33<br />
<strong>Q1</strong> <strong>2012</strong><br />
<strong>Q1</strong> 2011<br />
Source: <strong>NHBC</strong> (Appendix table 5)<br />
If you would like an interview to discuss this in more detail or if you require any further information, please contact Nadia Bedra on 01908 746 734 or email<br />
nbedra@nhbc.co.uk.
page 3 of 10<br />
<strong>NHBC</strong> <strong>NEW</strong> <strong>HOMES</strong><br />
<strong>STATISTICS</strong> <strong>REVIEW</strong> <strong>Q1</strong> <strong>2012</strong><br />
UK MEDIAN SELLING PRICE OF <strong>NEW</strong> <strong>HOMES</strong> – PRIVATE SECTOR ONLY<br />
Note: These figures are based on the purchaser’s solicitor<br />
confirming to <strong>NHBC</strong> the purchase price of a new home.<br />
Prices are given in £000,s<br />
195<br />
190<br />
185<br />
180<br />
175<br />
170<br />
165<br />
160<br />
155<br />
150<br />
185<br />
<strong>Q1</strong> 2008<br />
165<br />
<strong>Q1</strong> 2009<br />
180<br />
Source: <strong>NHBC</strong> (Appendix table 2)<br />
MEHBAN CHOWDERY, HEAD OF SOCIAL HOUSING AT <strong>NHBC</strong><br />
Generally speaking affordable housing completions<br />
have held steady compared to the same period last year.<br />
Although it was expected that affordable housing levels<br />
would drop due to the slower commencement of the<br />
National Affordable Housing Programme (NAHP) <strong>2012</strong>-1015,<br />
completions came through from those properties which<br />
were stalled from the previous NAHP (2008-2011).<br />
Despite registrations down compared to the start of last<br />
year due to a number of factors, with the fall exaggerated<br />
by the inclusion of the Olympic Village properties in last<br />
year’s figures, we remain confident that looking ahead and<br />
as the new NAHP extends, that social housing levels will<br />
remain consistent.<br />
20000<br />
15000<br />
10000<br />
5000<br />
0<br />
CHART 2: <strong>NHBC</strong> REGISTRATIONS AND COMPLETIONS<br />
35000 Registrations – private sector<br />
30000<br />
Registrations – public sector<br />
Completions – private sector<br />
25000<br />
Completions – public sector<br />
<strong>Q1</strong> 2008<br />
<strong>Q1</strong> 2009<br />
<strong>Q1</strong> 2010<br />
<strong>Q1</strong> 2011<br />
<strong>Q1</strong> <strong>2012</strong><br />
<strong>Q1</strong> 2010<br />
178<br />
<strong>Q1</strong> 2011<br />
190<br />
<strong>Q1</strong> <strong>2012</strong><br />
Number of homes<br />
Source: <strong>NHBC</strong> (Appendix table 4)<br />
If you would like an interview to discuss this in more detail or if you require any further information, please contact Nadia Bedra on 01908 746 734 or email<br />
nbedra@nhbc.co.uk.
page 4 of 10<br />
<strong>NHBC</strong> <strong>NEW</strong> <strong>HOMES</strong><br />
<strong>STATISTICS</strong> <strong>REVIEW</strong> <strong>Q1</strong> <strong>2012</strong><br />
Appendix<br />
TABLE 1: UK REGISTRATIONS AND COMPLETIONS ALL SECTORS<br />
NUMBER OF <strong>NEW</strong> <strong>HOMES</strong><br />
REGISTRATIONS<br />
<strong>Q1</strong> 2008 37,840<br />
<strong>Q1</strong> 2009 16,230<br />
<strong>Q1</strong> 2010 27,970<br />
<strong>Q1</strong> 2011 30,010<br />
<strong>Q1</strong> <strong>2012</strong> 26,000<br />
Jan <strong>2012</strong> 7,830<br />
Feb <strong>2012</strong> 8,510<br />
Mar <strong>2012</strong> 9,660<br />
COMPLETIONS<br />
<strong>Q1</strong> 2008 35,220<br />
<strong>Q1</strong> 2009 25,700<br />
<strong>Q1</strong> 2010 23,200<br />
<strong>Q1</strong> 2011 26,450<br />
<strong>Q1</strong> <strong>2012</strong> 28,700<br />
Jan <strong>2012</strong> 6,480<br />
Feb <strong>2012</strong> 8,850<br />
Mar <strong>2012</strong> 13,370<br />
NOTES<br />
1. <strong>NHBC</strong> statistics are derived almost exclusively from its registered builders, who construct around 80% of the new homes built in the UK.<br />
As such, they represent a unique source of detailed, up-to-date information on new home construction and the house-building industry.<br />
2. A <strong>NHBC</strong> registered builder is required to register a house with <strong>NHBC</strong> at least 21 days before building starts.<br />
3. A house registered with <strong>NHBC</strong> is deemed completed when the <strong>NHBC</strong> Building Inspector, who carried out key stage inspections during<br />
construction, considers that the house has been satisfactorily completed in respect of <strong>NHBC</strong>’s technical requirements.<br />
4. These figures are rounded numbers to the nearest 10.<br />
5. The number of ‘Registrations’ relate to homes registered, less a small percentage reduction to allow for likely cancellations. During an<br />
economic downturn the number of actual cancellations is likely to be higher.<br />
6. The above figures relate to ‘New-Build’ registrations for <strong>NHBC</strong>’s ten-year warranty in the UK, including the Isle of Man.<br />
7. ‘Completions’ relate to the number of homes ‘finalled’ by <strong>NHBC</strong>’s Building Inspectors and are reported in the month they are received<br />
and processed.<br />
If you would like an interview to discuss this in more detail or if you require any further information, please contact Nadia Bedra on 01908 746 734 or email<br />
nbedra@nhbc.co.uk.
page 5 of 10<br />
<strong>NHBC</strong> <strong>NEW</strong> <strong>HOMES</strong><br />
<strong>STATISTICS</strong> <strong>REVIEW</strong> <strong>Q1</strong> <strong>2012</strong><br />
Appendix<br />
TABLE 2: MEDIAN SELLING PRICE OF <strong>NEW</strong> HOUSES – PRIVATE SECTOR ONLY<br />
PRICES ARE GIVEN<br />
IN £000’S<br />
<strong>Q1</strong> 2008 <strong>Q1</strong> 2009 <strong>Q1</strong> 2010 <strong>Q1</strong> 2011 <strong>Q1</strong> <strong>2012</strong><br />
North East 163 137 150 140 153<br />
North West 145 123 140 145 160<br />
Yorkshire & The Humber 155 140 157 141 158<br />
West Midlands 160 145 150 150 150<br />
East Midlands 160 145 148 150 156<br />
Eastern 197 180 198 205 200<br />
South West 195 171 185 180 187<br />
Greater London 275 250 250 290 274<br />
South East 220 195 225 225 240<br />
England 187 166 183 180 192<br />
Scotland 185 161 185 183 198<br />
Wales 175 145 144 155 168<br />
Northern Ireland (incl. Isle of Man) 175 147 144 132 135<br />
United Kingdom (incl. Isle of Man) 185 165 180 178 190<br />
NOTES<br />
1. <strong>NHBC</strong> asks the purchaser’s solicitor to return a document confirming the purchase price of a house.<br />
2. For each update, the previous figures are re-calculated and this can result in some minor changes occuring.<br />
3. Houses includes flats, maisonettes and bungalows.<br />
If you would like an interview to discuss this in more detail or if you require any further information, please contact Nadia Bedra on 01908 746 734 or email<br />
nbedra@nhbc.co.uk.
page 6 of 10<br />
<strong>NHBC</strong> <strong>NEW</strong> <strong>HOMES</strong><br />
<strong>STATISTICS</strong> <strong>REVIEW</strong> <strong>Q1</strong> <strong>2012</strong><br />
Appendix (continued)<br />
TABLE 3: REGIONAL REGISTRATION FIGURES – ALL SECTORS<br />
<strong>Q1</strong> 2008 <strong>Q1</strong> 2009 <strong>Q1</strong> 2010 <strong>Q1</strong> 2011 <strong>Q1</strong> <strong>2012</strong><br />
North East 1,250 610 1,320 690 1,070<br />
North West 3,540 1,490 1,810 1,760 2,030<br />
Yorkshire & the Humber 2,570 1,030 1,900 1,190 1,440<br />
West Midlands 2,900 930 2,350 1,600 1,640<br />
East Midlands 3,240 1,220 2,320 1,780 1,900<br />
Eastern 4,160 2,570 3,500 3,450 2,440<br />
South West 3,090 1,750 3,070 2,940 2,960<br />
Greater London 4,430 1,300 3,100 8,580 4,530<br />
South East 6,350 2,500 4,710 4,760 3,930<br />
England 31,520 13,390 24,080 26,750 21,950<br />
Scotland 4,000 1,450 1,990 1,950 2,700<br />
Wales 1,430 730 1,120 920 880<br />
Northern Ireland (incl. Isle of Man) 890 670 790 390 470<br />
United Kingdom (incl. Isle of Man) 37,840 16,230 27,970 30,010 26,000<br />
Note: Please note these figures are rounded to the nearest 10.<br />
Northern Ireland Registration Figures by County – all sectors<br />
<strong>Q1</strong> 2008 <strong>Q1</strong> 2009 <strong>Q1</strong> 2010 <strong>Q1</strong> 2011 <strong>Q1</strong> <strong>2012</strong><br />
Antrim 142 143 228 120 150<br />
Armagh 132 35 56 18 16<br />
Down 255 358 273 154 138<br />
Fermanagh 60 31 43 34 8<br />
Londonderry 79 48 86 33 101<br />
Tyrone 68 50 64 32 18<br />
If you would like an interview to discuss this in more detail or if you require any further information, please contact Nadia Bedra on 01908 746 734 or email<br />
nbedra@nhbc.co.uk.
page 7 of 10<br />
<strong>NHBC</strong> <strong>NEW</strong> <strong>HOMES</strong><br />
<strong>STATISTICS</strong> <strong>REVIEW</strong> <strong>Q1</strong> <strong>2012</strong><br />
Appendix (continued)<br />
Scotland Registration Figures by Council – all sectors<br />
<strong>Q1</strong> 2008 <strong>Q1</strong> 2009 <strong>Q1</strong> 2010 <strong>Q1</strong> 2011 <strong>Q1</strong> <strong>2012</strong><br />
Aberdeenshire 518 286 174 212 194<br />
Angus 64 7 47 28 48<br />
Argyll & Bute 48 25 15 16 7<br />
City of Aberdeen 135 72 15 129 178<br />
City of Edinburgh 273 194 165 197 235<br />
City of Glasgow 387 29 314 109 841<br />
Clackmannan 6 3 14 7 2<br />
Dumfries & Galloway 30 39 81 7 17<br />
Dundee City 73 19 62 38 6<br />
East Ayrshire 43 8 13 82 67<br />
East Dumbartonshire 0 4 53 134 40<br />
East Lothian 43 32 47 22 38<br />
East Renfrewshire 35 2 17 31 40<br />
Falkirk 207 0 45 16 46<br />
Fife 314 58 210 161 118<br />
Highland 224 86 91 43 79<br />
Inverclyde 45 20 5 18 16<br />
Midlothian 102 1 38 45 124<br />
Moray 23 5 63 8 54<br />
North Ayrshire 62 1 16 67 11<br />
North Lanarkshire 308 95 90 169 97<br />
Orkney Islands 1 21 0 1 1<br />
Perthshire & Kinross 101 21 81 19 63<br />
Renfrewshire 134 8 50 47 58<br />
Scottish Borders 77 19 62 21 30<br />
Shetland Islands 11 1 5 0 0<br />
South Ayrshire 79 0 19 8 62<br />
South Lanarkshire 318 32 144 168 96<br />
Stirling 208 4 30 44 34<br />
West Dumbartonshire 37 0 2 34 54<br />
Western Isles 1 18 13 2 1<br />
West Lothian 97 336 6 65 42<br />
If you would like an interview to discuss this in more detail or if you require any further information, please contact Nadia Bedra on 01908 746 734 or email<br />
nbedra@nhbc.co.uk.
page 8 of 10<br />
<strong>NHBC</strong> <strong>NEW</strong> <strong>HOMES</strong><br />
<strong>STATISTICS</strong> <strong>REVIEW</strong> <strong>Q1</strong> <strong>2012</strong><br />
Appendix (continued)<br />
Welsh Registration Figures by Unitary Authority – all sectors<br />
<strong>Q1</strong> 2008 <strong>Q1</strong> 2009 <strong>Q1</strong> 2010 <strong>Q1</strong> 2011 <strong>Q1</strong> <strong>2012</strong><br />
Blaenau Gwent 35 85 4 1 0<br />
Bridgend 152 67 206 54 112<br />
Caerphilly 41 105 76 55 91<br />
Cardiff 170 117 176 64 76<br />
Carmarthenshire 49 20 70 55 19<br />
Ceredigion 6 2 11 15 0<br />
Conwy 67 6 12 30 48<br />
Denbighshire 4 6 2 54 20<br />
Flintshire 56 3 46 49 44<br />
Gwynedd 6 8 15 9 1<br />
Isle of Anglesey 33 5 7 12 34<br />
Merthyr Tydfil 0 0 26 2 11<br />
Monmouthshire 126 3 120 25 101<br />
Neath Port Talbot 25 23 60 42 17<br />
Newport 263 108 18 180 58<br />
Pembrokeshire 8 14 35 82 9<br />
Powys 89 31 29 8 16<br />
Rhondda Cynon Taff 52 20 85 46 33<br />
Swansea 194 40 70 101 54<br />
Torfaen 2 19 17 13 52<br />
Vale of Glamorgan 1 29 5 0 44<br />
Wrexham 46 18 30 21 38<br />
If you would like an interview to discuss this in more detail or if you require any further information, please contact Nadia Bedra on 01908 746 734 or email<br />
nbedra@nhbc.co.uk.
page 9 of 10<br />
<strong>NHBC</strong> <strong>NEW</strong> <strong>HOMES</strong><br />
<strong>STATISTICS</strong> <strong>REVIEW</strong> <strong>Q1</strong> <strong>2012</strong><br />
Appendix (continued)<br />
TABLE 4: UK PRIVATE AND PUBLIC SECTOR REGISTRATIONS AND COMPLETIONS<br />
PRIVATE SECTOR NUMBER<br />
PUBLIC SECTOR NUMBER<br />
REGISTRATIONS<br />
<strong>Q1</strong> 2008 29,140 8,700<br />
<strong>Q1</strong> 2009 8,610 7,620<br />
<strong>Q1</strong> 2010 18,410 9,560<br />
<strong>Q1</strong> 2011 19,090 10,920<br />
<strong>Q1</strong> <strong>2012</strong> 20,310 5,690<br />
COMPLETIONS<br />
<strong>Q1</strong> 2008 27,400 7,820<br />
<strong>Q1</strong> 2009 17,870 7,830<br />
<strong>Q1</strong> 2010 15,430 7,770<br />
<strong>Q1</strong> 2011 15,670 10,780<br />
<strong>Q1</strong> <strong>2012</strong> 17,010 11,690<br />
NOTES<br />
1. The above figures relate to ‘New-Build’ registrations for <strong>NHBC</strong>’s ten-year warranty in the UK.<br />
2. <strong>NHBC</strong> registration figures are obtained as follows: A builder is required to register a house with <strong>NHBC</strong> at least 21 days before building starts.<br />
3. <strong>NHBC</strong> registration figures reflect an intention to build, they may give an earlier indication of market trends.<br />
4. ‘Completions’ relate to the number of homes ‘finalled’ by <strong>NHBC</strong>’s Building Inspectors and are reported in the month they are received and processed.<br />
5. These figures are rounded.<br />
If you would like an interview to discuss this in more detail or if you require any further information, please contact Nadia Bedra on 01908 746 734 or email<br />
nbedra@nhbc.co.uk.
page 10 of 10<br />
<strong>NHBC</strong> <strong>NEW</strong> <strong>HOMES</strong><br />
<strong>STATISTICS</strong> <strong>REVIEW</strong> <strong>Q1</strong> <strong>2012</strong><br />
Appendix (continued)<br />
TABLE 5: PERCENTAGE OF HOUSE TYPES IN TOTAL REGISTRATIONS<br />
PRIVATE AND PUBLIC SECTOR – PERCENTAGE OF HOUSE TYPE IN TOTAL REGISTRATIONS<br />
COUNTRY YEAR DETACHED<br />
HOUSES<br />
DETACHED<br />
BUNGALOWS<br />
SEMI-DETACHED<br />
HOUSES<br />
TERRACED<br />
HOUSES<br />
ATTACHED<br />
BUNGALOWS<br />
England <strong>Q1</strong> 2008 13% 1% 14% 22% 1% 48%<br />
<strong>Q1</strong> 2009 13% 1% 17% 23% 2% 43%<br />
<strong>Q1</strong> 2010 14% 1% 20% 26% 1% 37%<br />
<strong>Q1</strong> 2011 14% 1% 15% 21% 0% 48%<br />
<strong>Q1</strong> <strong>2012</strong> 20% 1% 21% 23% 0% 35%<br />
Wales <strong>Q1</strong> 2008 16% 2% 17% 22% 1% 41%<br />
<strong>Q1</strong> 2009 9% 2% 17% 29% 4% 39%<br />
<strong>Q1</strong> 2010 27% 1% 28% 19% 1% 23%<br />
<strong>Q1</strong> 2011 42% 1% 25% 17% 0% 15%<br />
<strong>Q1</strong> <strong>2012</strong> 33% 1% 24% 25% 0% 17%<br />
Scotland <strong>Q1</strong> 2008 36% 2% 12% 9% 1% 40%<br />
<strong>Q1</strong> 2009 17% 2% 27% 10% 3% 41%<br />
<strong>Q1</strong> 2010 32% 3% 12% 18% 2% 34%<br />
<strong>Q1</strong> 2011 40% 2% 16% 16% 1% 25%<br />
<strong>Q1</strong> <strong>2012</strong> 33% 2% 13% 32% 1% 19%<br />
FLATS AND<br />
MAISONETTES<br />
Northern<br />
Ireland<br />
<strong>Q1</strong> 2008 32% 5% 26% 21% 0% 16%<br />
<strong>Q1</strong> 2009 21% 7% 17% 20% 2% 33%<br />
<strong>Q1</strong> 2010 22% 6% 28% 24% 0% 20%<br />
<strong>Q1</strong> 2011 40% 8% 22% 18% 0% 12%<br />
<strong>Q1</strong> <strong>2012</strong> 30% 3% 29% 23% 0% 15%<br />
United<br />
Kingdom<br />
<strong>Q1</strong> 2008 16% 1% 14% 21% 1% 46%<br />
<strong>Q1</strong> 2009 13% 1% 18% 22% 3% 42%<br />
<strong>Q1</strong> 2010 16% 1% 20% 25% 1% 36%<br />
<strong>Q1</strong> 2011 17% 1% 16% 21% 0% 45%<br />
<strong>Q1</strong> <strong>2012</strong> 22% 1% 20% 25% 1% 33%<br />
NOTES<br />
1. The above table shows the percentages of different types of homes registered by country.<br />
If you would like an interview to discuss this in more detail or if you require any further information, please contact Nadia Bedra on 01908 746 734 or email<br />
nbedra@nhbc.co.uk.<br />
<strong>NHBC</strong><br />
<strong>NHBC</strong> House, Davy Avenue, Knowlhill, Milton Keynes, Bucks MK5 8FP<br />
Tel: 0844 633 1000 Fax: 0844 633 0022 www.nhbc.co.uk<br />
F135 04/12


