Product Information IZT R3000 561.53 KB - Innovationszentrum für ...
Product Information IZT R3000 561.53 KB - Innovationszentrum für ...
Product Information IZT R3000 561.53 KB - Innovationszentrum für ...

Create successful ePaper yourself
Turn your PDF publications into a flip-book with our unique Google optimized e-Paper software.
LPI-signals (Low Probability of Intercept) as well as<br />
weak signals in the presence of strong neighboring<br />
signals.<br />
The windows based user software is well known<br />
for its simplicity, its reliability and its ease of use.<br />
Various display types like frequency, waterfall and<br />
panorama are available.<br />
When selecting a frequency of interest in the panorama<br />
scan, the receiver will immediately tune to<br />
this frequency and will display the spectrum in<br />
the main display area.<br />
Multiple channels can be demodulated simultaneously<br />
in addition to the wideband spectrum<br />
display. Simply assign a marker to the desired frequency<br />
in the spectrum and select the demodulation<br />
mode. Use the peak search functionality to<br />
assign the demodulators automatically to emissions.<br />
Horizontal lines can be used to limit the<br />
search functionality to a specific power range.<br />
The continuous peak search function uses algorithms<br />
to automatically allocate active channels to<br />
the demodulators. This is especially useful when<br />
monitoring duplex or multi-user communication<br />
on different frequencies.<br />
FFT Spectrum Analyzer<br />
The <strong>IZT</strong> <strong>R3000</strong> family offers advanced spectrum<br />
analyzer functionality based on internal FFT processing<br />
algorithms. Variable bandwidths from<br />
6.25 kHz up to 24 MHz with frequency resolutions<br />
from less than 2 Hz up to 30 kHz can be selected.<br />
Emissions can be measured using individual<br />
markers or bandwidth and power measurement<br />
guides.<br />
The marker functionality covers not only standard<br />
tasks such as normal marker, delta marker and<br />
peak search marker but also phase noise and intermodulation<br />
measurements.<br />
Spectrum data can be recorded continuously limited<br />
only by the size and speed of the controlling<br />
PC’s hard disk. When playing back these recorded<br />
files measurement and monitoring functionality<br />
such as marker- and bandwidth measurements,<br />
zoom and waterfall displays are available in the<br />
same detail as if live signals were received.<br />
All of the receiver’s functions can be remote controlled<br />
via the LAN interface. All receiver data<br />
streams (spectrum, I/Q, demodulated audio) are<br />
available via LAN as well.<br />
The receiver can be integrated into existing user<br />
environments or system solutions by either remote<br />
controlling the windows software or by<br />
low-level integration based on the LAN interface<br />
of the receiver. Further documentation is available<br />
on request.<br />
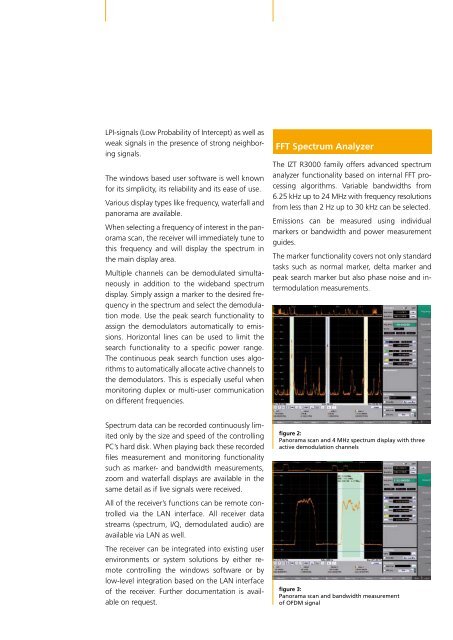
figure 2:<br />
Panorama scan and 4 MHz spectrum display with three<br />
active demodulation channels<br />
figure 3:<br />
Panorama scan and bandwidth measurement<br />
of OFDM signal