STOCK ASSESSMENT OF WHITE GRUNT FROM THE WEST ...
STOCK ASSESSMENT OF WHITE GRUNT FROM THE WEST ...
STOCK ASSESSMENT OF WHITE GRUNT FROM THE WEST ...

Create successful ePaper yourself
Turn your PDF publications into a flip-book with our unique Google optimized e-Paper software.
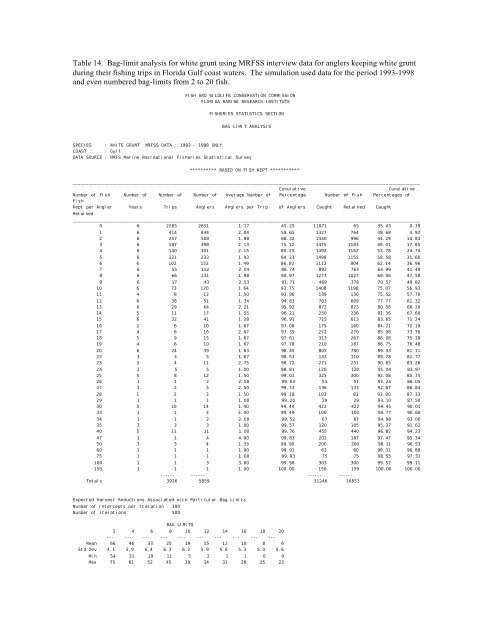
Table 14. Bag-limit analysis for white grunt using MRFSS interview data for anglers keeping white grunt<br />
during their fishing trips in Florida Gulf coast waters. The simulation used data for the period 1993-1998<br />
and even numbered bag-limits from 2 to 20 fish.<br />
FISH AND WILDLIFE CONSERVATION COMMISSION<br />
FLORIDA MARINE RESEARCH INSTITUTE<br />
FISHERIES STATISTICS SECTION<br />
BAG LIMIT ANALYSIS<br />
SPECIES : <strong>WHITE</strong> <strong>GRUNT</strong> MRFSS DATA : 1993 - 1998 ONLY<br />
COAST : Gulf<br />
DATA SOURCE : NMFS Marine Recreational Fisheries Statistical Survey<br />
********** BASED ON FISH KEPT ***********<br />
__________________________________________________________________________________________________________________________________<br />
Cumulative<br />
Cumulative<br />
Number of Fish Number of Number of Number of Average Number of Percentage Number of Fish Percentages of<br />
Fish<br />
Kept per Angler Years Trips Anglers Anglers per Trip of Anglers Caught Retained Caught<br />
Retained<br />
__________________________________________________________________________________________________________________________________<br />
0 6 2265 2651 1.17 45.25 11071 65 35.43 0.39<br />
1 6 414 844 2.04 59.65 1327 764 39.68 4.92<br />
2 6 257 508 1.98 68.32 1440 996 44.29 10.83<br />
3 6 187 398 2.13 75.12 1475 1183 49.01 17.85<br />
4 6 140 301 2.15 80.25 1492 1162 53.78 24.74<br />
5 6 121 233 1.93 84.23 1498 1155 58.58 31.60<br />
6 6 102 152 1.49 86.82 1112 904 62.14 36.96<br />
7 6 55 112 2.04 88.74 892 763 64.99 41.49<br />
8 6 66 131 1.98 90.97 1273 1027 69.06 47.58<br />
9 6 17 43 2.53 91.71 469 378 70.57 49.82<br />
10 6 73 120 1.64 93.75 1408 1198 75.07 56.93<br />
11 4 8 12 1.50 93.96 139 130 75.52 57.70<br />
12 6 38 51 1.34 94.83 703 609 77.77 61.32<br />
13 6 29 64 2.21 95.92 872 823 80.56 66.20<br />
14 5 11 17 1.55 96.21 250 236 81.36 67.60<br />
15 6 32 41 1.28 96.91 715 613 83.65 71.24<br />
16 2 6 10 1.67 97.08 175 160 84.21 72.19<br />
17 4 6 16 2.67 97.35 272 270 85.08 73.79<br />
18 5 9 15 1.67 97.61 313 267 86.08 75.38<br />
19 4 6 10 1.67 97.78 210 187 86.75 76.48<br />
20 6 24 39 1.63 98.45 805 780 89.33 81.11<br />
22 3 3 5 1.67 98.53 143 110 89.78 81.77<br />
23 3 4 11 2.75 98.72 271 251 90.65 83.26<br />
24 2 5 5 1.00 98.81 120 120 91.04 83.97<br />
25 5 8 12 1.50 99.01 325 300 92.08 85.75<br />
26 1 1 2 2.00 99.04 51 51 92.24 86.05<br />
27 2 2 5 2.50 99.13 136 133 92.67 86.84<br />
28 1 2 3 1.50 99.18 103 83 93.00 87.33<br />
29 1 1 1 1.00 99.20 29 29 93.10 87.50<br />
30 5 10 14 1.40 99.44 422 422 94.45 90.01<br />
33 1 1 3 3.00 99.49 100 100 94.77 90.60<br />
34 1 1 2 2.00 99.52 67 67 94.98 91.00<br />
35 3 3 3 1.00 99.57 120 105 95.37 91.62<br />
40 5 11 11 1.00 99.76 455 440 96.82 94.23<br />
47 1 1 4 4.00 99.83 202 187 97.47 95.34<br />
50 3 3 4 1.33 99.90 200 200 98.11 96.53<br />
60 1 1 1 1.00 99.91 63 60 98.31 96.88<br />
75 1 1 1 1.00 99.93 75 75 98.55 97.33<br />
100 1 1 3 3.00 99.98 303 300 99.52 99.11<br />
150 1 1 1 1.00 100.00 150 150 100.00 100.00<br />
------ ------ ------ ------<br />
Totals 3926 5859 31246 16853<br />
Expected Harvest Reductions Associated with Particular Bag Limits<br />
Number of Intercepts per Iteration 300<br />
Number of Iterations 500<br />
BAG LIMITS<br />
2 4 6 8 10 12 14 16 18 20<br />
--- --- --- --- --- --- --- --- --- ---<br />
Mean 66 46 33 25 19 15 12 10 8 6<br />
Std Dev 4.1 5.9 6.4 6.3 6.2 5.9 5.6 5.3 5.0 4.6<br />
Min 54 31 19 11 5 2 1 1 0 0<br />
Max 75 61 52 45 39 34 31 28 25 23