Seager et al., 2007
Seager et al., 2007
Seager et al., 2007

Create successful ePaper yourself
Turn your PDF publications into a flip-book with our unique Google optimized e-Paper software.
Model Projections of an Imminent Transition to a<br />
More Arid Climate in Southwestern North America<br />
Richard <strong>Seager</strong>, <strong>et</strong> <strong>al</strong>.<br />
Science 316, 1181 (<strong>2007</strong>);<br />
DOI: 10.1126/science.1139601<br />
The following resources related to this article are available online at<br />
www.sciencemag.org (this information is current as of August 18, 2008 ):<br />
Updated information and services, including high-resolution figures, can be found in the online<br />
version of this article at:<br />
http://www.sciencemag.org/cgi/content/full/316/5828/1181<br />
This article cites 19 articles, 2 of which can be accessed for free:<br />
http://www.sciencemag.org/cgi/content/full/316/5828/1181#otherarticles<br />
This article has been cited by 25 article(s) on the ISI Web of Science.<br />
This article has been cited by 1 articles hosted by HighWire Press; see:<br />
http://www.sciencemag.org/cgi/content/full/316/5828/1181#otherarticles<br />
This article appears in the following subject collections:<br />
Atmospheric Science<br />
http://www.sciencemag.org/cgi/collection/atmos<br />
Information about obtaining reprints of this article or about obtaining permission to reproduce<br />
this article in whole or in part can be found at:<br />
http://www.sciencemag.org/about/permissions.dtl<br />
Downloaded from www.sciencemag.org on August 18, 2008<br />
Science (print ISSN 0036-8075; online ISSN 1095-9203) is published weekly, except the last week in December, by the<br />
American Association for the Advancement of Science, 1200 New York Avenue NW, Washington, DC 20005. Copyright<br />
<strong>2007</strong> by the American Association for the Advancement of Science; <strong>al</strong>l rights reserved. The title Science is a<br />
registered trademark of AAAS.
REPORTS<br />
3. F. H. Shu, H. Shang, A. E. Glassgold, T. Lee, Science 277,<br />
1475 (1997).<br />
4. B. S. Meyer, in Chondrites and the Protoplan<strong>et</strong>ary Disk,<br />
A. N. Krot, E. R. D. Scott, B. Reipurth, Eds. (Astrophysic<strong>al</strong><br />
Soci<strong>et</strong>y of the Pacific, San Francisco, CA, 2005),<br />
pp. 515–526.<br />
5. S. Tachibana, G. R. Huss, N. T. Kita, G. Shimoda,<br />
Y. Morishita, Astrophys. J. 639, L87 (2006).<br />
6. S. Mostefaoui, G. W. Lugmair, P. Hoppe, Astrophys. J.<br />
625, 271 (2005).<br />
7. A. Shukolyukov, G. W. Lugmair, Earth Plan<strong>et</strong>. Sci. L<strong>et</strong>t.<br />
119, 159 (1993).<br />
8. M. Bizzarro, J. A. Baker, H. Haack, K. L. Lundgaard,<br />
Astrophys. J. 632, L41 (2005).<br />
9. A. N. H<strong>al</strong>liday, T. Kleine, in M<strong>et</strong>eorites and the Early Solar<br />
System II, D. S. Laur<strong>et</strong>ta, H. Y. McSween, Eds. (Univ. of<br />
Arizona Press, Tucson, AZ, 2006), pp. 775–801.<br />
10. N. Kita <strong>et</strong> <strong>al</strong>., in Chondrites and the Protoplan<strong>et</strong>ary Disk,<br />
A. N. Krot, E. R. D. Scott, B. Reipurth, Eds. (Astrophysic<strong>al</strong><br />
Soci<strong>et</strong>y of the Pacific, San Francisco, CA, 2005),<br />
pp. 558–587.<br />
11. Materi<strong>al</strong>s and m<strong>et</strong>hods are available as supporting<br />
materi<strong>al</strong> on Science Online.<br />
12. Y. Amelin, A. N. Krot, I. D. Hutcheon, A. A. Ulyanov,<br />
Science 297, 1678 (2002).<br />
13. J. Baker, M. Bizzarro, N. Wittig, J. Connelly, H. Haack,<br />
Nature 436, 1127 (2005).<br />
14. Y. Amelin, Lunar Plan<strong>et</strong>. Sci. XXXVIII, 1669 (abstr.) (<strong>2007</strong>).<br />
15. J. A. Baker, M. Bizzarro, abstract 8612 presented at the<br />
Protostars and Plan<strong>et</strong>s V me<strong>et</strong>ing, Hilton Waikoloa<br />
Village, HI, 24 to 28 October 2005.<br />
16. A. Trinquier, J.-L. Birck, C. Allègre, Astrophys. J. 655,<br />
1179 (<strong>2007</strong>).<br />
17. J. H. Jones, M. J. Drake, Geochim. Cosmochim. Acta 47,<br />
1199 (1983).<br />
18. K. Thrane, M. Bizzarro, J. A. Baker, Astrophys. J. 646,<br />
L159 (2006).<br />
19. A. P<strong>al</strong>acios <strong>et</strong> <strong>al</strong>., Astron. Astrophys. 429, 613 (2005).<br />
20. M. Limongi, A. Chieffi, Astrophys. J. 647, 483 (2006).<br />
21. M. Arnould, S. Goriely, G. Meyn<strong>et</strong>, Astron. Astrophys.<br />
453, 653 (2006).<br />
22. G. Meyn<strong>et</strong>, A. Maeder, Astron. Astrophys. 429, 581 (2005).<br />
23. D. P. Glavin, A. Kubny, E. Jagoutz, G. W. Lugmair,<br />
M<strong>et</strong>eorit. Plan<strong>et</strong>. Sci. 39, 693 (2004).<br />
24. A. Markowski <strong>et</strong> <strong>al</strong>., M<strong>et</strong>eorit. Plan<strong>et</strong>. Sci. 41, 5195<br />
(abstr.) (2006).<br />
25. J. J. Hester, S. J. Desch, in Chondrites and the<br />
Protoplan<strong>et</strong>ary Disk, A. N. Krot, E. R. D. Scott,<br />
B. Reipurth, Eds. (Astrophysic<strong>al</strong> Soci<strong>et</strong>y of the Pacific,<br />
San Francisco, CA, 2005), pp. 107–130.<br />
Model Projections of an Imminent<br />
Transition to a More Arid Climate in<br />
Southwestern North America<br />
Richard <strong>Seager</strong>, 1 * Mingfang Ting, 1 Isaac Held, 2,3 Yochanan Kushnir, 1 Jian Lu, 4<br />
Gabriel Vecchi, 2 Huei-Ping Huang, 1 Nili Harnik, 5 Ants Le<strong>et</strong>maa, 2 Ngar-Cheung Lau, 2,3<br />
Cuihua Li, 1 Jennifer Velez, 1 Naomi Naik 1<br />
How anthropogenic climate change will affect hydroclimate in the arid regions of southwestern<br />
North America has implications for the <strong>al</strong>location of water resources and the course of region<strong>al</strong><br />
development. Here we show that there is a broad consensus among climate models that this region<br />
will dry in the 21st century and that the transition to a more arid climate should <strong>al</strong>ready be under<br />
way. If these models are correct, the levels of aridity of the recent multiyear drought or the Dust<br />
Bowl and the 1950s droughts will become the new climatology of the American Southwest within a<br />
time frame of years to decades.<br />
The Third Assessment Report of the Intergovernment<strong>al</strong><br />
Panel on Climate Change<br />
(IPCC) reported that the average of <strong>al</strong>l the<br />
participating models showed a gener<strong>al</strong> decrease in<br />
rainf<strong>al</strong>l in the subtropics during the 21st century,<br />
<strong>al</strong>though there was <strong>al</strong>so considerable disagreement<br />
among the models (1). Subtropic<strong>al</strong><br />
drying accompanying rising CO 2 was <strong>al</strong>so found<br />
in the models participating in the second Coupled<br />
Model Intercomparison Project (2). We examined<br />
future subtropic<strong>al</strong> drying by an<strong>al</strong>yzing the time<br />
history of precipitation in 19 climate models<br />
participating in the Fourth Assessment Report<br />
1 Lamont Doherty Earth Observatory (LDEO), Columbia<br />
University, P<strong>al</strong>isades, NY 10964, USA.<br />
2 Nation<strong>al</strong> Oceanic<br />
and Atmospheric Administration (NOAA) Geophysic<strong>al</strong> Fluid<br />
Dynamics Laboratory, Princ<strong>et</strong>on, NJ 08540, USA. 3 Program in<br />
Atmospheric and Oceanic Sciences, Department of Geosciences,<br />
Princ<strong>et</strong>on University, Princ<strong>et</strong>on, NJ 08544, USA.<br />
4 Nation<strong>al</strong> Center for Atmospheric Research, Boulder, CO<br />
80307, USA.<br />
5 Tel Aviv University, Tel Aviv, Israel.<br />
*To whom correspondence should be addressed. E-mail:<br />
seager@ldeo.columbia.edu<br />
(AR4) of the IPCC (3). The future climate<br />
projections followed the A1B emissions scenario<br />
(4), in which CO 2 emissions increase until about<br />
2050 and decrease modestly thereafter, leading to<br />
a CO 2 concentration of 720 parts per million in<br />
2100. We <strong>al</strong>so an<strong>al</strong>yzed the simulations by these<br />
models for the 1860–2000 period, in which the<br />
models were forced by the known history of trace<br />
gases and estimated changes in solar irradiance,<br />
volcanic and anthropogenic aerosols, and land use<br />
(with some variation among the models). These<br />
simulations provided initi<strong>al</strong> conditions for the<br />
21st-century climate projections. For each model,<br />
climatologies were computed for the 1950–2000<br />
period by averaging over <strong>al</strong>l the simulations<br />
available for each model. All climate changes<br />
shown here are departures from this climatology.<br />
We define an area (shown as a box in Fig. 4A)<br />
c<strong>al</strong>led “the Southwest” (including <strong>al</strong>l land<br />
b<strong>et</strong>ween 125°W and 95°W and 25°N and 40°N)<br />
that incorporates the southwestern United States<br />
and parts of northern Mexico. Figure 1 shows the<br />
modeled history and future of the annu<strong>al</strong> mean<br />
26. J. M. Rathborne <strong>et</strong> <strong>al</strong>., Mon. Not. R. Astron. Soc. 331, 85<br />
(2002).<br />
27. N. Ouell<strong>et</strong>te, S. J. Desch, J. J. Hester, L. A. Leshin, in<br />
Chondrites and the Protoplan<strong>et</strong>ary Disk, A. N. Krot,<br />
E. R. D. Scott, B. Reipurth, Eds. (Astrophysic<strong>al</strong> Soci<strong>et</strong>y of<br />
the Pacific, San Francisco, CA, 2005), pp. 527–538.<br />
28. A. P. Boss, M<strong>et</strong>eorit. Plan<strong>et</strong>. Sci. 41, 1695 (2006).<br />
29. S. E. Woosley, Astrophys. J. 476, 801 (1997).<br />
30. M. J. Drake, K. Righter, Nature 416, 39 (2002).<br />
31. A. Shukolyukov, G. W. Lugmair, Lunar Plan<strong>et</strong>. Sci.<br />
XXXVII, 1478 (abstr.) (2006).<br />
32. Financi<strong>al</strong> support for this project was provided by the<br />
Danish Nation<strong>al</strong> Science Foundation, NASA’s<br />
Cosmochemistry Program, and the Danish Natur<strong>al</strong><br />
Science Research Council.<br />
Supporting Online Materi<strong>al</strong><br />
www.sciencemag.org/cgi/content/full/316/5828/1178/DC1<br />
Materi<strong>al</strong>s and M<strong>et</strong>hods<br />
SOM Text<br />
Tables S1 and S2<br />
References<br />
8 February <strong>2007</strong>; accepted 27 March <strong>2007</strong><br />
10.1126/science.1141040<br />
precipitation minus the evaporation (P − E), averaged<br />
over this region for the period common to <strong>al</strong>l<br />
of the models (1900–2098). The median, 25th,<br />
and 75th percentiles of the model P − E distribution<br />
and the median of P and E are shown.<br />
For cases in which there were multiple simulations<br />
with a single model, data from these simulations<br />
were averaged tog<strong>et</strong>her before computing<br />
the distribution. P − E equ<strong>al</strong>s the moisture convergence<br />
by the atmospheric flow and (over land)<br />
the amount of water that goes into runoff.<br />
In the multimodel ensemble mean, there is a<br />
transition to a sustained drier climate that begins in<br />
the late 20th and early 21st centuries. In the<br />
ensemble mean, both P and E decrease, but the<br />
former decreases by a larger amount. P − E is<br />
primarily reduced in winter, when P decreases and<br />
E is unchanged or modestly increased, whereas in<br />
summer, both P and E decrease. The annu<strong>al</strong> mean<br />
reduction in P for this region, c<strong>al</strong>culated from rain<br />
gauge data within the Glob<strong>al</strong> Historic<strong>al</strong> Climatology<br />
N<strong>et</strong>work, was 0.09 mm/day b<strong>et</strong>ween 1932 and<br />
1939 (the Dust Bowl drought) and 0.13 mm/day<br />
b<strong>et</strong>ween 1948 and 1957 (the 1950s Southwest<br />
drought). The ensemble median reduction in P that<br />
drives the reduction in P − E reaches 0.1 mm/day in<br />
midcentury, and one quarter of the models reach<br />
this amount in the early part of the current century.<br />
The annu<strong>al</strong> mean P − E difference b<strong>et</strong>ween<br />
20-year periods in the 21st century and the<br />
1950–2000 climatology for the 19 models are<br />
shown in Fig. 2. Almost <strong>al</strong>l models have a drying<br />
trend in the American Southwest, and they consistently<br />
become drier throughout the century.<br />
Only 1 of the 19 models has a trend toward a<br />
w<strong>et</strong>ter climate. Of the tot<strong>al</strong> of 49 individu<strong>al</strong><br />
projections conducted with the 19 models, even<br />
as early as the 2021–2040 period, only 3 projections<br />
show a shift to a w<strong>et</strong>ter climate. Examples<br />
of modeled history and future precipitation for<br />
single simulations of four individu<strong>al</strong> models are<br />
shown in Fig. 3 and provide an idea of potenti<strong>al</strong><br />
trajectories toward the more arid climate.<br />
Downloaded from www.sciencemag.org on August 18, 2008<br />
www.sciencemag.org SCIENCE VOL 316 25 MAY <strong>2007</strong> 1181
REPORTS<br />
The contours in Fig. 4, A to C, show a<br />
map of the change in P − E for the decades<br />
b<strong>et</strong>ween 2021 and 2040 minus those in the<br />
1950–2000 period for one of the IPCC models:<br />
the Geophysic<strong>al</strong> Fluid Dynamics Laboratory<br />
(GFDL) climate model CM2.1 (5). In gener<strong>al</strong>,<br />
large regions of the relatively dry subtropics dry<br />
further, whereas w<strong>et</strong>ter, higher-latitude regions<br />
become w<strong>et</strong>ter still. In addition to the American<br />
Southwest, the southern Europe–Mediterranean–<br />
Middle East region <strong>al</strong>so experiences a severe<br />
drying. This pattern of subtropic<strong>al</strong> drying and<br />
moistening at higher latitudes is a robust feature<br />
of current projections with different models of<br />
future climate (6).<br />
The change (d) in P − E (in m<strong>et</strong>ers per<br />
second) is b<strong>al</strong>anced by a change in atmospheric<br />
moisture convergence, namely<br />
Z ps<br />
r w gdðP − EÞ ¼ −d ∇ ⋅ ðuqÞdp þ<br />
0<br />
Z ps<br />
<br />
∇ ⋅ ðuq′Þdp<br />
0<br />
ð1Þ<br />
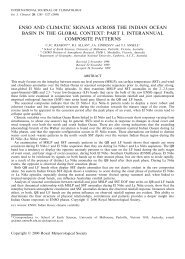
Fig. 1. Modeled changes in annu<strong>al</strong> mean precipitation minus evaporation over the American Southwest<br />
(125°W to 95°W and 25°N to 40°N, land areas only), averaged over ensemble members for each of the 19<br />
models. The historic<strong>al</strong> period used known and estimated climate forcings, and the projections used the<br />
SResA1B emissions scenario. The median (red line) and 25th and 75th percentiles (pink shading) of the P −<br />
E distribution among the 19 models are shown, as are the ensemble medians of P (blue line) and E (green<br />
line) for the period common to <strong>al</strong>l models (1900–2098). Anom<strong>al</strong>ies (Anom) for each model are relative to<br />
that model's climatology from 1950–2000. Results have been 6-year low-pass Butterworth-filtered to<br />
emphasize low-frequency variability that is of most consequence for water resources. The model ensemble<br />
mean P − E in this region is around 0.3 mm/day.<br />
Overbars indicate monthly means, primes<br />
represent departures from the monthly mean, r w<br />
is the density of water, g indicates the acceleration<br />
due to gravity, and ∇ indicates the horizont<strong>al</strong><br />
divergence operator. The change in moisture convergence<br />
can be divided into contributions from the<br />
mean flow and from eddies. In the former, the<br />
atmospheric flow ðuÞ and the moisture ðqÞ are<br />
averaged over a month before computing the<br />
moisture transport, whereas the latter is primarily<br />
associated with the highly variable wind (u′) and<br />
moisture (q′) fields within storm systems. The<br />
moisture convergence is integrated over the pressure<br />
( p) from the top of the atmosphere ( p = 0) to<br />
the surface ( p s ). The mean wind and humidity<br />
fields in Eq. 1 can be taken to be their climatologic<strong>al</strong><br />
fields. (The rectification of interannu<strong>al</strong><br />
variability in the monthly mean flow and moisture<br />
fields is found to be negligible.) Changes in<br />
the mean flow contribution can, in turn, be approximated<br />
by one part associated with the<br />
climatologic<strong>al</strong> circulation from 1950 to 2000<br />
ðu P Þ, operating on the increase in climatologic<strong>al</strong><br />
atmospheric humidity ðdq, a consequence of<br />
atmospheric warming), and by another part due<br />
to the change in circulation climatology ðduÞ,<br />
operating on the atmospheric humidity climatology<br />
from 1950 to 2000 ðq P Þ. The nonlinear term<br />
involving changes in both the mean flow and the<br />
moisture field is found to be relatively sm<strong>al</strong>l.<br />
Hence, Eq. 1 can be approximated by:<br />
Z ps<br />
r w gdðP − EÞ e −<br />
0<br />
Z ps<br />
−d<br />
0<br />
∇ ⋅ ðq P d u þ u P dqÞdp<br />
∇ ⋅ ðu′q′Þdp<br />
ð2Þ<br />
We therefore think in terms of a threefold<br />
decomposition of P − E, as displayed in Fig. 4<br />
(colors) for the GFDL CM2.1 model: (i) a<br />
contribution from the change in mean circulation,<br />
(ii) a contribution from the change in mean<br />
humidity, and (iii) a contribution from eddies.<br />
Downloaded from www.sciencemag.org on August 18, 2008<br />
Fig. 2. The change in annu<strong>al</strong> mean P − E over the American Southwest (125°W to<br />
95°Wand 25°N to 40°N, land areas only) for 19 models (listed at left), relative to<br />
model climatologies from 1950–2000. Results are averaged over 20-year segments<br />
of the current century. The number of ensemble members for each projection is<br />
listed by the model name at left. Black dots represent ensemble members (where<br />
available), and red dots represent the ensemble mean for each model.<br />
1182<br />
25 MAY <strong>2007</strong> VOL 316 SCIENCE www.sciencemag.org
REPORTS<br />
Fig. 3. The change in<br />
annu<strong>al</strong> mean P − E over<br />
the American Southwest<br />
(125°W to 95°W and<br />
25°N to 40°N, land<br />
areas only) for four<br />
coupled models, relative<br />
to model ensemblemean<br />
climatologies from<br />
1950–2000. The results<br />
are from individu<strong>al</strong> simulations<br />
of the 1860–<br />
2000 period, forced by<br />
known and estimated<br />
climate forcings and individu<strong>al</strong><br />
projections of<br />
future climate with the<br />
SResA1B scenarios of<br />
climate forcings. Because<br />
the modeled anom<strong>al</strong>ies<br />
have not been averaged<br />
tog<strong>et</strong>her here, these time<br />
series provide an idea<br />
of plausible evolutions<br />
of Southwest climate<br />
toward a more arid<br />
state. The models are<br />
the Nation<strong>al</strong> Center for<br />
Atmospheric Research<br />
Community Climate<br />
System Model (CCSM),<br />
GFDL model CM2.1,<br />
Max Planck Institut Für<br />
M<strong>et</strong>eorologie model<br />
ECHAM5, and Hadley Centre for Climate Change model HadCM3. All time series are for annu<strong>al</strong><br />
mean data, and a 6-year low-pass Butterworth filter has been applied.<br />
The mean flow convergence term involving<br />
only changes in humidity (Fig. 4B) causes<br />
increasing P − E in regions of low-level mean<br />
mass convergence and decreasing P − E in regions<br />
of low-level mean mass divergence, gener<strong>al</strong>ly<br />
intensifying the existing pattern of P − E (6). This<br />
term helps to explain much of the reduction in P −<br />
E over the subtropic<strong>al</strong> oceans, where there is strong<br />
evaporation, atmospheric moisture divergence, and<br />
low precipitation (6). Over land areas in gener<strong>al</strong>,<br />
there is no infinite surface-water source, and P − E<br />
has to be positive and sustained by atmospheric<br />
moisture convergence. Over the American Southwest,<br />
in the current climate, it is the time-varying<br />
flow that sustains most of the positive P − E,<br />
whereas the mean flow diverges moisture away.<br />
Here, the “humidity contribution” leads to reduced<br />
P − E, as the moisture divergence by the mean flow<br />
increases with rising humidity. Over the Mediterranean<br />
region, there is mean moisture divergence,<br />
and rising humidity again leads to increased mean<br />
moisture divergence and reduced P − E.<br />
Over the ocean, the contribution of humidity<br />
changes to changes in P − E can be closely approximated<br />
by assuming that the relative humidity<br />
remains fixed at its 1950–2000 v<strong>al</strong>ues (6). Over<br />
<strong>al</strong>most <strong>al</strong>l land areas and especi<strong>al</strong>ly over those<br />
that have reduced P − E, the relative humidity<br />
decreases in the early 21st century. This is because,<br />
unlike over the ocean, evaporation cannot<br />
keep pace with the rising saturation humidity of<br />
the warming atmosphere. Over land, the humidity<br />
contribution to the change in P − E is distinct<br />
from that associated with fixed relative humidity.<br />
Decreases in P − E can <strong>al</strong>so be sustained by<br />
changes in atmospheric circulation that <strong>al</strong>ter the<br />
mean moisture convergence, even in the absence<br />
of changes in humidity (Fig. 4A). This “mean<br />
circulation contribution” leads to reduced P − E<br />
at the northern edge of the subtropics (e.g., the<br />
Mediterranean region, the Pacific and the Atlantic<br />
around 30°N, and parts of southwestern North<br />
America). The change in moisture convergence<br />
by the transient eddies (Fig. 4C) dries southern<br />
Europe and the subtropic<strong>al</strong> Atlantic and moistens<br />
the higher-latitude Atlantic, but it does not have a<br />
coherent and large impact over North America.<br />
A substanti<strong>al</strong> portion of the mean circulation<br />
contribution, especi<strong>al</strong>ly in winter, can be accounted<br />
for by the change in zon<strong>al</strong> mean flow<br />
<strong>al</strong>one (not shown in the figures), indicating that<br />
changes in the Hadley Cell and the extratropic<strong>al</strong><br />
mean meridion<strong>al</strong> circulation are important. Increases<br />
in humidity and mean moisture divergence,<br />
changes in atmospheric circulation, and<br />
the intensification of eddy moisture divergence<br />
cause drying in the subtropics, including the<br />
area over western North America and the Mediterranean<br />
region. For the Southwest region, the<br />
annu<strong>al</strong> mean P − E decreases by 0.086 mm/day,<br />
which is largely accounted for by an increase in<br />
the mean flow moisture divergence. Changes in<br />
the circulation <strong>al</strong>one contribute 0.095 mm/day of<br />
drying, and changes in the humidity <strong>al</strong>one<br />
contribute 0.032 mm/day. These changes are<br />
modestly offs<strong>et</strong> by an increased transient-eddy<br />
moisture convergence of 0.019 mm/day. (7).<br />
Within models, the poleward edge of the<br />
Hadley Cell and the mid-latitude westerlies move<br />
poleward during the 21st century (8–10). The<br />
descending branch of the Hadley Cell causes<br />
aridity, and hence the subtropic<strong>al</strong> dry zones expand<br />
poleward. In models, a poleward circulation<br />
shift can be forced by rising tropic<strong>al</strong> sea surface<br />
temperatures (SSTs) in the Indo-Pacific region (11)<br />
and by uniform surface warming (12). The latter<br />
results are relevant because the spati<strong>al</strong> pattern of<br />
surface warming in the AR4 models is quite uniform<br />
away from the poles. One explanation (13, 14)<br />
is that rising tropospheric static stability, an established<br />
consequence of moist thermodynamics,<br />
stabilizes the subtropic<strong>al</strong> j<strong>et</strong> streams at the poleward<br />
flank of the Hadley Cell against baroclinic<br />
instability. Consequently, the Hadley Cell extends<br />
poleward (increasing the vertic<strong>al</strong> wind shear at its<br />
edge) to a new latitude where the shear successfully<br />
compensates for the suppression of baroclinic<br />
instability by rising static stability.<br />
Although increasing stability is likely to be a<br />
substanti<strong>al</strong> component of the fin<strong>al</strong> explanation, a<br />
fully satisfying theory for the poleward shift of the<br />
zon<strong>al</strong> mean atmospheric circulation in a warming<br />
world must account for the complex interplay b<strong>et</strong>ween<br />
the mean circulation (Hadley Cell and the<br />
mid-latitude Ferrell Cell) and the transient eddies<br />
(13, 14) that will d<strong>et</strong>ermine where precipitation<br />
will increase and decrease in the future. However,<br />
not <strong>al</strong>l of the subtropic<strong>al</strong> drying in the Southwest<br />
and Mediterranean regions can be accounted for by<br />
zon<strong>al</strong>ly symm<strong>et</strong>ric processes, and a full explanation<br />
will require attention to moisture transport<br />
within loc<strong>al</strong>ized storm tracks and stationary waves.<br />
The six severe multiyear droughts that have<br />
struck western North America in the instrument<strong>al</strong><br />
record have <strong>al</strong>l been attributed (by the use of climate<br />
models) to variations in SSTs in the tropics,<br />
particularly persistent La Niña–like SSTs in the<br />
tropic<strong>al</strong> Pacific Ocean (15–19). The projected<br />
future climate of intensified aridity in the Southwest<br />
is caused by different processes, because the<br />
models vary in their tropic<strong>al</strong> SST response to anthropogenic<br />
forcing. Instead, it is caused by rising<br />
humidity that causes increased moisture divergence<br />
and changes in atmospheric circulation cells<br />
that include a poleward expansion of the subtropic<strong>al</strong><br />
dry zones. The drying of subtropic<strong>al</strong> land<br />
areas that, according to the models, is imminent or<br />
<strong>al</strong>ready under way is unlike any climate state we<br />
have seen in the instrument<strong>al</strong> record. It is <strong>al</strong>so distinct<br />
from the multidecad<strong>al</strong> megadroughts that<br />
afflicted the American Southwest during Mediev<strong>al</strong><br />
times (20–22), which have <strong>al</strong>so been attributed to<br />
changes in tropic<strong>al</strong> SSTs (18, 23). The most severe<br />
Downloaded from www.sciencemag.org on August 18, 2008<br />
www.sciencemag.org SCIENCE VOL 316 25 MAY <strong>2007</strong> 1183
REPORTS<br />
Fig. 4. The change in annu<strong>al</strong> means of P − E for<br />
the 2021–2040 period minus the 1950–2000<br />
period [contours in (A) to (C)] and contributions to<br />
the change in vertic<strong>al</strong>ly integrated moisture convergence<br />
(colors; negative v<strong>al</strong>ues imply increased<br />
moisture divergence) by the mean flow, due to (A)<br />
changes in the flow, (B) the specific humidity, and<br />
(C) the transient-eddy moisture convergence, <strong>al</strong>l for<br />
the GFDL CM2.1 model. The box in (A) shows the<br />
area we defined as “the Southwest.”<br />
future droughts will still occur during persistent<br />
La Niña events, but they will be worse than any<br />
since the Mediev<strong>al</strong> period, because the La Niña<br />
conditions will be perturbing a base state that is<br />
drier than any state experienced recently.<br />
References and Notes<br />
1. U. Cubasch <strong>et</strong> <strong>al</strong>., in Climate Change 2000–The Scientific<br />
Basis: Contribution of Working Group I to the Third<br />
Assessment Report of the Intergovernment<strong>al</strong> Panel on<br />
Climate Change, J. T. Houghton <strong>et</strong> <strong>al</strong>., Eds. (Cambridge<br />
Univ. Press, Cambridge, 2001), pp. 525–582.<br />
2. M. R. Allen, W. J. Ingram, Nature 419, 224 (2002).<br />
3. D<strong>et</strong>ails of the models an<strong>al</strong>yzed can be found at<br />
www-pcmdi.llnl.gov/ipcc/model_documentation/<br />
ipcc_model_documentation.php, and the data can be<br />
found at https://esg.llnl.gov:8443/index.jsp.<br />
4. N. Nakicenovic, R. Swart, Eds., Speci<strong>al</strong> Report on<br />
Emissions Scenarios (Cambridge Univ. Press,<br />
New York, 2000).<br />
5. T. L. Delworth <strong>et</strong> <strong>al</strong>., J. Clim. 19, 643 (2006).<br />
6. I. M. Held, B. J. Soden, J. Clim. 19, 5686 (2006).<br />
7. The model P − E is not fully accounted for by the<br />
computed moisture flow convergence that is c<strong>al</strong>culated by<br />
taking the sum of the components of the mean flow and<br />
transient eddies (the imb<strong>al</strong>ance is 0.022 mm/day).<br />
C<strong>al</strong>culations were performed with data collected daily on<br />
the model grid using closely matching numerics, but<br />
errors could be introduced by not using a time resolution<br />
of sever<strong>al</strong> hours and by neglecting moisture diffusion<br />
(potenti<strong>al</strong>ly large over mountains), which was not<br />
archived. The data are available at http:/kage.ldeo.<br />
columbia.edu/SOURCES/.LDEO/.ClimateGroup/.GFDL.<br />
8. J. H. Yin, Geophys. Res. L<strong>et</strong>t. 32, L18701 (2005).<br />
9. P. J. Kushner, I. M. Held, T. L. Delworth, J. Clim. 14, 2238<br />
(2001).<br />
10. L. Bengtsson, K. I. Hodges, E. Roeckner, J. Clim. 19, 3518<br />
(2006).<br />
11. N.-C. Lau, A. Le<strong>et</strong>maa, M. J. Nath, J. Clim. 19, 3607 (2006).<br />
12. S. Lee, J. Atmos. Sci. 56, 1353 (1999).<br />
13. T. Schneider, Annu. Rev. Earth Plan<strong>et</strong>. Sci. 34, 655 (2006).<br />
14. C. C. W<strong>al</strong>ker, T. Schneider, J. Atmos. Sci. 63, 3333 (2006).<br />
15. 13. S. D. Schubert, M. J. Suarez, P. J. Pegion,<br />
R. D. Koster, J. T. Bacmeister, Science 303, 1855 (2004).<br />
16. S. D. Schubert, M. J. Suarez, P. J. Pegion, R. D. Koster,<br />
J. T. Bacmeister, J. Clim. 17, 485 (2004).<br />
17. R. <strong>Seager</strong>, Y. Kushnir, C. Herweijer, N. Naik, J. Velez,<br />
J. Clim. 18, 4065 (2005).<br />
18. C. Herweijer, R. <strong>Seager</strong>, E. R. Cook, Holocene 16, 159 (2006).<br />
19. H.-P. Huang, R. <strong>Seager</strong>, Y. Kushnir, Clim. Dyn. 24, 721<br />
(2005).<br />
20. S. Stine, Nature 369, 546 (1994).<br />
21. E. R. Cook, C. A. Woodhouse, C. M. Eakin, D. M. Meko,<br />
D. W. Stahle, Science 306, 1015 (2004).<br />
22. C. Herweijer, R. <strong>Seager</strong>, E. R. Cook, J. Emile-Geay,<br />
J. Clim. 20, 1353 (<strong>2007</strong>).<br />
23. E. R. Cook, R. <strong>Seager</strong>, M. A. Cane, D. W. Stahle,<br />
Earth Sci. Rev. 81, 93 (<strong>2007</strong>).<br />
24. This work was supported at LDEO by NOAA grants<br />
NA03OAR4320179 and NA06OAR4310151 and by NSF<br />
grants ATM05-01878, ATM04-34221, and ATM03-47009.<br />
We thank R. Dole, W. Robinson, and M. W<strong>al</strong>lace for<br />
useful conversations.<br />
5 January <strong>2007</strong>; accepted 26 March <strong>2007</strong><br />
Published online 5 April <strong>2007</strong>;<br />
10.1126/science.1139601<br />
Include this information when citing this paper.<br />
Downloaded from www.sciencemag.org on August 18, 2008<br />
1184<br />
25 MAY <strong>2007</strong> VOL 316 SCIENCE www.sciencemag.org