- Page 1 and 2:
Pre-salt reservoir Annual</
- Page 3 and 4:
TABLEOFCONTENTS Page ForwardLooking
- Page 5 and 6:
Item16A. Item16B. Item16C. Item16D.
- Page 7 and 8:
Thecrudeoilandnaturalgasreservedata
- Page 9 and 10:
Presaltreservoir...................
- Page 11 and 12:
ABBREVIATIONS bbl .................
- Page 13 and 14:
Since December 31, 2008, PifCo has
- Page 15 and 16:
INCOMESTATEMENTDATA—PETROBRAS Fo
- Page 17 and 18:
ExchangeRates Subject to certain p
- Page 19 and 20:
drilling operations to be curtailed
- Page 21 and 22:
Natural gas demand is also influenc
- Page 23 and 24:
Our own financialcondition and resu
- Page 25 and 26:
Developments and the perception of
- Page 27 and 28:
were incorporated in a jurisdiction
- Page 29 and 30:
companies established in Brazil and
- Page 31 and 32:
Thefollowingtablessetforthourestima
- Page 33 and 34:
See Item 5. “Operating and Financ
- Page 35 and 36:
Thefollowingmapshowsourconcessionar
- Page 37 and 38:
On December 31, 2008, we held explo
- Page 39 and 40:
The following table describes our p
- Page 41 and 42:
totalrefiningcapacityandwesupplieda
- Page 43 and 44:
Thefollowingtableshowsourmostsignif
- Page 45 and 46:
Thetablebelowshowsouroperatingfleet
- Page 47 and 48:
Our fertilizer plants in Bahia and
- Page 49 and 50:
GasandEnergyKeyStatistics 2008 200
- Page 51 and 52:
Equity Participation in Distributio
- Page 53 and 54:
and we guarantee delivery of the co
- Page 55 and 56:
As part of this national trend, we
- Page 57 and 58:
Renewable Energy and Reduction of G
- Page 59 and 60:
In 2008, our net production outside
- Page 61 and 62:
Tusan block. The discovery is not c
- Page 63 and 64:
inPasadena,Texas.InOctober2008,anar
- Page 65 and 66:
ports'locations, this process may b
- Page 67 and 68:
Property,PlantsandEquipment Petrobr
- Page 69 and 70:
Espadarte, Jubarte, Peroá and Golf
- Page 71 and 72:
We continue to evaluate and develop
- Page 73 and 74:
Our revenuesare principallyderived
- Page 75 and 76:
years: Thetablebelowshowstheamountb
- Page 77 and 78:
ImpairmentofOilandGasProperties For
- Page 79 and 80:
millionfor2008comparedtoU.S.$5,888m
- Page 81 and 82:
Corporate Our Corporate segment inc
- Page 83 and 84:
ResearchandDevelopmentExpenses Rese
- Page 85 and 86:
higher transfer prices to our other
- Page 87 and 88:
management, central administrative
- Page 89 and 90:
Management's Discussion and Analysi
- Page 91 and 92:
SalesofCrudeOilandOilProductsandSer
- Page 93 and 94:
fundsraisedbyPifCothroughtheissuanc
- Page 95 and 96:
PifCo'sShortTermBorrowings PifCo’
- Page 97 and 98:
Between March 24, 2009, and May 20,
- Page 99 and 100:
ContractualObligations Petrobras Th
- Page 101 and 102:
in cash flows does not exceed our p
- Page 103 and 104:
DerivativeTransactions SFAS 133 req
- Page 105 and 106:
FASBFSPSFAS1404andFIN46(R)8 In Dece
- Page 107 and 108:
Item6. Directors,SeniorManagementa
- Page 109 and 110:
ofPetrobrasDistribuidoraS.A.—BR.H
- Page 111 and 112:
since June 2008. Mr. Pereira gradua
- Page 113 and 114:
Compensation Petrobras For 2008, th
- Page 115 and 116:
240.10A3. The third member of our A
- Page 117 and 118:
On July 1, 2007, we implemented the
- Page 119 and 120:
23toourauditedconsolidatedfinancial
- Page 121 and 122:
Item8. FinancialInformation Petrob
- Page 123 and 124:
are pending appeal at the administr
- Page 125 and 126:
2002, and the August 11, 2004 TAC,
- Page 127 and 128:
SharePriceHistory The following tab
- Page 129 and 130:
MandatoryDistribution that exceeds
- Page 131 and 132:
electordismissmembersofourboard ofd
- Page 133 and 134:
preferredshares,holdersofpreferreds
- Page 135 and 136:
DisputeResolution Ourbylawsprovidef
- Page 137 and 138:
Directorsarenotrequiredtoownshares.
- Page 139 and 140:
MaterialContracts Petrobras For inf
- Page 141 and 142:
BrazilianTaxConsiderations General
- Page 143 and 144:
exchanges by an investor registered
- Page 145 and 146:
decisions, all in effect as of the
- Page 147 and 148:
to a U.S. holder will be allowed as
- Page 149 and 150:
Inaddition,thissummarydoesnotdiscus
- Page 151 and 152:
CommodityPriceRisk Oursalesofcrudeo
- Page 153 and 154:
Thetablebelowprovidesinformationabo
- Page 155 and 156:
Item12. DescriptionofSecuritiesothe
- Page 157 and 158:
Item16C. AuditandNonAuditFees Petro
- Page 159 and 160:
Item16G. CorporateGovernance Compar
- Page 161 and 162:
Section NewYorkStockExchangeCorpora
- Page 163 and 164:
No. Description 2.12 Indenture,da
- Page 165 and 166:
No. 33314168)). Description 2.40
- Page 167 and 168:
SIGNATURES Pursuanttotherequirement
- Page 169 and 170:
Petróleo Brasileiro S.A. - Petrobr
- Page 171 and 172:
PETRÓLEO BRASILEIRO S.A. - PETROBR
- Page 173 and 174:
A Company’s internal control over
- Page 175 and 176:
PETRÓLEO BRASILEIRO S.A. - PETROBR
- Page 177 and 178:
PETRÓLEO BRASILEIRO S.A. - PETROBR
- Page 179 and 180:
PETRÓLEO BRASILEIRO S.A. - PETROBR
- Page 181 and 182:
PETRÓLEO BRASILEIRO S.A. - PETROBR
- Page 183 and 184:
PETRÓLEO BRASILEIRO S.A. - PETROBR
- Page 185 and 186:
PETRÓLEO BRASILEIRO S.A. - PETROBR
- Page 187 and 188:
PETRÓLEO BRASILEIRO S.A. - PETROBR
- Page 189 and 190:
PETRÓLEO BRASILEIRO S.A. - PETROBR
- Page 191 and 192:
PETRÓLEO BRASILEIRO S.A. - PETROBR
- Page 193 and 194:
PETRÓLEO BRASILEIRO S.A. - PETROBR
- Page 195 and 196:
PETRÓLEO BRASILEIRO S.A. - PETROBR
- Page 197 and 198:
PETRÓLEO BRASILEIRO S.A. - PETROBR
- Page 199 and 200:
PETRÓLEO BRASILEIRO S.A. - PETROBR
- Page 201 and 202:
PETRÓLEO BRASILEIRO S.A. - PETROBR
- Page 203 and 204:
PETRÓLEO BRASILEIRO S.A. - PETROBR
- Page 205 and 206:
PETRÓLEO BRASILEIRO S.A. - PETROBR
- Page 207 and 208:
PETRÓLEO BRASILEIRO S.A. - PETROBR
- Page 209 and 210:
PETRÓLEO BRASILEIRO S.A. - PETROBR
- Page 211 and 212:
PETRÓLEO BRASILEIRO S.A. - PETROBR
- Page 213 and 214:
PETRÓLEO BRASILEIRO S.A. - PETROBR
- Page 215 and 216:
PETRÓLEO BRASILEIRO S.A. - PETROBR
- Page 217 and 218:
PETRÓLEO BRASILEIRO S.A. - PETROBR
- Page 219 and 220:
PETRÓLEO BRASILEIRO S.A. - PETROBR
- Page 221 and 222:
PETRÓLEO BRASILEIRO S.A. - PETROBR
- Page 223 and 224:
PETRÓLEO BRASILEIRO S.A. - PETROBR
- Page 225 and 226:
PETRÓLEO BRASILEIRO S.A. - PETROBR
- Page 227 and 228:
PETRÓLEO BRASILEIRO S.A. - PETROBR
- Page 229 and 230:
PETRÓLEO BRASILEIRO S.A. - PETROBR
- Page 231 and 232:
PETRÓLEO BRASILEIRO S.A. - PETROBR
- Page 233 and 234:
PETRÓLEO BRASILEIRO S.A. - PETROBR
- Page 235 and 236:
PETRÓLEO BRASILEIRO S.A. - PETROBR
- Page 237 and 238:
PETRÓLEO BRASILEIRO S.A. - PETROBR
- Page 239 and 240:
PETRÓLEO BRASILEIRO S.A. - PETROBR
- Page 241 and 242: PETRÓLEO BRASILEIRO S.A. - PETROBR
- Page 243 and 244: PETRÓLEO BRASILEIRO S.A. - PETROBR
- Page 245 and 246: PETRÓLEO BRASILEIRO S.A. - PETROBR
- Page 247 and 248: PETRÓLEO BRASILEIRO S.A. - PETROBR
- Page 249 and 250: PETRÓLEO BRASILEIRO S.A. - PETROBR
- Page 251 and 252: PETRÓLEO BRASILEIRO S.A. - PETROBR
- Page 253 and 254: PETRÓLEO BRASILEIRO S.A. - PETROBR
- Page 255 and 256: PETRÓLEO BRASILEIRO S.A. - PETROBR
- Page 257 and 258: PETRÓLEO BRASILEIRO S.A. - PETROBR
- Page 259 and 260: PETRÓLEO BRASILEIRO S.A. - PETROBR
- Page 261 and 262: PETRÓLEO BRASILEIRO S.A. - PETROBR
- Page 263 and 264: PETRÓLEO BRASILEIRO S.A. - PETROBR
- Page 265 and 266: PETRÓLEO BRASILEIRO S.A. - PETROBR
- Page 267 and 268: PETRÓLEO BRASILEIRO S.A. - PETROBR
- Page 269 and 270: PETRÓLEO BRASILEIRO S.A. - PETROBR
- Page 271 and 272: PETRÓLEO BRASILEIRO S.A. - PETROBR
- Page 273 and 274: PETRÓLEO BRASILEIRO S.A. - PETROBR
- Page 275 and 276: PETRÓLEO BRASILEIRO S.A. - PETROBR
- Page 277 and 278: PETRÓLEO BRASILEIRO S.A. - PETROBR
- Page 279 and 280: PETRÓLEO BRASILEIRO S.A. - PETROBR
- Page 281 and 282: PETRÓLEO BRASILEIRO S.A. - PETROBR
- Page 283 and 284: PETRÓLEO BRASILEIRO S.A. - PETROBR
- Page 285 and 286: PETRÓLEO BRASILEIRO S.A. - PETROBR
- Page 287 and 288: PETRÓLEO BRASILEIRO S.A. - PETROBR
- Page 289 and 290: PETRÓLEO BRASILEIRO S.A. - PETROBR
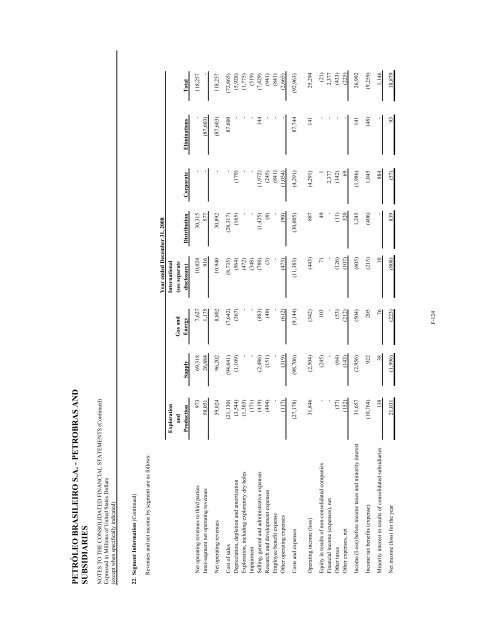
- Page 291: PETRÓLEO BRASILEIRO S.A. - PETROBR
- Page 295 and 296: PETRÓLEO BRASILEIRO S.A. - PETROBR
- Page 297 and 298: PETRÓLEO BRASILEIRO S.A. - PETROBR
- Page 299 and 300: PETRÓLEO BRASILEIRO S.A. - PETROBR
- Page 301 and 302: PETRÓLEO BRASILEIRO S.A. - PETROBR
- Page 303 and 304: PETRÓLEO BRASILEIRO S.A. - PETROBR
- Page 305 and 306: PETRÓLEO BRASILEIRO S.A. - PETROBR
- Page 307 and 308: PETRÓLEO BRASILEIRO S.A. - PETROBR
- Page 309 and 310: PETRÓLEO BRASILEIRO S.A. - PETROBR
- Page 311 and 312: PETRÓLEO BRASILEIRO S.A. - PETROBR
- Page 313 and 314: PETRÓLEO BRASILEIRO S.A. - PETROBR
- Page 315 and 316: PETRÓLEO BRASILEIRO S.A. - PETROBR
- Page 317 and 318: Petrobras International Finance Com
- Page 319 and 320: Petrobras International Finance Com
- Page 321 and 322: A company's internal control over f
- Page 323 and 324: Petrobras International Finance Com
- Page 325 and 326: Petrobras International Finance Com
- Page 327 and 328: Petrobras International Finance Com
- Page 329 and 330: Petrobras International Finance Com
- Page 331 and 332: Petrobras International Finance Com
- Page 333 and 334: Petrobras International Finance Com
- Page 335 and 336: Petrobras International Finance Com
- Page 337 and 338: Petrobras International Finance Com
- Page 339 and 340: Petrobras International Finance Com
- Page 341 and 342: Petrobras International Finance Com
- Page 343 and 344:
Petrobras International Finance Com
- Page 345 and 346:
Petrobras International Finance Com
- Page 347:
Petrobras International Finance Com






![[Traficando Conhecimento] Jéssica Balbino](https://img.yumpu.com/27871704/1/164x260/traficando-conhecimento-jacssica-balbino.jpg?quality=85)
