- Page 1: Contract No.: 0600-01-60121/0440-02
- Page 4 and 5: CONTENTS (continued) Chapter Page I
- Page 7: ACKNOWLEDGMENTS The authors would l
- Page 10 and 11: Wealthy Families. Wealth is highly
- Page 12 and 13: Growth in Aggregate Assets. The SIP
- Page 14 and 15: SIPP estimate of aggregate or mean
- Page 16 and 17: difference between SIPP and SCF est
- Page 19 and 20: I. INTRODUCTION The Office of Resea
- Page 21 and 22: At the same time, however, evidence
- Page 23 and 24: sample included about 4,300 househo
- Page 25 and 26: C. ACCOUNTING FOR DIFFERENCES IN SU
- Page 27 and 28: either the 1984 SIPP or the PSID. T
- Page 29 and 30: II. COMPARATIVE ESTIMATES OF WEALTH
- Page 31 and 32: children) or a parent and child who
- Page 33 and 34: identification of unmarried partner
- Page 35 and 36: to make comparisons with earlier SI
- Page 37 and 38: from the March 1997 CPS, and the pe
- Page 39 and 40: weights, which is reasonably close
- Page 41 and 42: Rates of home ownership are nearly
- Page 43 and 44: the marginally greater PSID populat
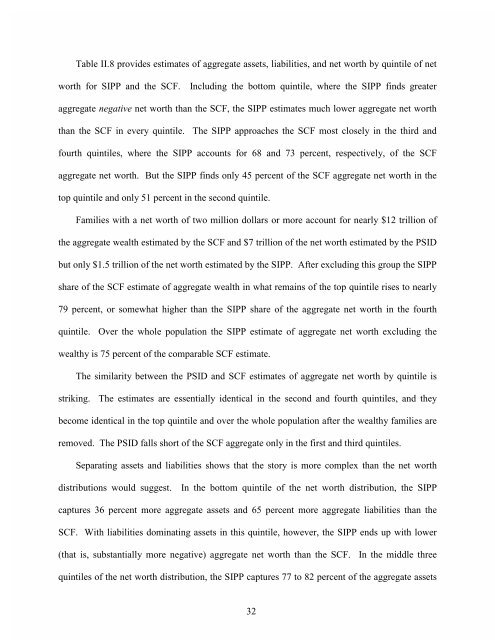
- Page 45 and 46: 3. The Distribution of Net Worth Ta
- Page 47 and 48: families and a little over 84 perce
- Page 49: which members of our expert panel r
- Page 53 and 54: ut we imposed a floor of zero. This
- Page 55 and 56: 3. Liabilities Table II.12 provides
- Page 57 and 58: 2. Assets and liabilities not measu
- Page 59 and 60: y only one percent, which provides
- Page 61 and 62: underreporting of amounts. Conditio
- Page 63 and 64: ownership rates across the three su
- Page 65 and 66: more slowly than the SCF estimates
- Page 67 and 68: What is immediately evident is an a
- Page 69 and 70: donors to cases with missing values
- Page 71 and 72: SIPP shows 81 percent growth in fin
- Page 73 and 74: III. SUBPOPULATIONS Each of SSA’s
- Page 75 and 76: differences by gender are smaller t
- Page 77 and 78: somewhat more pronounced than in th
- Page 79 and 80: Comparisons of SIPP and PSID median
- Page 81 and 82: 65.0 percent of the HRS aggregate,
- Page 83: exceeds the SIPP median by nearly $
- Page 86 and 87: wealth, and, furthermore, the Censu
- Page 88 and 89: TANF and other forms of welfare or
- Page 90 and 91: We can use the information containe
- Page 92 and 93: B. COVERAGE AND CONTENT In developi
- Page 94 and 95: We constructed an additional measur
- Page 96 and 97: Table IV.6 summarizes the effects o
- Page 98 and 99: generated under earlier jobs. The w
- Page 100 and 101:
Because of the growing importance o
- Page 102 and 103:
tax payment if the money is used fo
- Page 104 and 105:
From the marginal distribution of a
- Page 106 and 107:
suggests greater error in their wav
- Page 108 and 109:
statistics on item nonresponse. Whi
- Page 110 and 111:
2. Response Brackets One device for
- Page 112 and 113:
of the second bracket. The same is
- Page 114 and 115:
4. Motor Vehicles One area where th
- Page 116 and 117:
The deficiencies in the Census Bure
- Page 118 and 119:
A. REWEIGHTING THE SIPP DATABASE As
- Page 120 and 121:
levels in the public use version of
- Page 122 and 123:
the cash value of life insurance, a
- Page 124 and 125:
To adjust for the topcoding in the
- Page 126 and 127:
the disparity between the surveys w
- Page 128 and 129:
Checking/Savings Accounts. Only 77
- Page 130 and 131:
V.8, the fully adjusted SIPP distri
- Page 132 and 133:
here are only able to reduce the SI
- Page 134 and 135:
assets that are concentrated among
- Page 136 and 137:
of this year, and we were able to i
- Page 138 and 139:
way to do so is to use a Pareto dis
- Page 140 and 141:
insurance as well as annuities and
- Page 142 and 143:
The PSID and the HRS have had consi
- Page 144 and 145:
imputed values and a change from th
- Page 146 and 147:
institutions and in IRA and Keogh a
- Page 149 and 150:
REFERENCES Curtin, Richard, F. Thom
- Page 151:
TABLES
- Page 154 and 155:
TABLE II.1 SIPP ESTIMATES OF THE NE
- Page 156 and 157:
TABLE II.3 ESTIMATES OF NET WORTH,
- Page 158 and 159:
TABLE II.5 PERCENTILES OF NET WORTH
- Page 160 and 161:
TABLE II.6 PERCENTILES OF ASSETS AN
- Page 162 and 163:
TABLE II.7 DISTRIBUTION OF NET WORT
- Page 164 and 165:
TABLE II.9 CLASSIFICATION OF ASSETS
- Page 166 and 167:
TABLE II.11 DECOMPOSITION OF DIFFER
- Page 168 and 169:
TABLE II.13 DECOMPOSITION OF DIFFER
- Page 170 and 171:
TABLE II.15 AGGREGATE ESTIMATES OF
- Page 172 and 173:
TABLE II.17 OWNERSHIP AND CONDITION
- Page 174 and 175:
TABLE II.19 CHANGE IN SELECTED PERC
- Page 176 and 177:
TABLE II.21 SELECTED PERCENTILE VAL
- Page 178 and 179:
TABLE II.23 SELECTED PERCENTILE VAL
- Page 180 and 181:
TABLE II.25 CONSTANT DOLLAR GROWTH
- Page 182 and 183:
TABLE III.2 DISTRIBUTION OF ASSETS
- Page 184 and 185:
TABLE III.4 OPERATIONAL DEFINITIONS
- Page 186 and 187:
TABLE III.6 ESTIMATES OF MEAN AND M
- Page 188 and 189:
TABLE III.8 ESTIMATES OF NET WORTH,
- Page 190 and 191:
TABLE III.10 OWNERSHIP AND CONDITIO
- Page 192 and 193:
Table IV.1 Continued Cumulative Rat
- Page 194 and 195:
Table IV.2 Continued Ratio of Ratio
- Page 196 and 197:
TABLE IV.4 SELECTED PERCENTILES AND
- Page 198 and 199:
TABLE IV.6 COMPARISON OF SIPP AND S
- Page 200 and 201:
TABLE IV.8 PERCENTAGE DISTRIBUTION
- Page 202 and 203:
TABLE IV.10 NET WORTH OF SIPP FAMIL
- Page 204 and 205:
TABLE IV.12 COMPARISON OF SIPP AND
- Page 206 and 207:
TABLE IV.14 DISTRIBUTION OF FAMILIE
- Page 208 and 209:
TABLE IV.16 WEIGHTED CORRELATION BE
- Page 210 and 211:
TABLE IV.18 MEAN VALUE OF FIRST THR
- Page 212 and 213:
TABLE V.2 MEANS OF INDEPENDENT VARI
- Page 214 and 215:
TABLE V.2 (continued) MEANS OF INDE
- Page 216 and 217:
TABLE V.4 LEVEL AND DISTRIBUTION OF
- Page 218 and 219:
TABLE V.6 LEVEL AND DISTRIBUTION OF
- Page 220 and 221:
TABLE V.8 LEVEL AND DISTRIBUTION OF
- Page 222 and 223:
TABLE V.10 LEVEL AND DISTRIBUTION O
- Page 224 and 225:
TABLE VI.1 SIPP 1996 PANEL FILES US
- Page 227 and 228:
FIGURE V.1 DISTRIBUTION OF TOTAL RE
- Page 229 and 230:
FIGURE V.3 DISTRIBUTION OF OWN HOUS
- Page 231 and 232:
FIGURE V.5 DISTRIBUTION OF CHECKING
- Page 233 and 234:
FIGURE V.7 DISTRIBUTION OF MOTOR VE
- Page 235 and 236:
FIGURE V.9 DISTRIBUTION OF LIFE INS
- Page 237 and 238:
FIGURE V.11 DISTRIBUTION OF OTHER N
- Page 239 and 240:
FIGURE V.13 DISTRIBUTION OF TOTAL N
- Page 241 and 242:
FIGURE V.15 DISTRIBUTION OF TOTAL A
- Page 243 and 244:
FIGURE V.17 DISTRIBUTION OF TOTAL L
- Page 245:
APPENDIX A SURVEY QUESTIONS BY ASSE
- Page 248 and 249:
Assets Explicitly Covered 1996 SIPP
- Page 250 and 251:
Assets Explicitly Covered 1996 SIPP
- Page 252 and 253:
113: STOCKS AND MUTUAL FUNDS Assets
- Page 254 and 255:
114: US SAVINGS BONDS Assets Explic
- Page 256 and 257:
115: OTHER FINANCIAL ASSETS 1996 SI
- Page 258 and 259:
116: IRA AND KEOGH ACCOUNTS 1996 SI
- Page 260 and 261:
117: 401(k) AND THRIFT ACCOUNTS 199
- Page 262 and 263:
118: OTHER, QUASI-LIQUID PENSION AS
- Page 264 and 265:
118: OTHER, QUASI-LIQUID PENSION AS
- Page 266 and 267:
Assets Explicitly Covered 121: HOME
- Page 268 and 269:
Assets Explicitly Covered 123: ALL
- Page 270 and 271:
123: ALL OTHER REAL ESTATE Key Vari
- Page 272 and 273:
124: MOTOR VEHICLES 1996 SIPP, Wave
- Page 274 and 275:
125: BUSINESS EQUITY 1996 SIPP, Wav
- Page 276 and 277:
130: OTHER NON-SIPP ASSETS 1996 SIP
- Page 278 and 279:
131: SIPP PENSION ASSETS 1996 SIPP,
- Page 280 and 281:
211: MARGIN AND BROKER ACCOUNTS Ass
- Page 282 and 283:
212: MORTGAGES ON OWN HOME 1996 SIP
- Page 284 and 285:
214: PERSONAL BUSINESS DEBT Assets
- Page 286 and 287:
215: VEHICLE LOANS 1996 SIPP, Wave
- Page 288 and 289:
221: CREDIT CARD OR STORE DEBT Asse
- Page 290 and 291:
222: LOANS FROM FINANCIAL INSTITUTI
- Page 292 and 293:
223: OTHER UNSECURED LIABILITIES 19
- Page 295 and 296:
A. CODE FOR 1998 SCF *This program
- Page 297 and 298:
*[note, this is the value side of t
- Page 299 and 300:
IF EHOWNER3 = EPPPNUM THEN DO; MPR1
- Page 301 and 302:
* hmowner not in hhld in this month
- Page 303 and 304:
MPR100 = MPR110 + MPR120; /* MPR130
- Page 305 and 306:
IF ER15222 = 3 AND ER15223 = . THEN
- Page 307:
APPENDIX C EQUATION COEFFICIENTS FO
- Page 310 and 311:
APPENDIX TABLE C.2 COEFFICIENTS OF
- Page 312 and 313:
APPENDIX TABLE C.4 COEFFICIENTS OF
- Page 314 and 315:
APPENDIX TABLE C.5 (continued) COEF
- Page 316 and 317:
APPENDIX TABLE C.7 COEFFICIENTS OF


