Citigroup Global Fixed- Income Index Catalog ... - The Yield Book
Citigroup Global Fixed- Income Index Catalog ... - The Yield Book
Citigroup Global Fixed- Income Index Catalog ... - The Yield Book

Create successful ePaper yourself
Turn your PDF publications into a flip-book with our unique Google optimized e-Paper software.
See the Disclosure Appendix for the Analyst<br />
Certification and Other Disclosures.<br />
GLOBAL OCTOBER 20, 2003<br />
INDEX<br />
STRATEGY<br />
<strong>Index</strong> Guides<br />
UNITED STATES<br />
<strong>Fixed</strong>-<strong>Income</strong> <strong>Index</strong> Group<br />
(212) 816-0700<br />
fi.index@citigroup.com<br />
New York<br />
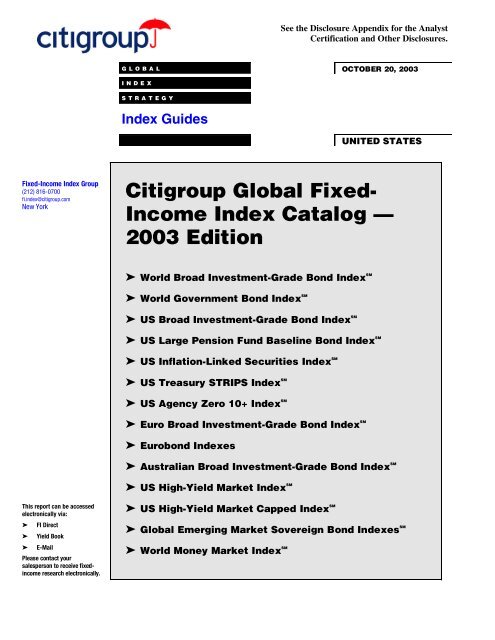
<strong>Citigroup</strong> <strong>Global</strong> <strong>Fixed</strong>-<br />
<strong>Income</strong> <strong>Index</strong> <strong>Catalog</strong> —<br />
2003 Edition<br />
➤ World Broad Investment-Grade Bond <strong>Index</strong> SM<br />
➤ World Government Bond <strong>Index</strong> SM<br />
➤ US Broad Investment-Grade Bond <strong>Index</strong> SM<br />
➤ US Large Pension Fund Baseline Bond <strong>Index</strong> SM<br />
➤ US Inflation-Linked Securities <strong>Index</strong> SM<br />
➤ US Treasury STRIPS <strong>Index</strong> SM<br />
➤ US Agency Zero 10+ <strong>Index</strong> SM<br />
➤ Euro Broad Investment-Grade Bond <strong>Index</strong> SM<br />
➤ Eurobond <strong>Index</strong>es<br />
➤ Australian Broad Investment-Grade Bond <strong>Index</strong> SM<br />
➤ US High-<strong>Yield</strong> Market <strong>Index</strong> SM<br />
This report can be accessed<br />
electronically via:<br />
➤ FI Direct<br />
➤ <strong>Yield</strong> <strong>Book</strong><br />
➤ E-Mail<br />
Please contact your<br />
salesperson to receive fixedincome<br />
research electronically.<br />
➤ US High-<strong>Yield</strong> Market Capped <strong>Index</strong> SM<br />
➤ <strong>Global</strong> Emerging Market Sovereign Bond <strong>Index</strong>es SM<br />
➤ World Money Market <strong>Index</strong> SM
come <strong>Index</strong> <strong>Catalog</strong> — 2003 Edition October 20, 2003
GLOBAL OCTOBER 20, 2003<br />
INDEX<br />
STRATEGY<br />
<strong>Citigroup</strong> <strong>Global</strong> <strong>Fixed</strong>-<br />
<strong>Income</strong> <strong>Index</strong> <strong>Catalog</strong> —<br />
2003 Edition
October 20, 2003<br />
<strong>Citigroup</strong> <strong>Global</strong> <strong>Fixed</strong>-<strong>Income</strong> <strong>Index</strong> <strong>Catalog</strong> — 2003 Edition<br />
Contents<br />
<strong>The</strong> <strong>Global</strong> <strong>Fixed</strong>-<strong>Income</strong> <strong>Index</strong> Group............................................................................................. 5<br />
Introduction...................................................................................................................................... 6<br />
Characteristics of a Good Benchmark ............................................................................................... 9<br />
General Methodology — <strong>Fixed</strong>-<strong>Income</strong> <strong>Index</strong>es ............................................................................... 10<br />
World Broad Investment-Grade (WorldBIG) Bond <strong>Index</strong> SM ............................................................... 14<br />
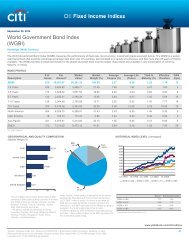
World Government Bond <strong>Index</strong> (WGBI) SM ......................................................................................... 18<br />
US Broad Investment-Grade (USBIG) Bond <strong>Index</strong> SM ......................................................................... 24<br />
US Large Pension Fund (LPF) Baseline Bond <strong>Index</strong> SM ....................................................................... 30<br />
US Inflation-Linked Securities <strong>Index</strong> SM (ILSI)................................................................................... 31<br />
US Treasury STRIPS <strong>Index</strong> SM ........................................................................................................... 32<br />
US Agency Zero 10+ <strong>Index</strong> SM ........................................................................................................... 34<br />
Euro Broad Investment-Grade (EuroBIG) Bond <strong>Index</strong> SM , EMU Government Bond <strong>Index</strong> SM , and Jumbo<br />
Pfandbrief <strong>Index</strong> SM ............................................................................................................................ 35<br />
Eurobond <strong>Index</strong>es............................................................................................................................. 37<br />
Australian Broad Investment-Grade (AusBIG) Bond <strong>Index</strong> SM ............................................................ 39<br />
US High-<strong>Yield</strong> Market <strong>Index</strong> SM ......................................................................................................... 41<br />
US High-<strong>Yield</strong> Market Capped <strong>Index</strong> SM ............................................................................................. 46<br />
<strong>Global</strong> Emerging Market Sovereign Bond <strong>Index</strong> (ESBI) SM ................................................................. 48<br />
World Money Market <strong>Index</strong> SM ........................................................................................................... 53<br />
Discontinued <strong>Index</strong>es ....................................................................................................................... 57<br />
<strong>Fixed</strong>-<strong>Income</strong> Glossary..................................................................................................................... 59<br />
4<br />
<strong>Citigroup</strong> <strong>Global</strong> Markets
October 20, 2003<br />
<strong>Citigroup</strong> <strong>Global</strong> <strong>Fixed</strong>-<strong>Income</strong> <strong>Index</strong> <strong>Catalog</strong> — 2003 Edition<br />
<strong>The</strong> <strong>Global</strong> <strong>Fixed</strong>-<strong>Income</strong> <strong>Index</strong> Group<br />
Figure 1. <strong>Citigroup</strong> <strong>Global</strong> <strong>Fixed</strong>-<strong>Income</strong> <strong>Index</strong> Group — Regional Contacts<br />
<strong>Fixed</strong>-<strong>Income</strong> <strong>Index</strong>es Regional Contacts<br />
New York London Tokyo Frankfurt<br />
Vikas Gupta Kyri Giorgi-Coll Hajime Katsumata Terence Scheit<br />
Sau-Man Kam Richard Pagan Hirofumi Koda (69) 2607-8322<br />
Lori Laureano Sanjay Rao Hideaki Takahashi<br />
Liyen Liang Rafey Sayood Ryuichi Urino<br />
Bill Lutz Etienne Varloot (03) 5574-4710<br />
Carol Sabia<br />
Andrea Zambelli<br />
(212) 816-0700 (20) 7986-3200<br />
Email Inquiry Milan Sydney<br />
fi.index@citigroup.com Alberto Colpo Steve Leong<br />
(02) 8647-4551 Sylvie Renaud-Calmel<br />
(2) 8225-4332<br />
Chicago<br />
San Francisco<br />
Julie Marsch<br />
John Hanley<br />
Jane McDonald (415) 951-1784<br />
(312) 876-8755<br />
<strong>Citigroup</strong> <strong>Global</strong> Markets 5
October 20, 2003<br />
<strong>Citigroup</strong> <strong>Global</strong> <strong>Fixed</strong>-<strong>Income</strong> <strong>Index</strong> <strong>Catalog</strong> — 2003 Edition<br />
Introduction<br />
Market performance indexes have gained in importance over time. Accordingly, it is<br />
critical for investment managers to understand the rules by which indexes are created. In<br />
this report, we review the general philosophy for building our indexes and the specific<br />
rules by which each index is constructed. One major goal of our index construction is to<br />
create relevant benchmarks that clearly measure investment opportunities. From time to<br />
time the indexes undergo composition or calculation changes, and we periodically<br />
update this report to review the changes that have occurred.<br />
This report features a separate section for each major index, discussing in detail its<br />
design and calculation assumptions. Below, we list the more significant changes that<br />
we have made since we last updated the catalog in 2001.<br />
Figure 2. <strong>Index</strong> Changes Since February 2001<br />
New <strong>Index</strong>es<br />
Inception Date<br />
Polish Government Bond <strong>Index</strong> SM May 03<br />
Singapore Government Bond <strong>Index</strong> SM May 03<br />
<strong>Global</strong> Emerging Market Sovereign Bond <strong>Index</strong> (ESBI) SM Jan 02<br />
High-<strong>Yield</strong> Market Capped <strong>Index</strong> SM Jan 02<br />
<strong>Index</strong> Changes<br />
Effective Date<br />
Brady Bond <strong>Index</strong> SM Jun 03<br />
Currency Hedging Methodology Apr 03<br />
Euro Broad Investment Grade (EuroBIG) Bond <strong>Index</strong> SM Asset Classification Jul 02<br />
<strong>Index</strong> Profile Fixing Methodology Jul 01<br />
Discontinuation of <strong>Index</strong>es<br />
Effective Date<br />
Emerging Markets Mutual Fund (EMMF) Debt <strong>Index</strong> SM Jun 03<br />
Safest of High-<strong>Yield</strong>s <strong>Index</strong> Jun 03<br />
Government and Eurobond Composite <strong>Index</strong> (GECI) SM Dec 01<br />
Source: <strong>Citigroup</strong>.<br />
6<br />
<strong>Citigroup</strong> <strong>Global</strong> Markets
October 20, 2003<br />
<strong>Citigroup</strong> <strong>Global</strong> <strong>Fixed</strong>-<strong>Income</strong> <strong>Index</strong> <strong>Catalog</strong> — 2003 Edition<br />
Historical Summary of <strong>Index</strong> Introductions<br />
Figure 3 provides a historical perspective on the major indexes we have introduced.<br />
Figure 3. Historical Summary of <strong>Index</strong> Introductions<br />
Year Introduced <strong>Index</strong> Base Date<br />
1978 US Treasury-Bill and Certificate-of-Deposit <strong>Index</strong>es Jan 78<br />
1981 World Bond <strong>Index</strong> a Jan 78<br />
1981 World Money Market <strong>Index</strong> b Jan 78<br />
1985 US Broad Investment-Grade Bond <strong>Index</strong> (USBIG <strong>Index</strong>) Jan 80<br />
1985 US Treasury Benchmark (On-the-Run) <strong>Index</strong>es Jan 80<br />
1986 World Government Bond <strong>Index</strong> (WGBI) Jan 85<br />
1986 US Large Pension Fund Baseline Bond <strong>Index</strong> (LPF <strong>Index</strong>) Jan 80<br />
1986 Long-Term High-<strong>Yield</strong> <strong>Index</strong> Jan 80<br />
1987 Targeted <strong>Index</strong> Matrix Series (TIMS) Jan 84<br />
1988 Currency-Hedged World Government Bond <strong>Index</strong> Jan 85<br />
1988 High-<strong>Yield</strong> 7+ Year <strong>Index</strong> (Formerly the High-<strong>Yield</strong> Composite <strong>Index</strong>) Jan 85<br />
1988 Core ⊕ 3 and Core ⊕ 5 <strong>Index</strong>es Jan 80<br />
1988 US Treasury <strong>Yield</strong> Curve Average <strong>Index</strong>es Jan 87<br />
1990 US High-<strong>Yield</strong> Market <strong>Index</strong> Jan 89<br />
1991 Extended High-<strong>Yield</strong> Market <strong>Index</strong> c Jan 91<br />
1991 Brady Bond <strong>Index</strong> d Apr 90<br />
1992 Group-of-Seven (G-7) Government Bond <strong>Index</strong> Jan 85<br />
1992 Group-of-Five (G-5) Government Bond <strong>Index</strong> Jan 85<br />
1992 <strong>Global</strong> Composite Government Bond <strong>Index</strong> Oct 92<br />
1994 Eurodollar Bond <strong>Index</strong> Jul 93<br />
1994 US (New) Large Pension Fund Baseline Bond <strong>Index</strong> e Jan 80<br />
1994 Emerging Markets Mutual Fund (EMMF) Debt <strong>Index</strong> f Jan 94<br />
1995 Euro-Deutschemark, Eurosterling, and Euroyen Bond <strong>Index</strong>es g Jan 95<br />
1996 Government and Eurobond Composite <strong>Index</strong> (GECI) h Jan 96<br />
1996 ECU Bond <strong>Index</strong> g Jan 96<br />
1997 US Inflation-Linked Securities <strong>Index</strong> (ILSI) Mar 97<br />
1997 Jumbo Pfandbrief <strong>Index</strong> Jul 97<br />
1998 US Treasury STRIPS <strong>Index</strong> Jan 92<br />
1998 EMU Government Bond <strong>Index</strong> (EGBI) Jan 99<br />
1998 Euro Broad Investment-Grade Bond <strong>Index</strong> (EuroBIG) Jan 99<br />
1999 Float-Adjusted Mortgage <strong>Index</strong> Jul 99<br />
2000 World Broad Investment-Grade Bond <strong>Index</strong> (WorldBIG) Jan 99<br />
2000 Australian Broad Investment-Grade Bond <strong>Index</strong> (AusBIG) Jul 99<br />
2000 US Agency Zero 10+ <strong>Index</strong> Aug 00<br />
2002 <strong>Global</strong> Emerging Market Sovereign Bond <strong>Index</strong> (ESBI) Jan 96<br />
2002 US High-<strong>Yield</strong> Market Capped <strong>Index</strong> Jan 02<br />
2003 Polish Government Bond <strong>Index</strong> Jan 00<br />
2003 Singapore Government Bond <strong>Index</strong> Jan 00<br />
a Discontinued as of December 31, 1995.<br />
b Redefined as of January 1999, with history dating to January 1998.<br />
c Discontinued as of<br />
December 31, 1998. d Market coverage of Brady Bonds was migrated to the ESBI <strong>Index</strong>. Brady Bond Performance and characteristics will be<br />
available via the Brady Bond sector of the ESBI family of indexes. e Refined as of May 1994, with history dating back to 1980. Replaced the Old<br />
LPF <strong>Index</strong> in July 1995. f Discontinued as of June 30, 2003. An Alternative to the EMMF <strong>Index</strong> is our ESBI-Capped <strong>Index</strong>, which limits exposure<br />
to any one country by placing a ceiling on the par value contribution of each country. g <strong>The</strong> Euro-Deutschemark Bond and ECU Bond indexes<br />
were discontinued as of December 31, 1998. Most members of these indexes are now included in the EuroBIG <strong>Index</strong>. h Discontinued as of<br />
December 31, 2001.<br />
<strong>Citigroup</strong> <strong>Global</strong> Markets 7
October 20, 2003<br />
<strong>Citigroup</strong> <strong>Global</strong> <strong>Fixed</strong>-<strong>Income</strong> <strong>Index</strong> <strong>Catalog</strong> — 2003 Edition<br />
Where to Find the <strong>Citigroup</strong> <strong>Fixed</strong>-<strong>Income</strong> <strong>Index</strong>es<br />
Our indexes are widely followed and widely published. We call on many methods of<br />
distribution to allow for easy access to our indexes. In this section, we highlight the<br />
distribution channels that incorporate our index products. Although the main vehicles<br />
we use to distribute index information are the <strong>Citigroup</strong> <strong>Fixed</strong>-<strong>Income</strong> Direct website<br />
and <strong>The</strong> <strong>Yield</strong> <strong>Book</strong>, one can get extensive information from several external sources.<br />
<strong>The</strong> level of data carried by these services varies from monthly sector level returns to<br />
details on the individual security holdings of each index. As with all aspects of our<br />
products, we would be happy to supplement this information in any way.<br />
Figure 4. Where to Find the <strong>Citigroup</strong> <strong>Fixed</strong>-<strong>Income</strong> <strong>Index</strong>es<br />
<strong>Citigroup</strong><br />
<strong>Citigroup</strong> DIRECT Website (http://fidirect.citigroup.com) <strong>The</strong> <strong>Yield</strong> <strong>Book</strong> ®<br />
<strong>Citigroup</strong> SmithBarney (http://www.smithbarney.com/fii) <strong>Citigroup</strong> <strong>Fixed</strong>-<strong>Income</strong> <strong>Index</strong> Help Desk:<br />
Total Rate-of-Return <strong>Index</strong>es (<strong>Citigroup</strong> monthly publication) Phone: (212) 816-0700<br />
International Market <strong>Index</strong>es (<strong>Citigroup</strong> monthly publication) E-mail: fi.index@citigroup.com<br />
Financial News Organizations<br />
Bloomberg SBI; SBBI (Downloadable)<br />
<strong>Global</strong> Money Management (Biweekly)<br />
Reuters pages SOLR-Z<br />
<strong>Global</strong> Finance (Monthly)<br />
<strong>The</strong> Economist (Weekly)<br />
International Financing Review (IFR) (Weekly)<br />
Borsen Zeitung (Daily)<br />
Latin Finance (Monthly)<br />
Il Sole-24 Ore (Daily)<br />
Financial Times (Daily)<br />
Data and Analytic Vendors<br />
ABIC<br />
Micropal<br />
Advanced Portfolio Technologies<br />
Mitsubishi Asset Brains<br />
Bank Hapoalim<br />
Mitsui Asset Trust<br />
Bank of New York<br />
Mobiüs Group<br />
BARRA<br />
MoneyMate<br />
Blackrock Solutions<br />
Morningstar, Inc.<br />
Brainpower<br />
Nikkei Quick Information Technologies<br />
Burlington Hall Asset Mgmt, Inc.<br />
Nikko Financial Intelligence<br />
Capital Mgmt Sciences (CMS)<br />
Nomura Funds Research & Technology<br />
CDA Investment Technologies<br />
Nomura Research Institute<br />
<strong>Citigroup</strong> <strong>Global</strong> Transactions Services<br />
Northern Trust<br />
Confluence Technologies<br />
Quantec Investment Technologies<br />
Daiwa Institute of Research<br />
QUICK Corporation<br />
Datastream International<br />
Ratings & Investments<br />
DPG<br />
Reuters Ltd.<br />
Effron<br />
Richards & Tierney<br />
eVestment Alliance<br />
RIMES Technologies<br />
FactSet Data Systems<br />
RiskMetrics<br />
Fininfo/Europerformance<br />
Russell/Mellon Analytical Services<br />
GreenHill Partners<br />
Shaw Data Services<br />
Haver Analytics<br />
State Street Bank and Trust<br />
Hewitt Associates<br />
Strategic Financial Solutions (Pertrac)<br />
Ibbotson Associates<br />
Sunguard/Frontier Analytics<br />
Interactive Data Corporation<br />
Thomson Investment Software<br />
Investor Force<br />
Towers Data Systems<br />
Investors Bank and Trust<br />
Trust & Custody Services Bank<br />
Japan Pension Navigator<br />
UFJ Trust Bank<br />
Japan Trustee Services Bank<br />
Vestek<br />
JP Morgan Chase Custodian<br />
Watson Wyatt K.K.<br />
Lipper Analytical Services<br />
Wilshire Associates<br />
Master Trust Bank of Japan, Ltd.<br />
Wilson Associates<br />
Mellon Bank<br />
Zephyr Associates, Inc.<br />
Source: <strong>Citigroup</strong>.<br />
8<br />
<strong>Citigroup</strong> <strong>Global</strong> Markets
October 20, 2003<br />
<strong>Citigroup</strong> <strong>Global</strong> <strong>Fixed</strong>-<strong>Income</strong> <strong>Index</strong> <strong>Catalog</strong> — 2003 Edition<br />
Characteristics of a Good Benchmark<br />
<strong>The</strong> <strong>Citigroup</strong> indexes are designed to provide relatively stable and easily replicable<br />
benchmarks. We achieved this goal by adhering to the following guidelines:<br />
➤ Relevance. An index should be relevant to investors. At a minimum, it should<br />
track those markets and market segments of most interest to investors.<br />
➤ Comprehensiveness. An index should include all opportunities that are<br />
realistically available to market participants under normal market conditions<br />
while measuring the performance of new investments and existing holdings.<br />
➤ Replicability. <strong>The</strong> total returns reported for an index should be replicable by<br />
market participants. It must be fair to investment managers who are measured<br />
against it and to sponsors who pay fees or award management assignments based<br />
on performance relative to it. Furthermore, over time, an index must represent a<br />
realistic baseline strategy that a passive investor could have followed.<br />
Accordingly, information about index composition and historical returns should<br />
be readily available.<br />
➤ Stability. An index should not change composition very often, and all changes<br />
should be easily understood and highly predictable. It should not be subject to<br />
opinions about which bonds or equities to include on any particular day.<br />
However, index composition must change occasionally to ensure that it<br />
accurately reflects the structure of the market. A key virtue of an index is to<br />
provide a passive benchmark; investors should not be forced to execute a<br />
significant number of transactions just to keep pace.<br />
➤ Barriers to entry. <strong>The</strong> markets or market segments included in an index should<br />
not contain significant barriers to entry. This guideline is especially applicable to<br />
an international index in which an included country may discourage foreign<br />
ownership of its bonds or participation in its equity market.<br />
➤ Expenses. In the normal course of investing, expenses related to withholding<br />
tax, safekeeping, and transactions are incurred. For a market or market segment<br />
to be included, these ancillary expenses should be well understood by market<br />
participants and should not be excessive. For example, if expenses are<br />
unpredictable or inconsistently applied, an index cannot hope to fairly measure<br />
market performance.<br />
➤ Simple and objective selection criteria. <strong>The</strong>re should be a clear set of rules<br />
governing inclusion of bonds, equities, or markets in an index, and investors<br />
should be able to forecast and agree on changes in composition.<br />
This list of desirable characteristics may not be exhaustive, and different investors<br />
may place different emphasis on each. In constructing indexes, some desirable<br />
characteristics may have to be sacrificed to ensure that others are met. However, it is<br />
critical that an index follows objective rules that are well defined so that all interested<br />
parties can understand how to apply the information to their particular situation.<br />
<strong>Citigroup</strong> <strong>Global</strong> Markets 9
October 20, 2003<br />
<strong>Citigroup</strong> <strong>Global</strong> <strong>Fixed</strong>-<strong>Income</strong> <strong>Index</strong> <strong>Catalog</strong> — 2003 Edition<br />
General Methodology — <strong>Fixed</strong>-<strong>Income</strong><br />
<strong>Index</strong>es<br />
All <strong>Citigroup</strong> indexes follow the general methodology outlined in this section. When<br />
necessary, we will elaborate on the explanations or provide more detailed<br />
information in a separate section on each index.<br />
Maturity and Issue Size<br />
<strong>The</strong> <strong>Citigroup</strong> fixed-income indexes measure the total rate-of-return performance for<br />
bond markets with a remaining maturity of at least one year. In addition, each market<br />
has a minimum size criterion designed to include only those bonds that are<br />
“reasonably available” for institutional investors under normal market circumstances.<br />
<strong>The</strong> specific size criterion will be discussed in the individual index sections.<br />
<strong>The</strong> money market indexes measure the performance of instruments with maturities<br />
of 12 months or less.<br />
Pricing<br />
Reliable pricing of each security in our indexes is essential to ensure reliable index<br />
values and returns. For monthly returns, traders’ bid-side prices are collected on the<br />
last business day of every month, generally at the close of the local market. All<br />
securities in our US domestic indexes and Canadian Government Bond <strong>Index</strong> are<br />
priced as of 3:00 PM New York time to reflect the futures close. In the event of an<br />
early cash or futures market close, we still use the futures close to time our pricing.<br />
For daily return calculations only, trader pricing may be supplemented with matrix<br />
pricing. When necessary, outside pricing sources are used for some securities to<br />
ensure completeness of pricing.<br />
Figure 5. Local Market Times Used for Pricing<br />
Australia 4:30 PM (Sydney) EMU Bloc 4:15 PM (London)<br />
New Zealand 4:30 PM (Wellington) Scandinavia 4:15 PM (London)<br />
Japan 3:00 PM (Tokyo) United Kingdom 4:15 PM (London)<br />
Singapore 4:30 PM (Singapore) Jumbo Pfandbrief 3:30 PM (London)<br />
Canada 3:00 PM (New York) Switzerland 5:00 PM (Zurich)<br />
United States 3:00 PM (New York) Poland 4:15 PM (Warsaw)<br />
Source: <strong>Citigroup</strong>.<br />
<strong>Index</strong> Profile<br />
With the growing importance of global indexes to fund managers throughout the<br />
world, it is important for us to communicate the new index preliminary profile on a<br />
timetable that will provide sufficient time for fund managers to respond to changes in<br />
their benchmarks within their own time zone.<br />
We publish a schedule of Fixing Dates on our <strong>Citigroup</strong> <strong>Fixed</strong>-<strong>Income</strong> DIRECT<br />
Web site and in our publications. <strong>The</strong>se dates are determined by the rule that there<br />
must be four (4) business days after the Fixing Date and before the Calendar end of<br />
10<br />
<strong>Citigroup</strong> <strong>Global</strong> Markets
October 20, 2003<br />
<strong>Citigroup</strong> <strong>Global</strong> <strong>Fixed</strong>-<strong>Income</strong> <strong>Index</strong> <strong>Catalog</strong> — 2003 Edition<br />
the month in all of the following business regions: USA, Japan, UK, EMU<br />
(specifically Germany), and Australia. 1<br />
For an issue to be eligible for inclusion in an index, all information on the issue must<br />
be publicly available on or before the Fixing Date, and the first settlement date of the<br />
issue must be on or before the end of the month. We impose this constraint to ensure<br />
the indexes are as representative as possible of the investment opportunities that exist<br />
in the markets for the period they cover.<br />
After the release of the preliminary profile and prior to the end of the month, we will<br />
continue to track market activities and will remove any issues that are called,<br />
tendered or defaulted. We also may revise the preliminary profile for corrections.<br />
At the same time, bonds that no longer meet the maturity (that is, an average life of<br />
less than one year from the last calendar day of the month), amount outstanding, or<br />
rating criteria are removed. Any buyback or reverse auction occurring on or before<br />
fixing will be removed from the index. In addition, full calls and tenders occurring<br />
between fixing and month-end and rendering a bond below the minimum amount<br />
outstanding will cause the security to be removed from the profile immediately.<br />
<strong>The</strong> index profile for the calendar month is then fixed, and all interim returns are<br />
calculated based on its composition. Reconstitution on a monthly basis, together with<br />
the large number of bonds in the indexes, provides a reasonable compromise<br />
between stability and comprehensiveness.<br />
We have timed the profile fixing to enable us to disseminate index information ahead<br />
of the month-end date so that investors have time to prepare rebalancing transactions.<br />
Settlement<br />
For daily calculations, we assume that indexes settle on a same-day basis except on<br />
the last business day of the month, when settlement is the last calendar day. Monthly<br />
holding periods, therefore, are exactly one calendar month. For example, the January<br />
return period would run from the close on December 31 to the close on January 31,<br />
regardless of the last business day. However, the last business day in each local<br />
market is used for pricing.<br />
Return Computation<br />
Total returns are computed on the assumption that each security is purchased at the<br />
beginning of the period and sold at the end of the period. (Bid-side valuations are<br />
used.) An issue’s total rate of return is the percentage change in its total value over<br />
the measurement period (see Figure 6).<br />
<strong>The</strong> components of total return are price change, principal payments, coupon<br />
payments, accrued interest, and reinvestment income on intramonth cash flows. In<br />
the case of multicurrency or nonbase indexes, the total return also includes currency<br />
movement. <strong>The</strong> total returns are market-capitalization-weighted using the security’s<br />
beginning-of-period market value.<br />
1<br />
From January 1995 to July 2001, the index fixing date was the twenty-fifth of each month.<br />
<strong>Citigroup</strong> <strong>Global</strong> Markets 11
October 20, 2003<br />
<strong>Citigroup</strong> <strong>Global</strong> <strong>Fixed</strong>-<strong>Income</strong> <strong>Index</strong> <strong>Catalog</strong> — 2003 Edition<br />
Figure 6. Total Rate-of-Return Calculation Methodology<br />
Beginning-of-Period Value = (Beginning Price + Beginning Accrued) x Beginning Par Amount Outstanding<br />
End-of-Period Value = [(Ending Price + Ending Accrued) x (Beginning Par Amt. Outstanding -<br />
Principal Payments)] + Coupon Payments + Principal Payments + Reinvestment <strong>Income</strong><br />
Total Rate of Return (%) = [(End-of-Period Value/Beginning-of-Period Value)-1] x 100<br />
A note on precision: Returns are computed to at least six decimal places but reported to a maximum of four. In addition, owing to rounding errors<br />
inherent in computer floating-point arithmetic, the last digit in any reported value may sometimes be off by one from its true value.<br />
Source: <strong>Citigroup</strong>.<br />
Return Computation — Base Currency Returns, Unhedged<br />
We calculate returns in a base currency in the following way:<br />
Figure 7. Total Rate-of-Return Calculation Methodology (Unhedged)<br />
Total Rate of Return (%) = (1+ (Local Currency Return/100)) x<br />
((End-of-Month Spot Rate/Beginning-of-Month Spot Rate)-1) x 100<br />
Source: <strong>Citigroup</strong>.<br />
This equation holds true only if the spot rates are quoted as base currency per unit of<br />
foreign currency.<br />
Return Computation — Base Currency Returns, Currency-Hedged<br />
We compute the monthly currency-hedged return by using a rolling one-month<br />
forward exchange contract as a hedging instrument. 2 <strong>The</strong> face value of the contract is<br />
equal to the estimated end-of-month full market value. To calculate this value, we<br />
assume that the bond’s yield is unchanged from the beginning of the month. We then<br />
account for any known cash flows, such as coupon or principal payments, and add in<br />
interest expected to accrue for the period. This strategy leaves unhedged the<br />
intramonth changes in bond prices from yield movements. Any principal movement<br />
resulting from yield change is then settled at end-of-month spot exchange rates. We<br />
give an example of the calculation formula from the point of view of a US investor in<br />
Figure 8.<br />
Figure 8. Currency-Hedged Monthly Return Calculation Methodology<br />
Beginning-of-Period Value<br />
[(Beginning Price + Beginning Accrued) x (Beginning Par Outstanding)] x<br />
[Beginning-of-Period Spot Exchange Rate (US dollar/Local Currency)]<br />
End-of-Period Value [(End-of-Period Local Currency Value, assuming unchanged yield +<br />
Known intramonth Cash Flows and interest expected to accrue) x<br />
Beginning-of-Period One-Month Forward Exchange Rate (US dollar/Local<br />
Currency)] +<br />
[Change in Market Value of Principal Amount Due to <strong>Yield</strong> Change x<br />
(End-of-Period Spot Exchange Rate (US dollar/Local Currency)]<br />
Total Rate of Return (%)<br />
[(End-of-Period Value/Beginning-of-Period Value)–1]*100<br />
Source: <strong>Citigroup</strong>.<br />
Maturity Sector<br />
In addition to the broad categories we publish, we provide subsector breakdowns for<br />
many of our indexes. One such subdivision is based on the remaining maturity of the<br />
2<br />
Please see Salomon Smith Barney <strong>Fixed</strong>-<strong>Income</strong> <strong>Index</strong>es: Currency Hedging Methodology, Salomon Smith Barney, March 6, 2003,<br />
for more details on currency hedging and calculation.<br />
12<br />
<strong>Citigroup</strong> <strong>Global</strong> Markets
October 20, 2003<br />
<strong>Citigroup</strong> <strong>Global</strong> <strong>Fixed</strong>-<strong>Income</strong> <strong>Index</strong> <strong>Catalog</strong> — 2003 Edition<br />
underlying securities. We define our maturity sector buckets by including all<br />
underlying issues with remaining average life at least equal to the lower bound, but<br />
less than the upper bound of the particular category. For example, the one- to threeyear<br />
sector of the USBIG <strong>Index</strong> would include all securities in the USBIG <strong>Index</strong> with<br />
remaining average life of at least one year, but less than three years. We then hold<br />
the set of bonds constant for the calculation month, even though the average life<br />
declines. <strong>The</strong> only exception to this rule is the Mortgage <strong>Index</strong>, which we include in<br />
its entirety in the one- to ten-year sector.<br />
Country-of-Issuer Classification<br />
We use the nationality of a particular issuer as another method of subdividing the<br />
index. Generally, the country of issuer is based on the domicile of the parent<br />
company. With global consolidation becoming an everyday part of business, the<br />
country-of-issuer classification can become somewhat obscure. For this<br />
classification, we have adopted the following approach:<br />
An overseas operating subsidiary assumes the nationality of its parent only if it has<br />
an explicit guarantee from its parent; otherwise, it retains its own nationality. For<br />
example, Toyota Motor Credit Corporation, an operating subsidiary of Toyota Motor<br />
Company (registered in Japan), assumes its own nationality of the United States.<br />
A special purpose, offshore, debt-issuing subsidiary assumes the nationality of its<br />
parent, whether or not guaranteed by the parent. Thus, for example, BP Capital BV (a<br />
financing vehicle registered in the Netherlands) assumes the nationality of its ultimate<br />
parent, British Petroleum Company PLC (registered in the United Kingdom).<br />
If any ambiguity exists, we rely on our corporate industry analysts to determine<br />
the classification.<br />
Rating Classification<br />
A bond is assigned its rating as of profile fixing. Each bond is assigned both an S&P<br />
and a Moody’s rating. <strong>Index</strong> quality sectors are based on the S&P rating. If a bond is<br />
not rated by S&P, we assign the S&P equivalent of the Moody’s rating to determine<br />
the bond’s sector. For split-rated bonds in an investment-grade bond index, if a bond<br />
is rated below investment-grade by S&P, we use the investment-grade Moody’s<br />
rating to assign the bond to its sector. <strong>The</strong>se ratings remain unchanged for the entire<br />
performance month.<br />
Exchange Rates<br />
<strong>The</strong> <strong>Citigroup</strong> family of global bond indexes uses the WM/Reuters Closing Spot and<br />
Forward Rates. 3 <strong>The</strong> WM Company takes several snapshots at regular intervals<br />
centered on the fixing time of 4:00 PM London time and selects the median rate for<br />
each currency. All rates are midmarket quotations and appear on Reuters (see<br />
WMRSPOT01).<br />
3<br />
See Announcing a New Standard for Exchange Rates Used in <strong>Index</strong> Calculation, Carol Sabia and Michael Sullivan, Salomon<br />
Brothers, December 2, 1993.<br />
<strong>Citigroup</strong> <strong>Global</strong> Markets 13
October 20, 2003<br />
<strong>Citigroup</strong> <strong>Global</strong> <strong>Fixed</strong>-<strong>Income</strong> <strong>Index</strong> <strong>Catalog</strong> — 2003 Edition<br />
World Broad Investment-Grade<br />
(WorldBIG) Bond <strong>Index</strong> SM<br />
We have designed the World Broad Investment-Grade (WorldBIG) <strong>Index</strong> to include<br />
those sectors in each market that are of most interest to global investors. <strong>The</strong>refore, in<br />
constructing the WorldBIG <strong>Index</strong>, we have not simply aggregated our various indexes.<br />
Rather, using the World Government Bond <strong>Index</strong> (WGBI) as the core, we have<br />
carefully chosen portions of our broad family of indexes to form the WorldBIG <strong>Index</strong>,<br />
meant for the global investor. For example, we have not included portions deemed to<br />
be specifically targeted at domestic investors. In addition, we believe it is important to<br />
consider the higher liquidity needs and higher transaction costs facing a nondomestic<br />
investor. <strong>The</strong>refore we have chosen to impose larger minimum issue sizes to help<br />
satisfy this need. We believe this results in an index that is truly focused on the large<br />
issuers that are of most interest to the traditional institutional investor base.<br />
In aggregating the sectors from the various indexes to form the WorldBIG <strong>Index</strong>, it<br />
was important to ensure consistency in terms of the definitions of the various asset<br />
class sectors across countries and currencies. This clearly delineates risks for the<br />
global investor and assists risk/reward analysis in assessing portfolio strategies. We<br />
have divided the overall index into three main asset classes: (1)<br />
Government/Government-Sponsored, (2) Collateralized, and (3) Corporate. This<br />
classification scheme differs from that used in most existing stand-alone indexes. We<br />
believe that the Government/Government-Sponsored sector, in particular, will be a<br />
key benchmark for the traditional WGBI investor as it offers a natural extension of<br />
credit risk for investors who favor traditional government debt.<br />
With these features, we believe the WorldBIG <strong>Index</strong> is a superior benchmark for the<br />
global investor. It is a liquid, replicable index. <strong>The</strong> currency allocation is<br />
representative of the investment-grade fixed-income universe of assets available to<br />
international investors. Our consistency across countries in the designation of asset<br />
class sectors assists the investor not only in risk/reward analysis, but also in ease of<br />
creating customized benchmarks that may include or omit various sectors of the full<br />
WorldBIG <strong>Index</strong>.<br />
Figure 9 describes the major indexes that make up the WorldBIG <strong>Index</strong> and how the<br />
bond inclusion criteria differ for the WorldBIG <strong>Index</strong> versus the stand-alone indexes.<br />
Figure 9. World Broad Investment Grade (WorldBIG) bond <strong>Index</strong> — Composition Comparison with Standalone<br />
<strong>Index</strong>es<br />
<strong>Index</strong> Composition as Standalone <strong>Index</strong> Composition in WorldBIG<br />
WGBI Entire <strong>Index</strong> Entire <strong>Index</strong><br />
USBIG<br />
Minimum issue size for Credit/Government-<br />
Sponsored: US$200 million.<br />
Minimum issue size for<br />
Credit/Government-Sponsored: US$500<br />
million. No zero-coupon bonds.<br />
EuroBIG Entire <strong>Index</strong> Entire <strong>Index</strong><br />
Euroyen Entire <strong>Index</strong> Entire <strong>Index</strong><br />
Eurodollar<br />
Minimum issue size: US$250 million.<br />
Minimum issue size: US$500 million.<br />
No zero-coupon bonds.<br />
Eurosterling Minimum issue size: £150 million. Minimum issue size: £300 million.<br />
Source: <strong>Citigroup</strong>.<br />
14<br />
<strong>Citigroup</strong> <strong>Global</strong> Markets
October 20, 2003<br />
<strong>Citigroup</strong> <strong>Global</strong> <strong>Fixed</strong>-<strong>Income</strong> <strong>Index</strong> <strong>Catalog</strong> — 2003 Edition<br />
Figure 10 gives a more detailed description of the design criteria and calculation<br />
assumptions of the WorldBIG <strong>Index</strong>. 4<br />
Figure 10. World Broad Investment-Grade (WorldBIG) Bond <strong>Index</strong> — Design Criteria and Calculation<br />
Assumptions<br />
Stated Coupon<br />
<strong>Fixed</strong> rate, no zero-coupon bonds except for domestic sovereign bonds (WGBI)<br />
Minimum Maturity<br />
One year<br />
Weighting<br />
Market capitalization updated once a month<br />
Minimum Size Outstanding by Currency<br />
US Dollar<br />
Domestic Sovereign: US$1 billion public amount outstanding<br />
Credit/Government-Sponsored: US$500 million<br />
Mortgage Coupon: US$5 billion (Origination year minimum: US$500 million)<br />
<strong>Global</strong>: US$500 million<br />
Eurodollar: US$500 million<br />
Japanese Yen<br />
Domestic Sovereign: ¥500, 20-year bonds are subject to a minimum of ¥450 billion.<br />
Euroyen: ¥50 billion<br />
Euro EMU Sovereigns: € € 1 billion or the equivalent for nonredenominated bonds<br />
Other: € € 500 million or the equivalent for nonredenominated bonds<br />
UK Sterling<br />
Domestic Sovereign: £410 million<br />
Eurosterling: £300 million<br />
Australian Dollar<br />
Domestic Sovereign: A$250 million net of LCIR amounts<br />
Canadian Dollar<br />
Domestic Sovereign: C$1 billion<br />
Danish Krone<br />
Domestic Sovereign: DKK10 billion<br />
Norwegian Krone<br />
Domestic Sovereign: NOK20 billion<br />
Polish Zloty<br />
Domestic Sovereign: PLN1 billion<br />
Swedish Krona<br />
Domestic Sovereign: SEK10 billion<br />
Swiss Franc<br />
Domestic Sovereign: Sfr1 billion<br />
Minimum Quality<br />
BBB-/Baa3 by either S&P or Moody's with the following exceptions: Unrated Jumbo<br />
Pfandbriefe, which are shadow-rated AAA; unrated bonds issued by or guaranteed by a<br />
sovereign or a supranational issuer, which are assigned the rating of the issuer or guarantor<br />
Redemption Features<br />
Calculation Frequency<br />
Bullet, sinking fund, puttable, extendable, or callable<br />
Daily<br />
Settlement Date<br />
Monthly: Last calendar day<br />
Daily: Same day except last business day of month, when settlement is last calendar day<br />
Reinvestment of Cash Flow Non-US markets: Eurodeposit rate; US: Treasury bill rate. At daily average of local currency<br />
one-month interest rate. Calculated from actual scheduled payment date of cash flow through<br />
end of reporting period<br />
Pricing<br />
Individual <strong>Citigroup</strong> trader pricing as of local market close for each bond at month-end, except<br />
for Swiss Treasuries where a major market maker provides prices. Some US agency/credit<br />
securities are matrixed for daily calculation only<br />
Price Adjustments<br />
Mortgages: Carry-adjusted to reflect the difference between index settlement dates and<br />
standard PSA settlement dates<br />
Volatility<br />
US Non-Mortgages: 10% single volatility<br />
US Mortgages: Market-implied volatility (two-factor model) a<br />
Base Date January 1999<br />
Source: <strong>Citigroup</strong>.<br />
Market Inclusion<br />
Since the WorldBIG <strong>Index</strong> has the WGBI as its core, markets will be subject to the<br />
same entry criteria already established for the WGBI. In addition, we include credit<br />
market coverage for the four largest currency sectors, namely US dollar, euro,<br />
Japanese yen, and UK sterling. We will add other credit sectors as we expand our<br />
market coverage, but will use our market expertise to determine their eligibility,<br />
4<br />
See Introducing the World Broad Investment-Grade (WorldBIG) Bond <strong>Index</strong>, Salomon Smith Barney, August 30, 2000, for<br />
more information.<br />
<strong>Citigroup</strong> <strong>Global</strong> Markets 15
October 20, 2003<br />
<strong>Citigroup</strong> <strong>Global</strong> <strong>Fixed</strong>-<strong>Income</strong> <strong>Index</strong> <strong>Catalog</strong> — 2003 Edition<br />
since some domestic credit markets are truly targeted to domestic investors and<br />
therefore would not be an appropriate fit for this global benchmark.<br />
Credit<br />
We impose a credit rule on the domestic sovereign markets included in both the<br />
WorldBIG <strong>Index</strong> and the WGBI to ensure that they remain investment-grade<br />
benchmarks. As such, a sovereign issuer must have a minimum local (internal) debt<br />
rating of BBB- from Standard & Poor’s or Baa3 from Moody’s. If a belowinvestment-grade<br />
market is part of our Additional Market <strong>Index</strong>es (whereby it meets<br />
all other entry criteria, such as size, no barriers to entry, etc.) and is upgraded to<br />
investment-grade by either ratings agency, it will be included in the profile of both the<br />
WorldBIG <strong>Index</strong> and the WGBI in the month immediately following the<br />
announcement. Similarly, any sovereign issuer in the WorldBIG <strong>Index</strong> and the WGBI<br />
will be removed from the profile if it is downgraded to below-investment-grade by<br />
both ratings agencies in the month immediately following the announcement.<br />
Although the imposition of this rule on the WGBI has the effect of excluding the<br />
country’s domestic sovereign debt from the benchmark, the impact is slightly<br />
different for the WorldBIG <strong>Index</strong>. <strong>The</strong> WorldBIG <strong>Index</strong> currently covers the credit<br />
components for the four largest currency markets (US dollar, euro, Japanese yen, and<br />
UK sterling) in addition to the domestic sovereign markets covered in the WGBI.<br />
Any bond included in the credit sectors of the WorldBIG <strong>Index</strong> that either meets or<br />
falls below our credit criteria ahead of profile fixing will be included or excluded in<br />
the next month’s profile according to the bond’s appropriate classification.<br />
Sector Classifications<br />
Most portfolio strategies involve a separate risk/reward analysis of each asset class.<br />
It was important, therefore, that when we aggregated the sectors from our various<br />
indexes to form the WorldBIG <strong>Index</strong>, we ensured consistency in terms of<br />
sectorization. <strong>The</strong> asset classes were created to distinctly delineate the risks from the<br />
perspective of a global investor. Figure 11 reviews the classification of the<br />
WorldBIG <strong>Index</strong>.<br />
In summary, we divided the WorldBIG <strong>Index</strong> into three asset classes:<br />
(1) Government/Government-Sponsored, (2) Collateralized, and (3) Corporate.<br />
Figure 12 identifies the subsectors that constitute the WorldBIG <strong>Index</strong>. In addition,<br />
we embraced the terminology of covered bonds for all Pfandbriefe and Pfandbrieflike<br />
securities predominant in the Euro region. 5<br />
5<br />
For further details, please see <strong>The</strong> Jumbo-Pfandbrief Goes <strong>Global</strong>, Salomon Smith Barney, June 10, 1999.<br />
16<br />
<strong>Citigroup</strong> <strong>Global</strong> Markets
October 20, 2003<br />
<strong>Citigroup</strong> <strong>Global</strong> <strong>Fixed</strong>-<strong>Income</strong> <strong>Index</strong> <strong>Catalog</strong> — 2003 Edition<br />
Figure 11. World Broad Investment Grade (WorldBIG) Bond <strong>Index</strong> — Classification, Oct 03<br />
WorldBIG <strong>Index</strong><br />
Govt./Govt.<br />
Sponsored<br />
Collateralized<br />
Corporate<br />
Domestic Sovereign<br />
(WGBI)<br />
Foreign Sovereign<br />
and Sovereign-Gtd.<br />
Govt. Sponsored/<br />
Regional Govt.<br />
MBS<br />
(Mortgage Pass-Through)<br />
Covered Asset-Backed Industrial Finance Utility<br />
Source: <strong>Citigroup</strong>.<br />
Figure 12. World Broad Investment Grade (WorldBIG) Bond <strong>Index</strong> — Sector Classification, Oct 03<br />
Sovereign/Sovereign-Guaranteed Collateralized Corporate — Utility<br />
Domestic Sovereign (WGBI) Mortgage-Backed Securities Electric<br />
Foreign Sovereign Covered Gas<br />
Sovereign-Guaranteed ➤ Jumbo Pfandbrief Telecommunication<br />
➤ Other Covered<br />
Other Utility<br />
Asset-Backed Securities<br />
Government-Sponsored/Regional Government Corporate — Industrial Corporate — Finance<br />
Agency Consumer Banks<br />
Supranational Energy Independent Finance<br />
Other Sovereign-Sponsored Manufacturing Insurance<br />
Regional Government Service Other Finance<br />
Regional Government-Guaranteed<br />
Transportation<br />
Regional Government-Sponsored<br />
Other Industrial<br />
Source: <strong>Citigroup</strong>.<br />
<strong>Citigroup</strong> <strong>Global</strong> Markets 17
October 20, 2003<br />
<strong>Citigroup</strong> <strong>Global</strong> <strong>Fixed</strong>-<strong>Income</strong> <strong>Index</strong> <strong>Catalog</strong> — 2003 Edition<br />
World Government Bond <strong>Index</strong> (WGBI) SM<br />
At present, the World Government Bond <strong>Index</strong> (WGBI) includes the 21 government<br />
bond markets of Australia, Austria, Belgium, Canada, Denmark, Finland, France,<br />
Germany, Greece, Ireland, Italy, Japan, the Netherlands, Norway, Poland, Portugal,<br />
Spain, Sweden, Switzerland, the United Kingdom, and the United States. Market<br />
eligibility is determined by market capitalization and investability criteria. A<br />
market’s eligible issues (see Figures 13 and 14) must total at least US$20 billion,<br />
€ € 15 billion, and ¥2.5 trillion for three consecutive months for the market to be<br />
considered eligible for inclusion. Once a market satisfies these criteria, it is added to<br />
the WGBI beginning with the next month’s profile. With the advent of EMU, the<br />
Euro-bloc is treated as a single market and individual EMU government debt markets<br />
are not subject to market size criteria.<br />
Our indexes also include a series of markets called the Additional Market <strong>Index</strong>es.<br />
<strong>The</strong>se indexes may include bond markets that do not presently qualify for inclusion<br />
in the WGBI based on the criteria outlined above. For example, the Additional<br />
Market <strong>Index</strong>es currently include New Zealand, and Singapore.<br />
We have also established guidelines by which markets exit the index: We consider a<br />
market for exclusion when the market capitalization of eligible issues falls below<br />
half of all entry level criteria for three consecutive months. Once again, the market<br />
will be removed from the next month’s profile. Similarly, we consider barriers to<br />
entry a reason for exclusion. For example, if a market actively discourages foreign<br />
investor participation or does not show commitment to its own policies, it will be<br />
ineligible for inclusion even if it meets the size criteria. In addition, we now require<br />
minimum credit quality of BBB-/Baa3 for all issuers to ensure that the WGBI<br />
remains an investment-grade benchmark. If a below-investment-grade market is part<br />
of our Additional Market <strong>Index</strong>es (whereby it meets all other entry criteria, such as<br />
size, no barriers to entry, etc.) and is upgraded to investment-grade by either ratings<br />
agency, it will be included in the profile of the WGBI in the month immediately<br />
following the announcement. Similarly, any sovereign issuer in the WGBI will be<br />
removed from the WGBI profile if it is downgraded to below-investment-grade by<br />
both ratings agencies in the month immediately following the announcement.<br />
<strong>The</strong> composition of the WGBI has changed considerably since its introduction.<br />
Figure 15 reviews the chronological events affecting the construction or calculation<br />
of the index. 6<br />
6<br />
<strong>The</strong> WGBI was preceded by the World Bond <strong>Index</strong>, which was discontinued as of December 31, 1995. This index served as a broad<br />
benchmark measuring the performance of government and foreign bonds and Eurobonds in ten currencies. <strong>The</strong> index was samplebased<br />
and focused on the five-year and longer sectors of these markets. <strong>The</strong> introduction of the World Government Bond <strong>Index</strong> in<br />
1986 made this index obsolete. <strong>The</strong> index was introduced in 1981, and historical returns date back to January 1978.<br />
18<br />
<strong>Citigroup</strong> <strong>Global</strong> Markets
October 20, 2003<br />
<strong>Citigroup</strong> <strong>Global</strong> <strong>Fixed</strong>-<strong>Income</strong> <strong>Index</strong> <strong>Catalog</strong> — 2003 Edition<br />
Figure 13. World Government Bond and Related <strong>Index</strong>es — Design Criteria and Calculation Assumptions<br />
Weighting<br />
Market capitalization updated once a month<br />
Minimum Size Outstanding Varies by market as follows:<br />
Australia: A$250 million (net of LCIR amounts)<br />
Canada: C$1 billion<br />
Denmark: DKK10 billion<br />
EMU Countries: € € 1 billion<br />
Japan: ¥500 billion, 20-year bonds are subject to a minimum of ¥450 billion.<br />
New Zealand: NZ$100 million<br />
Norway: NOK20 billion<br />
Poland: PLN1 billion<br />
Singapore: S$1.5 billion<br />
Sweden: SEK10 billion<br />
Switzerland: Sfr1 billion<br />
United Kingdom: £410 million<br />
United States: US$1 billion public amount outstanding<br />
Composition<br />
Sovereign debt denominated in the domestic currency<br />
Minimum Quality<br />
BBB-/Baa3 by either S&P or Moody’s<br />
Redemption Features Bullet, sinking fund, puttable, extendable, or callable<br />
Reinvestment of Cash Flow Non-US markets, except Australia: Eurodeposit rate. Australia: Australia dollar bank bill swap<br />
reference rate (BBSW). US: Treasury bill rate.<br />
At daily average of local currency one-month interest rate. Calculated from actual scheduled<br />
payment date of cash flow through end of reporting period<br />
Pricing<br />
<strong>Citigroup</strong> is the source for all except Switzerland, where a major market maker provides<br />
prices. All pricing generally taken as of the local market close (see Figure 5 in the General<br />
Methodology section)<br />
Calculation Frequency Daily<br />
Settlement Date<br />
Monthly: Last calendar day<br />
Daily: Same day except for last business day of the month, when settlement is last calendar day<br />
Base Date January 1985<br />
Source: <strong>Citigroup</strong>.<br />
<strong>Citigroup</strong> <strong>Global</strong> Markets 19
October 20, 2003<br />
<strong>Citigroup</strong> <strong>Global</strong> <strong>Fixed</strong>-<strong>Income</strong> <strong>Index</strong> <strong>Catalog</strong> — 2003 Edition<br />
Figure 14. Composition of the World Government Bond <strong>Index</strong> (WGBI) and Related <strong>Index</strong>es by Sector, Oct 03<br />
WGBI Market Securities Included Securities Excluded<br />
Australia <strong>Fixed</strong>-rate noncallable bonds Inflation index-linked and tax rebate bonds<br />
Austria<br />
<strong>Fixed</strong>-rate noncallable (Bundesanleihen) and fixedrate<br />
bonds originally issued in any euro-converting<br />
currency<br />
Bundesobligationen<br />
Belgium <strong>Fixed</strong>-rate noncallable bonds Philippe bonds (retail-directed)<br />
Canada <strong>Fixed</strong>-rate noncallable bonds Savings bonds, real-return bonds<br />
Denmark <strong>Fixed</strong>-rate noncallable bond and Treasury Notes Mortgage credit issues<br />
Finland<br />
France<br />
Germany<br />
Greece<br />
Bullet bonds and fixed-rate bonds originally issued in<br />
any euro-converting currency<br />
<strong>Fixed</strong>-rate noncallable — Obligations Assimilables du<br />
Trésor (OATs) and Bons du Trésor à Intérêt Annuel<br />
Normalisé (BTANs)<br />
<strong>Fixed</strong>-rate noncallable bonds (Bundesrepublic,<br />
Schatzanweisungen, Bundesobligationen, Unity<br />
bonds, Treuhandanstalt, and Treuhandobligationen)<br />
<strong>Fixed</strong>-rate noncallable bonds issued in any euroconverted<br />
currency<br />
Housing Fund and <strong>Yield</strong> bonds<br />
Variable-rate securities<br />
Schuldscheine, Unverzinsliche,<br />
Schatzanweisungen, Bundespost, Bundesbahn,<br />
European Recovery Program Bonds<br />
Variable-rate bonds<br />
Ireland <strong>Fixed</strong>-rate noncallable bonds Variable-rate bonds<br />
Italy<br />
<strong>Fixed</strong>-rate noncallable (Buoni del Tesoro Poliennale<br />
(BTPs)) and fixed-rates bonds originally issued in any<br />
euro-converting currency<br />
Floating-rate bonds (Certificati di Credito del<br />
Tesoro (CCTs))<br />
Japan <strong>Fixed</strong>-rate bonds Discount bonds, floating-rate bonds, private<br />
placements, and JGBs for individuals<br />
Netherlands <strong>Fixed</strong>-rate noncallable bonds Private placements (onderhandse leningen)<br />
Norway Benchmark bonds Loans and lottery loans issued before 1991<br />
Poland <strong>Fixed</strong>-rate noncallable bonds (including zero-coupon<br />
bonds)<br />
Treasury convertible bonds, floating-rate bonds<br />
Portugal<br />
Spain<br />
<strong>Fixed</strong>-rate noncallable bonds (Obrigaçoes do Tesouro<br />
(OTs)) and fixed-rate bonds originally issued in any<br />
euro-converting currency<br />
<strong>Fixed</strong>-rate noncallable bonds (Bonos and Obligationes<br />
del Estado) and fixed-rate bonds originally issued in<br />
any euro-converting currency<br />
Floating-rate debt (FIPs and OCAs)<br />
Discount bonds (Letras and Pagares del Tesoro)<br />
Sweden <strong>Fixed</strong>-rate noncallable bonds (Riksobligationer) Retail-directed Treasury bonds and inflation-indexlinked<br />
bonds<br />
Switzerland <strong>Fixed</strong>-rate noncallable and callable bonds <strong>Book</strong> liabilities and private placements<br />
United Kingdom <strong>Fixed</strong>-rate noncallable and callable bonds, partly<br />
paids, convertible (into other gilt issues) bonds, and<br />
perpetuals (undated)<br />
Inflation-index-linked bonds; rump gilts<br />
United States <strong>Fixed</strong>-rate noncallable and callable bonds Savings bonds, inflation-indexed securities, STRIPS<br />
Additional Markets<br />
New Zealand <strong>Fixed</strong>-rate noncallable bonds <strong>Index</strong>-linked bonds<br />
Singapore <strong>Fixed</strong>-rate (including zero-coupon bonds) <strong>Index</strong>-linked bonds; callable/puttable bonds<br />
Source: <strong>Citigroup</strong>.<br />
20<br />
<strong>Citigroup</strong> <strong>Global</strong> Markets
October 20, 2003<br />
<strong>Citigroup</strong> <strong>Global</strong> <strong>Fixed</strong>-<strong>Income</strong> <strong>Index</strong> <strong>Catalog</strong> — 2003 Edition<br />
Figure 15. Chronological Summary of World Government Bond <strong>Index</strong> (WGBI) Events/Enhancements<br />
Date Introduced<br />
May 1987<br />
March 1988<br />
May 1988<br />
November 1988<br />
Enhancement/Event<br />
Introduction of the After-Tax <strong>Index</strong>es<br />
Introduction of the Currency-Hedged <strong>Index</strong>es<br />
Inclusion of BTANs in the French sector<br />
Inclusion of Bundesobligationen in the German sector<br />
April 1989<br />
Inclusion of Denmark in the World Government Bond <strong>Index</strong> as a new country sector<br />
Introduction of the Currency-Hedged After-Tax <strong>Index</strong>es<br />
July 1991<br />
Minimum size eligibility increased to US$100 million<br />
October 1992<br />
Inclusion of Belgium, Italy, Spain, and Sweden in the WGBI as new country sectors<br />
Exclusion of Switzerland from the World Government Bond <strong>Index</strong><br />
Introduction of multiple composite indexes<br />
Introduction of Additional Market <strong>Index</strong>es — Austria, Ireland, and New Zealand<br />
Minimum size eligibility changed to a local currency standard<br />
April 1993<br />
Inclusion of Austria in the World Government Bond <strong>Index</strong> as a new country sector<br />
December 1993<br />
Currency spot exchange rates switched to the WM/Reuters standard<br />
January 1995<br />
Minimum entry increased as follows:<br />
➤ United States: US$1 billion<br />
➤ Spain: ESP100 billion<br />
➤ France: Ffr10 billion<br />
Settlement date changed to same day for daily calculations and last calendar day for monthly<br />
Issuance cutoff for profile changed to the twenty-fifth day of the calendar month<br />
Introduction of Finland, Norway, and Portugal to the Additional Market <strong>Index</strong>es<br />
April 1996<br />
Inclusion of Switzerland in the World Government Bond <strong>Index</strong><br />
July 1996<br />
Inclusion of Finland in the World Government Bond <strong>Index</strong><br />
April 1997<br />
Inclusion of Ireland in the World Government Bond <strong>Index</strong><br />
Monthly pricing of US and Canada changed to 3:00 PM NY time (futures close) from 5:00 PM<br />
July 1998<br />
Inclusion of Portugal in the World Government Bond <strong>Index</strong><br />
January 1999 WGBI market entry/exit size criteria changed to € € 15/€ € 7.5 billion from DM30/DM15 billion<br />
Country inclusion rule changed to currency-based rule. All domestic fixed-rate bonds larger<br />
than the issue size threshold issued by EMU sovereigns will qualify for inclusion<br />
Exclusion of German agency debt (moved to the EuroBIG <strong>Index</strong>)<br />
June 1999<br />
Australian <strong>Index</strong> amounts net of LCIR holdings<br />
January 2000<br />
Minimum entry size for gilts changed to £400 million. Rump gilts no longer eligible for<br />
inclusion<br />
April 2000<br />
Inclusion of Greece as an Additional Market <strong>Index</strong><br />
Country inclusion rule changed to shorten time to include or exclude a market based on size<br />
Addition of a minimum credit rule of BBB-/Baa3 from either S&P or Moody’s for market<br />
inclusion<br />
July 2000<br />
Inclusion of Greece in the World Government Bond <strong>Index</strong><br />
Minimum entry increased as follows:<br />
➤ Canada: C$1 billion<br />
➤ Denmark: DKK10 billion<br />
➤ Japan: ¥500 billion<br />
➤ Norway: NOK20 billion<br />
➤ Sweden: SEK10 billion<br />
➤ Switzerland: Sfr1 billion<br />
January 2001<br />
Greece entered EMU<br />
April 2001<br />
Laddered inclusion rule for Japan Government Bond <strong>Index</strong> introduced that lowers minimum<br />
amount outstanding of 20-year JGB to ¥450 billion from ¥500 billion<br />
August 2001<br />
Minimum entry size for gilts changed to £410 million<br />
October 2002<br />
Inclusion of Poland as an Additional Market <strong>Index</strong><br />
May 2003<br />
Inclusion of Poland in the World Government Bond <strong>Index</strong><br />
Inclusion of Singapore as an Additional Market <strong>Index</strong><br />
September 2003<br />
Inclusion of Norway in the World Government Bond <strong>Index</strong><br />
Source: <strong>Citigroup</strong>.<br />
<strong>Citigroup</strong> <strong>Global</strong> Markets 21
October 20, 2003<br />
<strong>Citigroup</strong> <strong>Global</strong> <strong>Fixed</strong>-<strong>Income</strong> <strong>Index</strong> <strong>Catalog</strong> — 2003 Edition<br />
Related Benchmarks and Definitions<br />
<strong>Citigroup</strong> World Government Bond <strong>Index</strong> (WGBI) SM<br />
<strong>The</strong> WGBI is a market-capitalization-weighted benchmark that tracks the<br />
performance of the 21 government bond markets of Australia, Austria, Belgium,<br />
Canada, Denmark, Finland, France, Germany, Greece, Ireland, Italy, Japan, the<br />
Netherlands, Norway, Poland, Portugal, Spain, Sweden, Switzerland, the United<br />
Kingdom, and the United States.<br />
<strong>Citigroup</strong> Nonbase Currency Government Bond <strong>Index</strong>es SM<br />
<strong>The</strong> indexes of nonbase currency sectors exclude respective base currency bond<br />
markets from the calculation and in turn are stated in terms of the base currency. For<br />
example, the non-US dollar WGBI includes all WGBI countries except the United<br />
States and is stated in US dollar terms. As with all of our indexes, we can state<br />
returns in any base currency.<br />
<strong>Citigroup</strong> European World Government Bond <strong>Index</strong> SM<br />
<strong>The</strong> European WGBI consists of those 17 sectors of the WGBI that are<br />
geographically located in Europe, namely Austria, Belgium, Denmark, Finland,<br />
France, Germany, Greece, Ireland, Italy, the Netherlands, Norway, Poland, Portugal,<br />
Spain, Sweden, Switzerland, and the United Kingdom.<br />
<strong>Citigroup</strong> EMU Government Bond <strong>Index</strong> (EGBI) SM<br />
<strong>The</strong> EGBI consists of those sectors of the WGBI that are EMU-participating<br />
countries, namely Austria, Belgium, Finland, France, Germany, Greece, Ireland,<br />
Italy, the Netherlands, Portugal, and Spain. If Luxembourg were to issue debt of<br />
sufficient size, that debt would also be included in this index.<br />
<strong>Citigroup</strong> Group-of-Five (G5) <strong>Index</strong> SM<br />
<strong>The</strong> G5 <strong>Index</strong> includes France, Germany, Japan, the United Kingdom, and the United<br />
States. This index is designed to provide broad international exposure using a small<br />
number of markets. It covers nearly 72% of the market value of the WGBI using just<br />
five markets versus the WGBI’s 21 markets.<br />
<strong>Citigroup</strong> Group-of-Seven (G7) <strong>Index</strong> SM<br />
<strong>The</strong> G7 <strong>Index</strong> includes Canada, France, Germany, Italy, Japan, the United Kingdom,<br />
and the United States. This index covers approximately 83% of the market value of<br />
the WGBI.<br />
<strong>Citigroup</strong> After-Tax Bond <strong>Index</strong>es SM<br />
After-tax returns are computed from the point of view of a US pension account and<br />
attempt to approximate the effect on total rate of return of withholding tax on coupon<br />
income. Figure 16 details our calculation assumptions:<br />
22<br />
<strong>Citigroup</strong> <strong>Global</strong> Markets
October 20, 2003<br />
<strong>Citigroup</strong> <strong>Global</strong> <strong>Fixed</strong>-<strong>Income</strong> <strong>Index</strong> <strong>Catalog</strong> — 2003 Edition<br />
Figure 16. Withholding Tax Assumptions for the After-Tax <strong>Index</strong>es<br />
Market Tax Rate Calculation Assumption<br />
Japan 10.00 Nonrefundable<br />
Switzerland 35.00 5% nonrefundable, 30% refundable three months following the<br />
January 1 or July 1 after the coupon payment date<br />
Effective July 1, 1997, all Italian bonds accrue and pay interest on a gross basis. Effective April 6, 1998, all UK gilt securities accrue and pay<br />
interest on a gross basis. Although for the index we assume Australian government bonds pay interest on a gross basis, under certain<br />
circumstances, some US pension funds may be subject to withholding tax on these investments.<br />
Source: <strong>Citigroup</strong>.<br />
Additional Market <strong>Index</strong>es<br />
<strong>Citigroup</strong> Additional Market <strong>Index</strong>es SM<br />
<strong>The</strong>se indexes include bond markets that do not currently qualify for inclusion in the<br />
WGBI, based on the criteria outlined earlier. <strong>The</strong> markets currently included are New<br />
Zealand and Singapore. We consider this index the “waiting room” for inclusion in<br />
the WGBI, where we may track a market’s size and investability characteristics<br />
before it is considered for inclusion in the WGBI.<br />
<strong>Citigroup</strong> <strong>Global</strong> Government Bond Composite <strong>Index</strong> SM<br />
<strong>The</strong> <strong>Global</strong> Government Bond Composite <strong>Index</strong> includes all government bond<br />
markets that <strong>Citigroup</strong> currently tracks. In addition to the 21 countries included in the<br />
WGBI, New Zealand and Singapore are included in this index. <strong>The</strong>re is no specific<br />
inclusion criterion for this index, and as such, the composition may expand more<br />
rapidly than that of the WGBI.<br />
<strong>Citigroup</strong> European Government Bond Composite <strong>Index</strong> SM<br />
<strong>The</strong> European Government Bond Composite <strong>Index</strong> includes those 17 sectors of the<br />
<strong>Global</strong> Government Bond Composite <strong>Index</strong> that are geographically located in<br />
Europe, namely Austria, Belgium, Denmark, Finland, France, Germany, Greece,<br />
Ireland, Italy, the Netherlands, Norway, Poland, Portugal, Spain, Sweden,<br />
Switzerland, and the United Kingdom.<br />
<strong>Citigroup</strong> <strong>Global</strong> Markets 23
October 20, 2003<br />
<strong>Citigroup</strong> <strong>Global</strong> <strong>Fixed</strong>-<strong>Income</strong> <strong>Index</strong> <strong>Catalog</strong> — 2003 Edition<br />
US Broad Investment-Grade (USBIG)<br />
Bond <strong>Index</strong> SM<br />
<strong>The</strong> US Broad Investment Grade (USBIG) Bond <strong>Index</strong> is designed to track the<br />
performance of bonds issued in the US investment-grade bond market. <strong>The</strong> USBIG<br />
<strong>Index</strong> includes institutionally traded US Treasury, government-sponsored (US agency<br />
and supranational), mortgage, asset-backed, and investment-grade securities and<br />
provides a reliable and fair benchmark for an investment-grade portfolio manager.<br />
Figure 17 details the design criteria and Figure 18 reviews the chronological<br />
summary of events/enhancements:<br />
Figure 17. US Broad Investment-Grade (USBIG) Bond <strong>Index</strong> — Design Criteria and Calculation<br />
Stated Coupon<br />
<strong>Fixed</strong> rate<br />
Minimum Maturity<br />
One year<br />
Weighting<br />
Market capitalization updated once a month<br />
Minimum Size Outstanding US Treasuries: US$1 billion public amount outstanding<br />
Agencies: US$200 million<br />
Supranationals: US$200 million<br />
Credit: US$200 million<br />
Asset-Backed: US$200 million<br />
Mortgage Coupons: US$5 billion (Origination year minimum: US$500 million)<br />
Minimum Denomination Par Value: US$1,000<br />
Composition<br />
Treasuries (excluding inflation-indexed securities and STRIPS); agencies (excluding callable<br />
zeros and bonds callable less than one year from issue date); mortgage pass-throughs; assetbackeds;<br />
supranationals; credit (excluding bonds callable less than one year from issue date);<br />
Yankees, globals, and securities issued under Rule 144A with registration rights<br />
Minimum Quality<br />
BBB-/Baa3 by either S&P or Moody's<br />
Redemption Features Bullet, sinking fund, puttable, extendable, or callable<br />
Interest<br />
Fully taxable (federal)<br />
<strong>Yield</strong> Curve<br />
<strong>Citigroup</strong> Treasury Model (Off-the-Run) Curve<br />
Reinvestment of Cash Flow Continuous at the daily average of the one-month Treasury bill for the calculation period<br />
Calculation Frequency Monthly, daily estimates<br />
Pricing<br />
Individual <strong>Citigroup</strong> trader pricing as of 3:00 PM New York time for each bond at month-end;<br />
most corporate and agency issues are matrixed for the daily calculation only<br />
Price Adjustments<br />
Mortgages: Carry-adjusted to reflect the difference between the index settlement dates and<br />
standard PSA settlement dates<br />
Volatility<br />
Nonmortgages: 10% single volatility<br />
Mortgages: Market-implied volatility (two-factor model)<br />
Settlement Date<br />
Monthly: Last calendar day<br />
Daily: Same day except last business day of the month when settlement is last calendar day.<br />
Base Date January 1980<br />
Source: <strong>Citigroup</strong>.<br />
24<br />
<strong>Citigroup</strong> <strong>Global</strong> Markets
October 20, 2003<br />
<strong>Citigroup</strong> <strong>Global</strong> <strong>Fixed</strong>-<strong>Income</strong> <strong>Index</strong> <strong>Catalog</strong> — 2003 Edition<br />
Figure 18. Chronological Summary of US Broad Investment-Grade (USBIG) Bond <strong>Index</strong> Events/Enhancements<br />
Date Introduced<br />
January 1983<br />
January 1984<br />
January 1986<br />
September 1987<br />
Enhancement/Event<br />
Inclusion of 30-year FNMAs<br />
Effective (option-adjusted) values calculated at 16% volatility<br />
Inclusion of 15-year mortgages<br />
Expanded 30-year mortgage seasoning to include new and seasoned<br />
January 1988<br />
Investment-grade ratings by S&P or Moody's<br />
Increase minimum outstanding from US$25 million to US$50 million<br />
Inclusion of Yankees other than Canadian and World Bank issues<br />
January 1989<br />
Returns reflect transaction costs on new issues<br />
August 1989 Volatility assumption changed from 16% to 13%<br />
January 1990<br />
Government-sponsored sector introduced, including agencies and supranationals<br />
February 1990<br />
Inclusion of credit cards<br />
July 1990<br />
Expanded mortgage seasoning to include moderately seasoned 30-year pass-throughs<br />
July 1991<br />
Inclusion of FHLMC Gold pass-throughs<br />
July 1992<br />
Expanded mortgage seasoning to include moderately seasoned 15-year pass-throughs<br />
Minimum entry/exit size for mortgage securities increased to US$200 million<br />
July 1993<br />
Inclusion of FHLMC and FNMA balloons<br />
January 1994<br />
Expanded corporate industry sectors<br />
January 1995<br />
September 1995<br />
July 1996<br />
December 1996<br />
April 1997<br />
November 1997<br />
January 1998<br />
July 1998<br />
July 1999<br />
April 2001<br />
July 2001<br />
November 2001<br />
May 2003<br />
Source: <strong>Citigroup</strong>.<br />
Minimum entry/exit increased as follows:<br />
➤ US Treasuries: US$1/US$1 billion public amount outstanding<br />
➤ Corporates and Government-Sponsored: US$100/US$75 million<br />
➤ Mortgages: US$1/US$1 billion<br />
Settlement date became same day for daily calculations and last calendar day for monthly calc.<br />
Issuance cutoff for profile changed to the twenty-fifth day of the calendar month<br />
Price adjustment for mortgages implemented<br />
Multifamily project loans eliminated from the Mortgage <strong>Index</strong><br />
Use the <strong>Citigroup</strong> Treasury Model (off-the-run) Curve to compute option-adjusted values<br />
Incorporate a new mortgage prepayment model and compute option-adjusted values using a<br />
two-factor model with fixed historical volatilities<br />
Reduce volatility assumptions on nonmortgages from 13% to 10%<br />
Switched to origination year-based pricing for mortgages<br />
Reclassified Mortgage <strong>Index</strong> to include a "superseasoned" category<br />
Minimum size per seasoning category reduced from US$500 million to US$250 million<br />
Added minimum denomination and fully-taxable (federal) interest as inclusion criteria to include<br />
certain preferred security structures (for example, Trust Pass-Through Securities (TRUPS))<br />
All security pricing switched to 3:00 PM NY time (US Treasury futures close) from 5:00 PM<br />
Origination-year generics replace seasoning categories for Mortgage <strong>Index</strong><br />
Minimum size per origination-year generic set at US$100 million<br />
Exit amount for Corporate & Govt-Sponsored increased from US$75 million to US$100 million<br />
Returns no longer reflect transaction costs for new issues<br />
Incorporate a new mortgage prepayment model and compute option-adjusted values using a<br />
two-factor model with market-implied volatilities<br />
Minimum entry size for a mortgage coupon increased to US$5 billion and origination year<br />
minimum increased to US$250 million<br />
GNMA-IIs added to the Mortgage <strong>Index</strong><br />
Callable zeroes removed from the Agency <strong>Index</strong><br />
Minimum entry size increased from US$100 million to US$200 million for agency,<br />
supranational, corporate, and asset-backed bonds. Origination-year minimum for mortgages<br />
increased from US$250 million to US$500 million<br />
Bonds with call dates less than one year from issue date no longer included<br />
Rule 144A securities with registration rights added to the Credit sector.Sector classifications<br />
changed to Treasury/Government-Sponsored, Collateralized, and Credit<br />
Issuance cut-off for profile changed to four (4) global business days before month-end<br />
Reclassified the stranded asset sector from utility sector to collateralized asset-backed sector<br />
Incorporated a new mortgage prepayment model and compute option-adjusted values using a<br />
two-factor model with market-implied volatilities.<br />
<strong>Citigroup</strong> <strong>Global</strong> Markets 25
October 20, 2003<br />
<strong>Citigroup</strong> <strong>Global</strong> <strong>Fixed</strong>-<strong>Income</strong> <strong>Index</strong> <strong>Catalog</strong> — 2003 Edition<br />
<strong>Citigroup</strong> Mortgage <strong>Index</strong> Return Methodology<br />
<strong>The</strong> Mortgage component of the USBIG <strong>Index</strong> comprises 30- and 15-year GNMA,<br />
FNMA, and FHLMC securities, and FNMA and FHLMC balloon mortgages. <strong>The</strong><br />
principal payment component of the total-rate-of-return computation for the<br />
Mortgage <strong>Index</strong> includes both scheduled principal amortization and unscheduled<br />
principal prepayment. <strong>The</strong> Mortgage <strong>Index</strong> accounts for all mortgage payments<br />
(principal plus interest) at the end of each month to reflect the monthly cash flow<br />
characteristics inherent in the instruments.<br />
For example, during the January measurement period, most mortgage securities<br />
generate cash flow (principal and interest). <strong>The</strong> index assumes that cash flow is<br />
reinvested at the monthly average of the daily one-month Treasury bill rate. For the<br />
January returns, information on the January paydown, applicable to a December 31–<br />
January 31 holding period, is available by the third week of January. <strong>The</strong> return<br />
computation for mortgage securities is given in Figure 19.<br />
Figure 19. Return Calculation for Mortgage Securities<br />
Total Return (%) = [((C+X) x (1+(Rm/200)N/180) + (EP+EA)(1-(X/100)))/(BP+BA)-1] x 100<br />
BP Beginning price. EP Ending price. BA Beginning accrued interest. EA Ending accrued interest. X Principal payment as percent of beginning<br />
balance. C Coupon rate/12. Rm Reinvestment rate on intramonth payment (average of daily one-month Treasury Bill rate). N Number of days<br />
between date of receipt of coupon and principal payment and calendar month-end.<br />
Source: <strong>Citigroup</strong>.<br />
Mortgage <strong>Index</strong> Pricing<br />
Each day, mortgage TBAs receive a trader price, quoted for standard PSA settlement<br />
dates, which occur on a variety of dates through the month, depending on the type of<br />
security. Because the index uses cash settlement, it is necessary to adjust the prices<br />
for carry. With a positively sloped yield curve, the actual market price for end-ofmonth<br />
settlement would be higher than the PSA settlement price to account for the<br />
difference between the current yield on the mortgage security and the money market<br />
rate over the time between settlement dates (the cost of carry). 7 <strong>The</strong> price adjustment<br />
also accounts for the effect of principal paydowns on the mortgage security’s current<br />
yield. We assume the previous month’s paydown and use the one-month LIBOR rate<br />
when calculating the carry-adjusted price.<br />
Since July 1996, the pricing of mortgage securities has reflected the origination year<br />
of the loans. For any particular coupon, <strong>Citigroup</strong> traders provide the TBA price plus<br />
additional pricing points for specific origination years. We use the WALA (weighted<br />
average loan age) provided by GNMA, FHLMC, and FNMA to calculate the<br />
origination year. Using GNMA 6.5s as an example, we price the TBA issue along<br />
with 1999, 1998, 1997, 1996, 1995, 1994, 1993, and 1973 origination years. Prices<br />
for origination years with relatively lower amounts outstanding are interpolated. This<br />
pricing methodology ensures that the index return more fairly represents the results<br />
of a realistic baseline strategy that a passive investor could have followed.<br />
7<br />
“Parity” price differences between settlement dates are calculated so that investors are indifferent about buying securities earlier or<br />
investing temporarily in cash and buying securities later. A shortage of securities available for near-term settlement sometimes pushes<br />
the actual price difference between earlier and later settlement dates wider than the parity price difference.<br />
26<br />
<strong>Citigroup</strong> <strong>Global</strong> Markets
October 20, 2003<br />
<strong>Citigroup</strong> <strong>Global</strong> <strong>Fixed</strong>-<strong>Income</strong> <strong>Index</strong> <strong>Catalog</strong> — 2003 Edition<br />
Mortgage <strong>Index</strong> Profile<br />
<strong>The</strong> <strong>Citigroup</strong> Mortgage <strong>Index</strong> is re-weighted each month to reflect new issuance and<br />
principal paydowns. <strong>The</strong> Mortgage <strong>Index</strong> includes GNMA, FHLMC, and FNMA<br />
pass-throughs. All mortgage pools are aggregated by coupon within agency or<br />
product type. Only coupons with at least US$5 billion in aggregated face amount<br />
outstanding are included in the index. In addition, each coupon sector may be further<br />
divided into distinct origination-year generics provided that each of these<br />
origination-year generics meets a minimum face amount outstanding criterion of<br />
US$500 million.<br />
Each month, <strong>Citigroup</strong> receives a set of computerized “factor” tapes that individually<br />
list relevant information for all outstanding agency-guaranteed mortgage pools. This<br />
information is supplied by GNMA, FNMA, and FHLMC for all of their respective<br />
pools and represents the most current information available in the marketplace. Each<br />
mortgage pool has a factor that represents the fraction of the original pool still<br />
outstanding. <strong>The</strong> outstanding amounts are aggregated and their difference is used to<br />
calculate the paydown for a coupon sector. To calculate monthly paydowns, the<br />
latest factor for the pool is subtracted from the appropriate factor from the prior tape.<br />
Industry Classification<br />
Figure 20. US Broad Investment-Grade (USBIG) Bond <strong>Index</strong> — Industry Sector Classification, Oct 03<br />
Industrial — Manufacturing Industrial — Service Utility<br />
Aerospace/Defense Cable/Media Electric<br />
Automotive Manufacturers Gaming/Lodging/Leisure Power<br />
Building Products Healthcare Supply Gas — Local Distribution<br />
Chemicals Pharmaceuticals Telecommunications<br />
Conglomerate/Diversified Mfg. Publishing Utility — Other<br />
Electronics<br />
Restaurants<br />
Information/Data Technology Food/Drugs Finance<br />
Machinery Retail Stores — Other Banking<br />
Metals/Mining Service — Other Life Insurance<br />
Paper/Forest Products<br />
Mortgage Banking<br />
Textiles/Apparel/Shoes Industrial — Transportation Property & Casualty<br />
Vehicle Parts Airlines REITs<br />
Manufacturing — Other Railroads Securities<br />
Transportation — Other<br />
Finance — Other<br />
Industrial — Energy<br />
Gas — Pipelines Industrial — Consumer Non-US Sovereign & Provincial<br />
Oil & Gas Beverage/Bottling Canadian Province & Sovereign<br />
Oilfield Machinery & Services Consumer Products Sovereign Yankee<br />
Food Processors<br />
Industrial — Other<br />
Tobacco<br />
Source: <strong>Citigroup</strong>.<br />
Related Benchmarks and Definitions<br />
<strong>Citigroup</strong> US Broad Investment-Grade (USBIG) Bond <strong>Index</strong> SM<br />
<strong>The</strong> USBIG <strong>Index</strong> is market-capitalization-weighted and includes fixed-rate Treasury,<br />
government-sponsored, mortgage, asset-backed, and investment-grade (BBB-/Baa3)<br />
issues with a maturity of one year or longer and a minimum amount outstanding of<br />
US$1 billion for Treasuries, US$5 billion for mortgages, and US$200 million for<br />
credit, asset-backed, and government-sponsored issues.<br />
<strong>Citigroup</strong> <strong>Global</strong> Markets 27
October 20, 2003<br />
<strong>Citigroup</strong> <strong>Global</strong> <strong>Fixed</strong>-<strong>Income</strong> <strong>Index</strong> <strong>Catalog</strong> — 2003 Edition<br />
<strong>Citigroup</strong> Credit <strong>Index</strong><br />
Includes US and non-US corporate securities and non-US sovereign and<br />
provincial securities.<br />
<strong>Citigroup</strong> High-Grade Credit <strong>Index</strong><br />
<strong>The</strong> High-Grade Credit <strong>Index</strong> includes those issues from the Credit <strong>Index</strong> that have<br />
at least ten years to maturity (long-term) and a minimum credit rating of AA-/Aa3.<br />
<strong>Citigroup</strong> Collateralized <strong>Index</strong><br />
Includes mortgage pass-throughs and asset-backed securities.<br />
<strong>Citigroup</strong> Mortgage <strong>Index</strong><br />
This index measures the mortgage component of the USBIG <strong>Index</strong>, comprising 30-<br />
and 15-year GNMA, FNMA, and FHLMC pass-throughs and FNMA and FHLMC<br />
balloon mortgages.<br />
<strong>Citigroup</strong> Core ⊕ 5 <strong>Index</strong> SM<br />
<strong>The</strong>se are essentially the USBIG <strong>Index</strong> excluding both Treasury and governmentsponsored<br />
securities with less than five years to maturity.<br />
<strong>Citigroup</strong> Core ⊕ 3 <strong>Index</strong> SM<br />
<strong>The</strong>se are essentially the USBIG <strong>Index</strong> excluding both Treasury and governmentsponsored<br />
securities with less than three years to maturity.<br />
<strong>Citigroup</strong> US Treasury Benchmark (On-the-Run) <strong>Index</strong>es SM<br />
<strong>The</strong>se indexes measure total returns for the current two-, three-, five-, ten-, and<br />
30-year on-the-run Treasuries that have been in existence for the entire month. As a<br />
result of the reduced auction schedule for one-year Treasury bills, as of May 2000,<br />
we select an existing coupon bond with approximately one year to maturity to use as<br />
the one-year benchmark. In most cases, this is an old two-year security.<br />
<strong>Citigroup</strong> US Treasury Benchmark <strong>Yield</strong> Curve Average <strong>Index</strong>es SM<br />
<strong>The</strong>se indexes measure total returns for the current two-, three-, and five-year on-therun<br />
Treasuries that have been in existence for the entire month and the two shorter<br />
and two longer issues in the Treasury <strong>Index</strong> nearest each respective benchmark<br />
maturity. <strong>The</strong> ten- and 30-year US Treasury Benchmark <strong>Yield</strong> Curve Average<br />
<strong>Index</strong>es measure total returns, respectively, for the current ten- and 30-year on-therun<br />
Treasuries that have been in existence for the entire month and the four shorter<br />
issues in the Treasury <strong>Index</strong>. Callable bonds are excluded from these indexes.<br />
<strong>Citigroup</strong> US Treasury Bill <strong>Index</strong>es SM<br />
This index measures monthly return equivalents of yield averages that are not<br />
marked to market. <strong>The</strong> Six-Month Treasury-Bill <strong>Index</strong> is an average of the last six<br />
six-month Treasury bill issues. Similarly, the One-Month and Three-Month Treasury<br />
Bill <strong>Index</strong>es consist of the last one one-month and three three-month Treasury bill<br />
issues, respectively. Returns for these indexes are calculated on a monthly basis only.<br />
28<br />
<strong>Citigroup</strong> <strong>Global</strong> Markets
October 20, 2003<br />
<strong>Citigroup</strong> <strong>Global</strong> <strong>Fixed</strong>-<strong>Income</strong> <strong>Index</strong> <strong>Catalog</strong> — 2003 Edition<br />
Example of Calculation Methodology for the Three-Month US<br />
Treasury Bill <strong>Index</strong><br />
Step 1. Obtain discount yields for the three previous month-end dates. For example,<br />
the January return requires the rates at the end of December, November, and October.<br />
Step 2. Convert the discount rates to bond-equivalent yields.<br />
Step 3. Compute the simple average of the bond-equivalent yields.<br />
Step 4. De-compound to a monthly frequency using the actual number of days in the<br />
month and a 365-day year.<br />
<strong>Citigroup</strong> Certificate-of-Deposit <strong>Index</strong>es SM<br />
<strong>The</strong>se indexes measure monthly return equivalents of yield averages that are not<br />
marked to market. <strong>The</strong> CD rate is a rotating sample (collected by the New York<br />
Federal Reserve Bank) of five banks and dealers surveyed daily about secondarymarket<br />
dealer offer rates for jumbo certificates of deposit. Returns for these indexes<br />
are calculated on a monthly basis only.<br />
Example of Calculation Methodology for Six-Month Certificate-of-<br />
Deposit <strong>Index</strong><br />
Step 1. Obtain CD-equivalent yields for six previous month-end dates. For example,<br />
the January return requires the rates at the end of December, November, October,<br />
September, August, and July.<br />
Step 2. Convert the CD rates to bond-equivalent yields.<br />
Step 3. Compute the simple average of the bond-equivalent yields.<br />
Step 4. De-compound to a monthly frequency using the actual number of days in the<br />
month and a 365-day year.<br />
<strong>Citigroup</strong> US Benchmark STRIPS <strong>Index</strong> SM<br />
<strong>The</strong>se indexes measure the total returns of the current one-, two-, three-, five-,<br />
seven-, ten-, 15-, and 25 year STRIP. <strong>The</strong>se benchmarks change every three months<br />
based on their February, May, August, and November cycles. For example,<br />
benchmarks maturing on the February cycle will be used for January, February, and<br />
March returns. <strong>The</strong> 30-year benchmark STRIP is comprised of a long, more liquid<br />
coupon and principal STRIP.<br />
<strong>Citigroup</strong> Targeted <strong>Index</strong> Matrix Series (TIMS) SM<br />
<strong>The</strong> TIMS provides a generalized framework for constructing customized<br />
benchmarks that span the realm of duration and quality combinations available in the<br />
investment-grade fixed-income market. <strong>The</strong> matrix is based on two fundamental<br />
variables: (1) a percentage core holding in the credit and collateralized component of<br />
the USBIG <strong>Index</strong>, which provides an approximate gauge of quality level; and (2)<br />
effective duration as a measure of interest-rate sensitivity. For a desired effective<br />
duration, an index “cell” is created by combining the credit/collateralized core with<br />
an appropriate sector of Treasury securities. <strong>The</strong> Treasury sector acts as the swing<br />
component required to attain the desired index duration.<br />
<strong>Citigroup</strong> <strong>Global</strong> Markets 29
October 20, 2003<br />
<strong>Citigroup</strong> <strong>Global</strong> <strong>Fixed</strong>-<strong>Income</strong> <strong>Index</strong> <strong>Catalog</strong> — 2003 Edition<br />
US Large Pension Fund (LPF) Baseline<br />
Bond <strong>Index</strong> SM<br />
<strong>The</strong> US Large Pension Fund (LPF) Baseline Bond <strong>Index</strong> provides an appropriate<br />
benchmark and/or tracking vehicle for pension funds seeking to establish long-term<br />
core portfolios that more closely match the longer duration of their nominal dollar<br />
liabilities. <strong>The</strong>se portfolios might normally be benchmarked to the USBIG <strong>Index</strong>, but<br />
the LPF <strong>Index</strong> improves on that structure by using fixed sector weights and a<br />
minimum maturity of seven years for nonmortgage issues. <strong>The</strong>se design<br />
characteristics satisfy the longer duration goal of pension fund portfolios while<br />
emphasizing the traditionally higher yielding longer-term securities.<br />
<strong>The</strong> LPF <strong>Index</strong> employs the calculation assumptions previously outlined for the<br />
USBIG <strong>Index</strong> in Figure 17.<br />
Figure 21. US Large Pension Fund (LPF) Baseline Bond <strong>Index</strong> — Design Criteria<br />
Stated Coupon<br />
<strong>Fixed</strong> rate<br />
Minimum Maturity<br />
Nonmortgage: Seven years<br />
Mortgage: One year<br />
Weighting<br />
Issues: Market capitalization updated once a month<br />
Sectors: <strong>Fixed</strong> weight as follows:<br />
➤ Treasury/Government-Sponsored: 40%<br />
➤ Collateralized: 30%<br />
➤ Credit: 30%<br />
Minimum Size Outstanding US Treasuries: US$1 billion public amount outstanding<br />
Agencies: US$200 million<br />
Supranationals: US$200 million<br />
Credit: US$200 million<br />
Asset-Backeds: US$200 million<br />
Mortgage Coupon: US$5 billion (Origination year minimum: US$500 million)<br />
Minimum Denomination Par Value: US$1,000<br />
Composition<br />
Treasuries (excluding inflation-indexed securities); agencies (excluding callable zeros and<br />
bonds callable less than one year from issue date); mortgage pass-throughs; assetbackeds;<br />
supranationals; credit (excluding bonds callable less than one year from issue<br />
date); Yankees, globals, and securities issued under Rule 144A with registration rights<br />
Minimum Quality<br />
BBB-/Baa3 by either S&P or Moody's<br />
Redemption Features<br />
Bullet, sinking fund, puttable, extendable, or callable<br />
Interest<br />
Fully taxable (federal)<br />
Base Date January 1980<br />
Source: <strong>Citigroup</strong>.<br />
30<br />
<strong>Citigroup</strong> <strong>Global</strong> Markets
October 20, 2003<br />
<strong>Citigroup</strong> <strong>Global</strong> <strong>Fixed</strong>-<strong>Income</strong> <strong>Index</strong> <strong>Catalog</strong> — 2003 Edition<br />
US Inflation-Linked Securities <strong>Index</strong> SM<br />
(ILSI)<br />
<strong>The</strong> US Inflation-Linked Securities <strong>Index</strong> (ILSI) measures the return of US Treasury<br />
Inflation-Protected Securities (TIPS) with fixed-rate coupon payments that are<br />
adjusted for inflation as measured by the Consumer Price <strong>Index</strong> (CPI). <strong>The</strong> ILSI is<br />
separate and distinct from our US BIG <strong>Index</strong>.<br />
<strong>The</strong> price of each issue in the ILSI is adjusted by using an index ratio. <strong>The</strong> index<br />
ratio is determined by dividing the current CPI-U (Consumer Price <strong>Index</strong> for all<br />
Urban Consumers) level by the CPI-U at the time of issue of the security. <strong>The</strong> CPI-U<br />
is available for the current profile pricing date and the subsequent horizon pricing<br />
date, and the intramonth index ratio is calculated by using straight-line interpolation<br />
of these values.<br />
Figure 22. US Inflation-Linked Securities <strong>Index</strong> (ILSI) — Design Criteria and Calculation Assumptions<br />
Weighting<br />
Market capitalization updated once a month<br />
Composition<br />
US Treasury Inflation-Protected Securities<br />
Minimum Maturity<br />
One year<br />
Minimum Size Outstanding US$1 billion<br />
Reinvestment of Cash Flow Continuous at the daily average one-month Treasury bill for the calculation period<br />
Calculation Frequency Monthly, daily calculations<br />
Pricing<br />
Individual <strong>Citigroup</strong> trader pricing daily as of 3:00 PM New York time<br />
Settlement Date<br />
Monthly: Last calendar day<br />
Daily: Same day except last business day of the month, when settlement is last calendar day<br />
Base Date March 1997<br />
Source: <strong>Citigroup</strong>.<br />
<strong>Citigroup</strong> <strong>Global</strong> Markets 31
October 20, 2003<br />
<strong>Citigroup</strong> <strong>Global</strong> <strong>Fixed</strong>-<strong>Income</strong> <strong>Index</strong> <strong>Catalog</strong> — 2003 Edition<br />
US Treasury STRIPS <strong>Index</strong> SM<br />
<strong>The</strong> STRIPS <strong>Index</strong> accurately represents a comprehensive selection of long-duration<br />
market sectors and thereby improves on the customization possibilities otherwise<br />
available. <strong>The</strong> STRIPS <strong>Index</strong> offers a wider range of duration choices and can also be<br />
combined with a range of USBIG <strong>Index</strong> sectors if a core spread product exposure is<br />
desired. It has been increasingly difficult to construct long-duration benchmarks using<br />
a core that combines the Credit and Collateralized <strong>Index</strong>es, since the effective duration<br />
of the Mortgage <strong>Index</strong> is significantly shorter than that of the Credit <strong>Index</strong>. <strong>The</strong><br />
greater choice of long-duration sectors allows investors to opt for any core holding<br />
and combine it with the appropriate STRIPS sector to reach their target durations.<br />
Figure 23 summarizes the design criteria and calculation assumptions for this index.<br />
Figure 23. US Treasury STRIPS <strong>Index</strong> — Design Criteria and Calculation Assumptions<br />
Weighting<br />
Market capitalization updated once a month<br />
Minimum Maturity None, but derived from bonds with a remaining maturity of at least one year<br />
Minimum Size Outstanding None, but derived from bonds with at least US$1 billion amount outstanding<br />
Cycles<br />
We include only those STRIPS derived from bonds within the Feb–Aug 15 or May–Nov 15 cycles<br />
Reinvestment of Cash Flow Maturing interest STRIPS are reinvested at the daily average one-month Treasury bill from the<br />
date of the cash flow through the end of the calculation period<br />
Calculation Frequency Daily<br />
Pricing<br />
Individual <strong>Citigroup</strong> trader pricing daily as of 3:00 PM New York time<br />
Settlement Date<br />
Monthly: Last calendar day<br />
Daily: Same day except last business day of the month, when settlement is last calendar day<br />
Base Date January 1992<br />
Source: <strong>Citigroup</strong>.<br />
Bond Inclusion Criteria<br />
We choose to include STRIPS derived only from bonds in our US Treasury Bond<br />
<strong>Index</strong>. We also include the coupon strips with less than one year remaining to<br />
maturity that have been derived from this set of Treasury bonds. (<strong>The</strong> Treasury <strong>Index</strong><br />
tracks those issues with at least US$1 billion public amount outstanding and a<br />
remaining maturity of at least one year.) In addition, only those STRIPS from<br />
Treasury bonds maturing on February/August 15 or May/November 15 cycles are<br />
included. <strong>The</strong> relatively recent introduction of bond stripping on a monthly cycle has<br />
not created a deep enough market to ensure availability to institutional investors;<br />
therefore, we have chosen to exclude the monthly cycles from the index.<br />
Maturity and Issue Size<br />
We impose neither an amount outstanding cutoff nor a minimum maturity screen on<br />
the STRIPS <strong>Index</strong>. Our goal is to maintain a relatively stable universe that<br />
accommodates the broadest measure of available securities. By including coupon<br />
STRIPS with less than one year remaining to maturity, the full STRIPS <strong>Index</strong> cash<br />
flows can be replicated closely by using bonds in the Treasury <strong>Index</strong>.<br />
32<br />
<strong>Citigroup</strong> <strong>Global</strong> Markets
October 20, 2003<br />
<strong>Citigroup</strong> <strong>Global</strong> <strong>Fixed</strong>-<strong>Income</strong> <strong>Index</strong> <strong>Catalog</strong> — 2003 Edition<br />
<strong>Index</strong> Profile<br />
<strong>The</strong> index is rebalanced each month. <strong>The</strong> first week of each month, the Bureau of<br />
Public Debt makes available the Treasury market debt outstanding held in stripped<br />
form as of the previous month-end. We use these figures along with the current<br />
Treasury <strong>Index</strong> profile to arrive at our amounts outstanding for the following<br />
month’s STRIPS <strong>Index</strong>. For example, on June 4, the Bureau of Public Debt<br />
announced the amounts held in stripped form as of May 31. We applied these<br />
amounts to the July index profile fixing and they are then fixed for the calendar<br />
month, and all interim returns are calculated based on its composition.<br />
Maturity Sector and Other Subindexes<br />
In addition to an overall STRIPS <strong>Index</strong>, we publish returns on the maturity subsector<br />
breakdowns, and we make returns available on the Principal STRIPS and Coupon<br />
STRIPS subsectors.<br />
<strong>Citigroup</strong> <strong>Global</strong> Markets 33
October 20, 2003<br />
<strong>Citigroup</strong> <strong>Global</strong> <strong>Fixed</strong>-<strong>Income</strong> <strong>Index</strong> <strong>Catalog</strong> — 2003 Edition<br />
US Agency Zero 10+ <strong>Index</strong> SM<br />
<strong>The</strong> US Agency Zero 10+ <strong>Index</strong> was constructed to allow better customization for<br />
investors seeking long-duration benchmarks. <strong>The</strong> Agency Zero 10+ <strong>Index</strong> provides<br />
investors with a higher-yielding benchmark alternative to Treasury STRIPS while<br />
enabling investors to maintain a high-quality benchmark. Combining the Agency<br />
Zero 10+ <strong>Index</strong> with a range of STRIPS <strong>Index</strong> sectors, we offer investors a wide<br />
variety of long-duration benchmark choices.<br />
Figure 24 summarizes the design criteria and calculation assumptions for this index.<br />
Figure 24. US Agency Zero 10+ <strong>Index</strong> — Design Criteria and Calculation Assumptions<br />
Stated Coupon<br />
Zero<br />
Minimum Maturity Ten years<br />
Weighting<br />
Market capitalization updated once a month<br />
Minimum Size Outstanding Original-issue zero-coupon bonds and principal pieces of stripped coupon bonds: US$200 million<br />
Interest pieces of stripped bonds and zero-coupon bonds issued as serial zeros: US$40 million<br />
Composition<br />
Noncallable securities only<br />
<strong>Yield</strong> Curve<br />
<strong>Citigroup</strong> Treasury Model (Off-the-Run) Curve<br />
Calculation Frequency Daily<br />
Pricing<br />
Individual <strong>Citigroup</strong> trader pricing as of 3:00 PM New York time for each bond daily<br />
Settlement Date<br />
Monthly: Last calendar day<br />
Daily: Same day except last business day of the month, when settlement is last calendar day<br />
Base Date August 2000<br />
Source: <strong>Citigroup</strong>.<br />
Bond Inclusion Criteria<br />
<strong>The</strong> Agency Zero 10+ <strong>Index</strong> includes noncallable zero-coupon bonds issued by US<br />
agencies. Currently, this includes zero-coupon bonds issued by Fannie Mae and<br />
Freddie Mac, as well as interest and principal pieces created from stripping the<br />
Fannie Mae Benchmark and Freddie Mac Reference bonds. <strong>The</strong> zeros created by<br />
stripping Financing Corp (FICO) and Resolution Funding Corp (REFCORP) issues<br />
are also included. In addition, we include bonds issued as serial zeros, such as those<br />
issued through the Agency of International Development — Israel (AID).<br />
<strong>Index</strong> Profile<br />
<strong>The</strong> index is rebalanced each month. <strong>The</strong> information detailing stripping activity on<br />
coupon bonds is obtained from the relevant agencies and used to calculate and<br />
update amount outstanding. Because the frequency and timing of available data may<br />
vary from agency to agency, we will apply publicly available data at profile fixing to<br />
create the subsequent index profile.<br />
Maturity Sector and Other Subindexes<br />
In addition to an overall Agency Zero 10+ <strong>Index</strong>, we publish returns on the maturity<br />
subsector breakdowns, and we make returns available on the issuer sectors.<br />
34<br />
<strong>Citigroup</strong> <strong>Global</strong> Markets
October 20, 2003<br />
<strong>Citigroup</strong> <strong>Global</strong> <strong>Fixed</strong>-<strong>Income</strong> <strong>Index</strong> <strong>Catalog</strong> — 2003 Edition<br />
Euro Broad Investment-Grade<br />
(EuroBIG) Bond <strong>Index</strong> SM , EMU<br />
Government Bond <strong>Index</strong> SM , and Jumbo<br />
Pfandbrief <strong>Index</strong> SM<br />
<strong>The</strong> Euro Broad Investment-Grade (EuroBIG) Bond <strong>Index</strong> is designed to provide a<br />
benchmark for euro-based fixed-income portfolios. 8 It covers all sectors of the<br />
investment-grade fixed-income market that are accessible to institutional investors<br />
and accurately measures their performance and risk characteristics.<br />
<strong>The</strong> EMU sovereign sector of the EuroBIG <strong>Index</strong> is the EMU Government Bond<br />
<strong>Index</strong> (EGBI). This index also forms the Euro sector of the World Government Bond<br />
<strong>Index</strong> (WGBI). Detailed design and issue selection criteria are provided in the WGBI<br />
section of this report.<br />
<strong>The</strong> Jumbo Pfandbrief <strong>Index</strong> is an integral part of the EuroBIG <strong>Index</strong> and represents the<br />
significant component of the German collateralized bond market. By definition, a Jumbo<br />
Pfandbrief is a Pfandbrief with at least € € 500 million outstanding, a fixed-rate coupon,<br />
and at least three market-makers prepared to quote two-way prices during normal<br />
trading hours. Owing to their collateralization, these are very high-quality securities.<br />
€<br />
€<br />
Figure 25. Euro Broad Investment-Grade (EuroBIG) Bond <strong>Index</strong> — Design Criteria and Calculation<br />
Assumptions<br />
Stated Coupon<br />
<strong>Fixed</strong> rate<br />
Minimum Maturity<br />
One year<br />
Weighting<br />
Market capitalization updated once a month<br />
Minimum Size Outstanding EMU Sovereigns: € 1 billion or the equivalent for non-redenominated bonds<br />
Other: € 500 million or the equivalent for non-redenominated bonds<br />
Composition<br />
Issues denominated in EUR, ECU, or NCU<br />
Minimum Quality Investment-grade: BBB-/Baa3 by either S&P or Moody's with the following exceptions —<br />
Unrated Jumbo/<strong>Global</strong> Pfandbriefe, which are shadow-rated AAA; unrated bonds issued by or<br />
guaranteed by a sovereign or supranational issuer, which are assigned the rating of the issuer<br />
or guarantor<br />
Redemption Features Bullet, sinking fund, puttable, extendable, or callable<br />
Seasoning<br />
Unseasoned bonds are included<br />
Reinvestment of Cash Flow At daily average of the one-month eurodeposit rate, calculated from the actual scheduled<br />
payment date of cash flow through the end of the reporting period<br />
Calculation Frequency Daily<br />
Pricing<br />
<strong>Citigroup</strong> is the source for all pricing<br />
Settlement Date<br />
Monthly: Last calendar day<br />
Daily: Same day except for last business day of month, when settlement is last calendar day<br />
Base Date January 1999<br />
Source: <strong>Citigroup</strong>.<br />
8<br />
For a detailed introductory explanation, please see <strong>The</strong> Salomon Smith Barney EMU Bond <strong>Index</strong>es, Salomon Smith Barney, May 8, 1998,<br />
and Introducing the Salomon Brothers Jumbo Pfandbrief <strong>Index</strong>, Salomon Smith Barney, July 1997. <strong>The</strong> Euro Broad Investment-Grade<br />
Bond <strong>Index</strong> replaces the ECU Bond <strong>Index</strong>, which was published from December 1995 through December 1998.<br />
<strong>Citigroup</strong> <strong>Global</strong> Markets 35
October 20, 2003<br />
<strong>Citigroup</strong> <strong>Global</strong> <strong>Fixed</strong>-<strong>Income</strong> <strong>Index</strong> <strong>Catalog</strong> — 2003 Edition<br />
Although the base date of this index is January 1999, we have a long history of<br />
tracking some of its components. Specifically, we have been tracking Euro-DM and<br />
Euro-ECU bonds since 1977 and 1984, respectively (as part of the discontinued<br />
World Bond, Euro-Deutschemark Bond, and ECU Bond indexes). Our Jumbo<br />
Pfandbrief <strong>Index</strong> has a base date of July 1997.<br />
Sector Classification<br />
<strong>The</strong> asset classification of the EuroBIG <strong>Index</strong> reflects the current structure of the<br />
market and is in line with the structure of the WorldBIG <strong>Index</strong>. Figure 26 details the<br />
sector classification of the EuroBIG <strong>Index</strong>:<br />
Figure 26. Euro Broad Investment-Grade (EuroBIG) <strong>Index</strong> — Sector Classification, Oct 03<br />
Sovereign/Sovereign-Guaranteed Collateralized Corporate — Utility<br />
Domestic Sovereign (EGBI) Jumbo Pfandbrief Electric<br />
Foreign Sovereign Other Covered Gas<br />
Sovereign-Guaranteed Asset Backed Telecommunication<br />
Other Utility<br />
Government-Sponsored/Regional Government Corporate — Industrial Corporate — Finance<br />
Agency Consumer Banks<br />
Supranational Energy Independent Finance<br />
Other Sovereign-Sponsored Manufacturing Insurance<br />
Regional Government Service Other Finance<br />
Regional Government-Guaranteed<br />
Transportation<br />
Regional Government-Sponsored<br />
Other Industrial<br />
Source: <strong>Citigroup</strong>.<br />
36<br />
<strong>Citigroup</strong> <strong>Global</strong> Markets
October 20, 2003<br />
<strong>Citigroup</strong> <strong>Global</strong> <strong>Fixed</strong>-<strong>Income</strong> <strong>Index</strong> <strong>Catalog</strong> — 2003 Edition<br />
Eurobond <strong>Index</strong>es<br />
<strong>The</strong> Eurobond <strong>Index</strong>es provide a comprehensive and relevant measure of performance<br />
for Eurodollar, Eurosterling, and Euroyen bonds. 9 <strong>The</strong>se indexes are marketcapitalization-weighted<br />
and are in keeping with the <strong>Citigroup</strong> philosophy on index<br />
design. Several subindexes are available based on credit, issuer nationality and type,<br />
and maturity sectors. Regularly calculated sectors include: sovereign and sovereignguaranteed,<br />
supranational, official and agency, corporate, financial, and asset-backed.<br />
Recognizing the implication for certain classes of investors in US-sourced income<br />
bonds, we publish returns on the subset of bonds issued by non-US entities for the<br />
Eurodollar Bond <strong>Index</strong>.<br />
Figure 27. Eurobond <strong>Index</strong>es — Design Criteria and Calculation Assumptions<br />
Stated Coupon<br />
<strong>Fixed</strong> rate<br />
Zero-coupon bonds are included in the Eurodollar Bond <strong>Index</strong> only<br />
Minimum Maturity<br />
One year<br />
Weighting<br />
Market capitalization updated once a month<br />
Minimum Size Outstanding Eurodollar: US$250 million<br />
Eurosterling: £150 million<br />
Euroyen: ¥50 billion<br />
Denomination Limit<br />
Eurodollar: US$100,000<br />
Eurosterling: £100,000<br />
Euroyen: ¥10 million<br />
Composition<br />
Eurobonds, <strong>Global</strong> bonds, Dragon bonds, and certain Euro Medium-Term Notes a<br />
Minimum Quality<br />
Redemption Features<br />
Seasoning<br />
Investment-grade: BBB-/Baa3 by either S&P or Moody's<br />
Bullet, sinking fund, puttable, extendable, or callable<br />
Unseasoned bonds are included<br />
Reinvestment of Cash Flow At daily average of the local one-month Eurodeposit rate. Calculated from actual scheduled<br />
payment date of cash flow through end of reporting period<br />
Calculation Frequency Daily<br />
Pricing<br />
<strong>Citigroup</strong> is the source for all pricing<br />
Settlement Date<br />
Monthly: Last calendar day<br />
Daily: Same day except last business day of the month, when settlement is last calendar day<br />
Base Date Eurodollar: July 1993<br />
Eurosterling: January 1995<br />
Euroyen: January 1995<br />
a For a medium-term note to be included, it must meet all other criteria and be publicly announced. For self-led deals, we require the issue to be<br />
managed by a syndicate with a minimum of five members; for all other deals, we require a minimum of three syndicate members. For the<br />
purposes of determining the amount outstanding of such an issue, all fungible issues will be combined.<br />
Source: <strong>Citigroup</strong>.<br />
9<br />
See Introducing the New Salomon Brothers Eurodollar Bond <strong>Index</strong>, Salomon Brothers, January 1994; Salomon Brothers Eurodollar<br />
Bond <strong>Index</strong>es: Introducing Eurosterling, Euro-Deutschemark, and Euroyen Bond <strong>Index</strong>es, Salomon Brothers, January 1996; and A<br />
Review of the Salomon Brothers Eurodollar Bond <strong>Index</strong>, Salomon Brothers, January 1995. <strong>The</strong> Euro-Deutschemark <strong>Index</strong> was<br />
discontinued as of December 31, 1998. Most bonds that were included in this index are now covered by the Euro Broad Investment-<br />
Grade Bond <strong>Index</strong>.<br />
<strong>Citigroup</strong> <strong>Global</strong> Markets 37
October 20, 2003<br />
<strong>Citigroup</strong> <strong>Global</strong> <strong>Fixed</strong>-<strong>Income</strong> <strong>Index</strong> <strong>Catalog</strong> — 2003 Edition<br />
Figure 28. Chronological Summary of the Eurobond <strong>Index</strong>es Events/Enhancements<br />
Date Introduced<br />
January 1995<br />
January 1999<br />
July 2000<br />
Source: <strong>Citigroup</strong>.<br />
Enhancement/Event<br />
Settlement date changed to same day for daily calculations and last calendar day for monthly<br />
calculations for the Eurodollar Bond <strong>Index</strong><br />
Issuance cut-off for profile changed to the twenty-fifth day of the calendar month for the<br />
Eurodollar Bond <strong>Index</strong><br />
Introduction of new Eurosterling, Euroyen, and Euro-Deutschemark <strong>Index</strong>es<br />
Euro-Deutschemark <strong>Index</strong> discontinued. Most issues are now included in the EuroBIG <strong>Index</strong><br />
Minimum amounts outstanding increased as follows:<br />
Eurodollar: US$250 million<br />
Eurosterling: £150 million<br />
Euroyen: ¥50 billion<br />
Related Benchmarks and Definitions<br />
<strong>Citigroup</strong> Eurodollar Bond <strong>Index</strong> SM<br />
A market-capitalization-weighted index that includes fixed-rate (including zerocoupon)<br />
Eurodollar, global, and Dragon bonds and certain asset-backed and Euro<br />
medium-term notes. All issues are investment-grade, have a remaining average life<br />
of at least one year, an amount outstanding of at least US$250 million, and are<br />
available in denominations of less than US$100,000.<br />
<strong>Citigroup</strong> Eurosterling Bond <strong>Index</strong> SM<br />
A market-capitalization-weighted index that includes fixed-rate Eurosterling, global,<br />
and Dragon bonds and certain Asset-Backed and Euro medium-term Notes. All<br />
issues are investment-grade, have a remaining average life of at least one year, an<br />
amount outstanding of at least £150 million, and are available in denominations of<br />
less than £100,000.<br />
<strong>Citigroup</strong> Euroyen Bond <strong>Index</strong> SM<br />
A market-capitalization-weighted index that includes fixed-rate Euroyen, global, and<br />
Dragon bonds and certain asset-backed and Euro medium-term Notes. All issues are<br />
investment-grade, have a remaining average life of at least one year, an amount<br />
outstanding of at least ¥50 billion, and are available in denominations of less than<br />
¥10 million.<br />
38<br />
<strong>Citigroup</strong> <strong>Global</strong> Markets
October 20, 2003<br />
<strong>Citigroup</strong> <strong>Global</strong> <strong>Fixed</strong>-<strong>Income</strong> <strong>Index</strong> <strong>Catalog</strong> — 2003 Edition<br />
Australian Broad Investment-Grade<br />
(AusBIG) Bond <strong>Index</strong> SM<br />
<strong>The</strong> Australian Broad Investment-Grade (AusBIG) Bond <strong>Index</strong> SM is designed to represent<br />
the Australian credit market. It covers all sectors of the investment-grade, Australian<br />
dollar-denominated fixed-income market that are accessible to Australian institutional<br />
investors and accurately measures their performance and risk characteristics.<br />
<strong>The</strong> AusBIG <strong>Index</strong> maintains high standards of pricing reliability — every issue is<br />
trader-priced on a daily basis. <strong>The</strong> index follows rules that are consistent with our<br />
stated philosophy of index design to ensure an objective and predictable set of<br />
criteria for inclusion of bonds. It is designed to be fully compatible with techniques<br />
for the management of active and passive portfolios.<br />
<strong>The</strong> AusBIG <strong>Index</strong> includes any fixed-coupon, investment-grade bond issued in the<br />
Australian market or Semi-Government bond issued in the global market that meets<br />
specific amount-outstanding criteria and matures in more than one year. 10 Figure 30<br />
details the sector classification of this index.<br />
Figure 29. Australian Broad Investment-Grade (AusBIG) Bond <strong>Index</strong> — Design Criteria and Calculation<br />
Assumptions<br />
Stated Coupon<br />
<strong>Fixed</strong> rate including zero coupon<br />
Minimum Maturity<br />
One year<br />
Weighting<br />
Market capitalization updated once a month<br />
Minimum Size Outstanding Government and Semi-Government: A$250 million, including amounts issued under interestwithholding<br />
tax-free formats a<br />
Corporate, supranational, agency, and mortgage-backed securities: A$100 million<br />
Minimum Quality<br />
Investment-grade: BBB-/Baa3 by either S&P or Moody's or bonds guaranteed by the<br />
Commonwealth of Australia<br />
Redemption Features Bullet, callable, puttable, extendable, nonamortizing MBS<br />
Method of Issuance<br />
Public tender or tap (reverse inquiry bonds included if offered under one of these methods)<br />
Reinvestment of Cash Flow At daily average of the one-month Australian dollar bank bill swap reference rate (BBSW).<br />
Calculated from actual scheduled payment date of cash flow through end of period<br />
Calculation Frequency Daily<br />
Pricing<br />
Bid side sourced from <strong>Citigroup</strong> <strong>Fixed</strong>-<strong>Income</strong> Australia as of 4:30 PM Sydney time<br />
Settlement Date<br />
Monthly: Last calendar day<br />
Daily: Same day except last business day of the month, when settlement is last calendar day.<br />
Base Date July 2000<br />
a Such as Queensland Treasury Corporation’s <strong>Global</strong> Bond Program and New South Wales Treasury Corporation’s Exchangeable Program. <strong>The</strong>se<br />
bonds may be exchanged at any time for ordinary bonds from the issuer.<br />
Source: <strong>Citigroup</strong>.<br />
10<br />
For a complete description of this index, please see Introducing the Salomon Smith Barney Australian Broad Investment-Grade<br />
Bond <strong>Index</strong>, Salomon Smith Barney, May 31, 2000.<br />
<strong>Citigroup</strong> <strong>Global</strong> Markets 39
October 20, 2003<br />
<strong>Citigroup</strong> <strong>Global</strong> <strong>Fixed</strong>-<strong>Income</strong> <strong>Index</strong> <strong>Catalog</strong> — 2003 Edition<br />
Figure 30. Australian Broad Investment-Grade (AusBIG) <strong>Index</strong>-Sector Classification, Oct 03<br />
Government Debt All Industrials All Resources<br />
Commonwealth Government (CGS) Manufacturing Metals/Mining<br />
Semi-Government Services Other<br />
Consumer Goods<br />
Supranational Transportation Financial Services<br />
Energy Equipment<br />
Banks<br />
Telecommunications<br />
Life Insurance<br />
Collateralized Real Estate Investment Trust Other<br />
<strong>Fixed</strong>-Rate Mortgage Backed (MBS) Other<br />
Asset-Backed<br />
Gas/Electricity<br />
Gas<br />
Electricity<br />
Other<br />
Source: <strong>Citigroup</strong>.<br />
40<br />
<strong>Citigroup</strong> <strong>Global</strong> Markets
October 20, 2003<br />
<strong>Citigroup</strong> <strong>Global</strong> <strong>Fixed</strong>-<strong>Income</strong> <strong>Index</strong> <strong>Catalog</strong> — 2003 Edition<br />
US High-<strong>Yield</strong> Market <strong>Index</strong> SM<br />
<strong>The</strong> US High-<strong>Yield</strong> Market <strong>Index</strong> captures the performance of below-investment-grade<br />
debt issued by corporations domiciled in the United States or Canada. This index is our<br />
broadest high-yield market measure and includes cash-pay and deferred-interest<br />
securities. All the bonds are publicly placed, have a fixed coupon, and are<br />
nonconvertible. Bonds issued under Rule 144A are included in their unregistered form.<br />
Figure 31 details the design criteria of the index and Figure 32 reviews the<br />
chronological summary of events/enhancements.<br />
Figure 31. US High-<strong>Yield</strong> Market <strong>Index</strong> — Design Criteria and Calculation Assumptions<br />
Stated Coupon<br />
<strong>Fixed</strong> rate<br />
Minimum Maturity<br />
One year<br />
Weighting<br />
Market capitalization updated once a month<br />
Minimum Size Outstanding Entry: US$100 million minimum outstanding per issue when the issuer has a minimum of<br />
US$400 million total outstanding debt that qualifies for inclusion, or US$200 million minimum<br />
outstanding per issue when the issuer does not meet the US$400 million minimum.<br />
Exit: A bond will exit when its amount outstanding falls below US$100 million par amount. An<br />
issuer that has already satisfied the US$400 million requirement will remain in the index —<br />
even if the total par amount outstanding of its bonds drops below the US$400 million<br />
minimum.<br />
Composition<br />
Cash-Pay, Zero-to-Full (ZTF), Pay-in-Kind (PIK), step-coupon bonds, and Rule 144A bonds<br />
issued by corporations domiciled in the United States or Canada only<br />
Maximum Quality<br />
BB+/Ba1 by both S&P and Moody's<br />
Minimum Quality<br />
C by S&P or Moody’s (please see Special Situations section below)<br />
Reinvestment of Cash Flow Continuous at the daily average of the one-month Treasury Bill for the calculation period<br />
Calculation Frequency Monthly, Daily Estimates<br />
Pricing<br />
Individual <strong>Citigroup</strong> trader pricing at 3:00 PM New York time with supplemental pricing<br />
provided by pricing vendors.<br />
Settlement Date<br />
Monthly: Last calendar day<br />
Daily: Same day except last business day of the month, when settlement is last calendar day<br />
Base Date January 1989<br />
Source: <strong>Citigroup</strong>.<br />
<strong>Citigroup</strong> <strong>Global</strong> Markets 41
October 20, 2003<br />
<strong>Citigroup</strong> <strong>Global</strong> <strong>Fixed</strong>-<strong>Income</strong> <strong>Index</strong> <strong>Catalog</strong> — 2003 Edition<br />
Figure 32. Chronological Summary of US High-<strong>Yield</strong> Market <strong>Index</strong> Events/Enhancements<br />
Date Introduced<br />
January 1989<br />
January 1991<br />
January 1997<br />
January 1998<br />
January 1999<br />
April 2001<br />
Source: <strong>Citigroup</strong>.<br />
Enhancement/Event<br />
1-7 year sector added to the credit sectors (BB-, B-, and CCC- rated indexes)<br />
Prior to this date, these indexes contained those securities with a remaining maturity of at least 7 years.)<br />
Deferred-interest securities added to applicable indexes<br />
Entry criteria increased to US$100 million from US$50 million<br />
Exit criteria increased to US$75 million from US$50 million<br />
Maximum rating changed to speculative-grade by both S&P and Moody's<br />
Exit criteria increased to US$100 million from US$75 million<br />
Changes to industry sectors:<br />
Conglomerate/Diversified Manufacturing and Machinery combined to form Capital Goods<br />
Electronics/Information/Data Technology name changed to Technology<br />
Include Rule 144A bonds at issuance<br />
Limit securities to those issued by US- or Canadian- domiciled issuers only<br />
Raise minimum quality to C by S&P or Moody's from none<br />
Eliminate the Extended High-<strong>Yield</strong> Market <strong>Index</strong> (held the same issues as the High-<strong>Yield</strong> Market <strong>Index</strong> in<br />
addition to bankrupt and/or defaulted securities).<br />
Eliminated the Distressed <strong>Index</strong><br />
Minimum amount outstanding changed as follows:<br />
Entry Criteria: US$100 million minimum size outstanding per issue when the issuer has a minimum of<br />
US$400 million total outstanding debt that qualifies for inclusion in the High-<strong>Yield</strong> Market <strong>Index</strong>; or US$200<br />
million minimum outstanding per issue when the issuer does not meet the US$400 million requirement.<br />
Exit Criteria: A bond will exit the High-<strong>Yield</strong> Market <strong>Index</strong> when its amount outstanding falls below US$100<br />
million par amount. An issuer that has already satisfied the US$400 million will remain in the index — even<br />
if the total par amount outstanding of its bonds drops below the US$400 million minimum<br />
42<br />
<strong>Citigroup</strong> <strong>Global</strong> Markets
October 20, 2003<br />
<strong>Citigroup</strong> <strong>Global</strong> <strong>Fixed</strong>-<strong>Income</strong> <strong>Index</strong> <strong>Catalog</strong> — 2003 Edition<br />
Industry Classification<br />
Figure 33. US High <strong>Yield</strong> Market <strong>Index</strong> — Industry Sector Classification, Oct 03<br />
Industrial — Manufacturing<br />
Aerospace<br />
Automotive Manufacturers/Vehicle Parts<br />
Building Products<br />
Home Builders<br />
Capital Goods<br />
Chemicals<br />
Containers<br />
Metals/Mining<br />
Paper/Forest Products<br />
Technology<br />
Textiles/Apparel/Shoe Manufacturers<br />
Industrial — Service<br />
Cable<br />
Broadcast/Outdoor<br />
Satellite<br />
Publishing<br />
Gaming<br />
Leisure<br />
Lodging<br />
Healthcare Facilities/Supplies<br />
Pharmaceuticals<br />
Publishing<br />
Restaurants<br />
Retail — Food & Drugs<br />
Retail Stores<br />
Environmental Services<br />
Tower<br />
Service — Other<br />
Source: <strong>Citigroup</strong>.<br />
Industrial — Energy<br />
Secondary Oil & Gas Producers<br />
Oil Equipment<br />
Energy — Other<br />
Industrial — Consumer<br />
Consumer Products/Tobacco<br />
Food Processors/Beverage/Bottling<br />
Industrial — Transportation<br />
Airlines<br />
Transportation — Rail & Other<br />
Industrial — Other<br />
Utility<br />
Electric, Power, Gas, and Other<br />
Broadband<br />
Competitive Local Exchange Company (CLEC)<br />
Diversified Telecommunications<br />
ISP/Data<br />
Wireless<br />
Finance<br />
Banking<br />
Finance — Other<br />
Rating Classification<br />
Each bond is assigned both an S&P and a Moody’s rating. <strong>Index</strong> quality sectors are<br />
based on the S&P rating. If a bond is not rated by S&P, we assign the S&P<br />
equivalent of the Moody’s rating to determine the bond’s sector. When an issue is<br />
split-rated between the BB and B categories or the B and CCC categories, the S&P<br />
rating determines which quality sector the bond will enter. For example, if S&P rated<br />
a bond BB, but Moody’s rated it B, the bond would enter the BB-rated index.<br />
However, if Moody’s rated a bond Ba but S&P rated it B, the bond would appear in<br />
the B-rated index.<br />
Average Spread-to-Worst and Average Treasury Benchmark<br />
<strong>The</strong> average spread-to-worst is computed by subtracting a comparable-maturity onthe-run<br />
Treasury from the lower of the yield to maturity or yield-to-call. For example,<br />
a bond with a remaining maturity falling between four and five-and-a-half years from<br />
the settlement date would be benched off the five-year Treasury. <strong>The</strong> average yield<br />
and spread-to-worst are market-weighted.<br />
<strong>Citigroup</strong> <strong>Global</strong> Markets 43
October 20, 2003<br />
<strong>Citigroup</strong> <strong>Global</strong> <strong>Fixed</strong>-<strong>Income</strong> <strong>Index</strong> <strong>Catalog</strong> — 2003 Edition<br />
Special Situations<br />
Defaults<br />
When an issuer defaults or expects to default on an interest payment, or enters into<br />
Chapter 11/Chapter 7 bankruptcy protection, we make adjustments to both the<br />
current month’s index returns and the following month’s index profile. At the monthend<br />
following the announcement by the company, we adjust the current month’s<br />
returns for the company’s bonds to reflect the loss of coupon payments or accrued<br />
interest, where applicable. Returns for bankrupt securities only incorporate the gain<br />
or loss on principal, except in unique situations when bankrupt bonds trade with<br />
accrued interest. We also remove the bankrupt securities from the following month’s<br />
High-<strong>Yield</strong> Market <strong>Index</strong> profile and place them in the Bankrupt/Default <strong>Index</strong>,<br />
beginning with the next month. In addition, we exclude bankrupt bonds when<br />
calculating the average yields of the indexes. As a final note, any bond that is<br />
assigned a D rating by S&P, regardless of whether that issuer has filed for<br />
bankruptcy protection, will be placed into our Bankrupt/Default <strong>Index</strong> for the<br />
following month’s profile.<br />
Related Benchmarks and Definitions<br />
Broad-Based Sectors<br />
High-<strong>Yield</strong> Market <strong>Index</strong><br />
<strong>The</strong> High-<strong>Yield</strong> Market <strong>Index</strong> includes cash-pay, deferred-interest, and Rule 144A<br />
bonds with remaining maturities of at least one year and a minimum amount<br />
outstanding of US$100 million. <strong>The</strong> issuers must be domiciled in the United States<br />
or Canada for consideration in this index. (Base date: January 1989.)<br />
High-<strong>Yield</strong> Cash-Pay <strong>Index</strong><br />
<strong>The</strong> High-<strong>Yield</strong> Cash-Pay <strong>Index</strong> includes only cash-pay bonds (both registered and<br />
Rule 144A) with remaining maturities of at least one year and a minimum amount<br />
outstanding of US$100 million. (Base date: January 1989.)<br />
Deferred-Interest <strong>Index</strong><br />
<strong>The</strong> Deferred-Interest <strong>Index</strong> includes pay-in-kind bonds (PIKs), zero-to-full coupon<br />
bonds (ZTFs), zero-to-maturity bonds, and step-up coupon bonds. (Base date:<br />
January 1991.)<br />
Maturity Sectors<br />
High-<strong>Yield</strong> Market 1–7 Year <strong>Index</strong><br />
<strong>The</strong> High-<strong>Yield</strong> Market 1–7 Year <strong>Index</strong> includes those securities in the High-<strong>Yield</strong><br />
Market <strong>Index</strong> with a remaining maturity of at least one year, but less than seven<br />
years. (Base date: January 1989.)<br />
High-<strong>Yield</strong> Market 7–10 Year <strong>Index</strong><br />
<strong>The</strong> High-<strong>Yield</strong> Market 7–10 Year <strong>Index</strong> includes those securities in the High-<strong>Yield</strong><br />
Market <strong>Index</strong> with a remaining maturity of at least seven years, but less than ten<br />
years. (Base date: July 1985.)<br />
44<br />
<strong>Citigroup</strong> <strong>Global</strong> Markets
October 20, 2003<br />
<strong>Citigroup</strong> <strong>Global</strong> <strong>Fixed</strong>-<strong>Income</strong> <strong>Index</strong> <strong>Catalog</strong> — 2003 Edition<br />
High-<strong>Yield</strong> Market 10+ Year <strong>Index</strong><br />
<strong>The</strong> High-<strong>Yield</strong> Market 10+ Year <strong>Index</strong> includes those securities in the High-<strong>Yield</strong><br />
Market <strong>Index</strong> with a remaining maturity of at least ten years. (Base date: January<br />
1980.)<br />
High-<strong>Yield</strong> Market 7+ Year <strong>Index</strong><br />
<strong>The</strong> High-<strong>Yield</strong> Market 7+ Year <strong>Index</strong> includes those securities in the High-<strong>Yield</strong> Market<br />
<strong>Index</strong> with a remaining maturity of at least seven years. (Base date: January 1985.)<br />
Quality Sectors<br />
All BB-Rated <strong>Index</strong><br />
<strong>The</strong> All BB-Rated <strong>Index</strong> includes those bonds in the High-<strong>Yield</strong> Market <strong>Index</strong> (and<br />
before January 1989, the High-<strong>Yield</strong> 7+ Year <strong>Index</strong>) with a BB+, BB, or BB- rating<br />
from Standard & Poor’s. <strong>The</strong> index may include bonds not rated by Standard &<br />
Poor’s but rated Ba1, Ba2, or Ba3 by Moody’s. (Base date: January 1985.)<br />
All B-Rated <strong>Index</strong><br />
<strong>The</strong> All B-Rated <strong>Index</strong> includes those bonds in the High-<strong>Yield</strong> Market <strong>Index</strong> (and<br />
before January 1989, the High-<strong>Yield</strong> 7+ Year <strong>Index</strong>) with a B+, B, or B- rating from<br />
Standard & Poor’s. <strong>The</strong> index may include bonds not rated by Standard & Poor’s,<br />
but rated B1, B2 or B3 by Moody’s. (Base date: January 1985.)<br />
All CCC-Rated <strong>Index</strong><br />
<strong>The</strong> All CCC-Rated <strong>Index</strong> includes those bonds in the High-<strong>Yield</strong> Market <strong>Index</strong> (and<br />
before January 1989, the High-<strong>Yield</strong> 7+ Year <strong>Index</strong>) with a CCC+ to C rating from<br />
Standard & Poor’s. <strong>The</strong> index may include bonds not rated by Standard & Poor’s,<br />
but rated Caa to C by Moody’s. (Base date: January 1985.)<br />
Additional <strong>Index</strong>es<br />
Bankrupt/Default <strong>Index</strong><br />
<strong>The</strong> Bankrupt/Default <strong>Index</strong> includes all securities (previously in the High-<strong>Yield</strong><br />
Market <strong>Index</strong>) of companies that have already filed or are soon expected to file for<br />
Chapter 7 or Chapter 11 bankruptcy protection (see Special Situations section<br />
above). <strong>The</strong> index also includes bonds of companies that have missed or expect to<br />
miss required interest payments. (Base date: January 1991.)<br />
<strong>Citigroup</strong> <strong>Global</strong> Markets 45
October 20, 2003<br />
<strong>Citigroup</strong> <strong>Global</strong> <strong>Fixed</strong>-<strong>Income</strong> <strong>Index</strong> <strong>Catalog</strong> — 2003 Edition<br />
US High-<strong>Yield</strong> Market Capped <strong>Index</strong> SM<br />
<strong>The</strong> US High-<strong>Yield</strong> Market Capped <strong>Index</strong> uses the US High-<strong>Yield</strong> Market <strong>Index</strong> as<br />
its foundation. In addition to the basic design criteria used in the creation of the<br />
High-<strong>Yield</strong> Market <strong>Index</strong> (outlined in Figure 31), we impose a cap on the par amount<br />
of each issuer and delay the entry of fallen angels following their downgrade.<br />
<strong>The</strong> US High-<strong>Yield</strong> Market Capped <strong>Index</strong> caps the total debt of any single individual<br />
issuer at US$5 billion par amount outstanding. When the total eligible par amount<br />
from one issuer exceeds US$5 billion, the par amount of each bond from this issuer<br />
is scaled pro rata to reduce the total to US$5 billion. By capping the par amount<br />
outstanding of large issuers, we limit the exposure these issuers have on the High-<br />
<strong>Yield</strong> Market Capped <strong>Index</strong>, but retain the characteristics of the issuer’s distribution<br />
across different maturities.<br />
<strong>The</strong> High-<strong>Yield</strong> Market Capped <strong>Index</strong> also addresses the disproportionate influence<br />
that a large, recently downgraded issuer can have on the index’s characteristics upon<br />
entry. This is accomplished by delaying the entry of a fallen angel issuer’s debt for a<br />
minimum of one month from its downgrade to high-yield status. Specifically, if an<br />
issuer’s debt is downgraded to BB+/Ba1 or below by both S&P and Moody’s, it will<br />
be eligible for the High-<strong>Yield</strong> Market Capped <strong>Index</strong> after a waiting period of one full<br />
calendar month. For example, if an issuer’s debt is downgraded to high-yield status<br />
any day during the calendar month of May, it will be eligible for inclusion in the July<br />
High-<strong>Yield</strong> Market Capped <strong>Index</strong>. This aspect of the criteria provides time for the<br />
market to evaluate and adjust to any credit events associated with the fallen angels.<br />
In addition, it allows investors time to assess the value and risk of fallen angels<br />
without being underweighted in any sectors in which they are included.<br />
Figure 34 details the design criteria and calculation assumptions for the High-<strong>Yield</strong><br />
Market Capped <strong>Index</strong>. 11<br />
11<br />
For a detailed introductory explanation, please see Introducing the Salomon Smith Barney US High-<strong>Yield</strong> Market Capped <strong>Index</strong> SM .<br />
46<br />
<strong>Citigroup</strong> <strong>Global</strong> Markets
October 20, 2003<br />
<strong>Citigroup</strong> <strong>Global</strong> <strong>Fixed</strong>-<strong>Income</strong> <strong>Index</strong> <strong>Catalog</strong> — 2003 Edition<br />
Figure 34. US High-<strong>Yield</strong> Market Capped <strong>Index</strong> — Design Criteria and Calculation Assumptions<br />
Stated Coupon<br />
Minimum Maturity<br />
Weighting<br />
Minimum Size Outstanding<br />
(Prior to Capping)<br />
Maximum Size Outstanding<br />
Composition<br />
Maximum Quality<br />
Minimum Quality<br />
Reinvestment of Cash Flow<br />
Calculation Frequency<br />
<strong>Fixed</strong> rate<br />
One year<br />
Market capitalization updated once a month<br />
Entry: US$100 million minimum outstanding per issue when the issuer has a minimum of<br />
US$400 million total outstanding debt that qualifies for inclusion, or US$200 million minimum<br />
outstanding per issue when the issuer does not meet the US$400 million minimum.<br />
Exit: A bond will exit when its amount outstanding falls below US$100 million par amount. An<br />
issuer that has already satisfied the US$400 million requirement will remain in the index —<br />
even if the total par amount outstanding of its bonds drops below the US$400 million minimum.<br />
Capped at US$5 billion maximum amount outstanding per issuer.<br />
Cash-pay, zero-to-full (ZTF), pay-in-kind (PIK), step-coupon bonds, and Rule 144A bonds issued<br />
by corporations domiciled in the United States or Canada only.<br />
Fallen angels: entry is subject to a waiting period of one full calendar month.<br />
BB+/Ba1 by both S&P and Moody's<br />
C by S&P or Moody’s<br />
Continuous at the daily average of the one-month Treasury Bill for the calculation period<br />
Monthly and daily<br />
Pricing<br />
Individual <strong>Citigroup</strong> trader pricing at 3:00 PM New York time with supplemental pricing provided<br />
by an outside source<br />
Settlement Date<br />
Monthly: Last calendar day<br />
Daily: Same day except last business day of the month, when settlement is last calendar day<br />
Base Date January 2002<br />
Source: <strong>Citigroup</strong>.<br />
<strong>Citigroup</strong> <strong>Global</strong> Markets 47
October 20, 2003<br />
<strong>Citigroup</strong> <strong>Global</strong> <strong>Fixed</strong>-<strong>Income</strong> <strong>Index</strong> <strong>Catalog</strong> — 2003 Edition<br />
<strong>Global</strong> Emerging Market Sovereign<br />
Bond <strong>Index</strong> (ESBI) SM<br />
<strong>The</strong> <strong>Global</strong> Emerging Market Sovereign Bond <strong>Index</strong> (ESBI) includes Brady bonds<br />
and US dollar denominated emerging market sovereign debt issued in the global,<br />
Yankee, and Eurodollar markets excluding loans. <strong>The</strong> ESBI offers diversification<br />
benefits with respect to the geographical and asset class dimensions. <strong>The</strong>y comprise<br />
debt in more than 25 countries including emerging markets in Africa, Asia, Europe,<br />
and Latin America.<br />
We classify an emerging market as a sovereign with a maximum foreign debt rating<br />
of BBB+/Baa1 by S&P or Moody’s. Brady bonds, restructured in accordance with<br />
the Brady Plan, of countries with no foreign debt, or whose foreign debt is not rated<br />
by S&P and Moody’s, are included in the ESBI. We will exclude defaulted issues<br />
from the ESBI (the definition for default is provided in the section below).<br />
Figure 35 summarizes the design criteria and calculation assumptions for ESBI. 12<br />
Figure 35. <strong>Global</strong> Emerging Market Sovereign Bond <strong>Index</strong> (ESBI) — Design Criteria and Calculation<br />
Assumptions<br />
Stated Coupon<br />
<strong>Fixed</strong> rate or step, floating rate (Brady bonds only), no zero-coupon bonds<br />
Minimum Maturity<br />
One year<br />
Weighting<br />
Market capitalization updated once a month<br />
Minimum Amount Outstanding US$500 million amount outstanding<br />
Maximum Quality<br />
BBB+/Baa1 by S&P or Moody’s. Brady bonds, restructured in accordance to the Brady<br />
Plan, of countries with no foreign debt, or whose foreign debt is not rated by S&P and<br />
Moody’s, are included in the ESBI <strong>Index</strong>es<br />
Minimum Quality<br />
ESBI and ESBI-C: exclude defaulted issues<br />
ESBI-E and ESBI-CE: include defaulted issues<br />
Redemption Features<br />
Bullet, sinking fund, putable, or callable<br />
Calculation Frequency<br />
Daily<br />
Settlement Date<br />
Monthly: last calendar day<br />
Daily: same day except last business day of month when settlement is last calendar day<br />
Reinvestment of Cash Flow Continuous at the daily average of the one-month Treasury Bill for the calculation period<br />
Pricing<br />
Individual <strong>Citigroup</strong> trader pricing as of local market close:<br />
United States: 3:00 PM (New York)<br />
United Kingdom: 4:15 PM (London)<br />
Volatility<br />
10% single volatility<br />
<strong>Yield</strong> Curve<br />
<strong>Citigroup</strong> US Treasury Model (Off-the-run)<br />
Inception Date January 1996<br />
Source: <strong>Citigroup</strong>.<br />
12<br />
For a complete description of this index, please see Introducing the Salomon Smith Barney <strong>Global</strong> Emerging Market Sovereign<br />
Bond <strong>Index</strong>es, Salomon Smith Barney, January 31, 2002.<br />
48<br />
<strong>Citigroup</strong> <strong>Global</strong> Markets
October 20, 2003<br />
<strong>Citigroup</strong> <strong>Global</strong> <strong>Fixed</strong>-<strong>Income</strong> <strong>Index</strong> <strong>Catalog</strong> — 2003 Edition<br />
Figure 36. Chronological Summary of <strong>Global</strong> Emerging Market Sovereign Bond <strong>Index</strong> (ESBI), Brady Bond<br />
<strong>Index</strong>, and Emerging Market Mutual Fund (EMMF) Debt <strong>Index</strong> Events/Enhancements Undertaken<br />
Date Introduced a<br />
Enhancement/Event<br />
March 1990<br />
First Brady Bond Issue — Mexico<br />
June 1990<br />
January 1991<br />
March 1991<br />
February 1992<br />
December 1992<br />
January 1993<br />
March 1993<br />
May 1993<br />
November 1993<br />
January 1994<br />
February 1994<br />
Inclusion of Costa Rica and Philippines<br />
Inclusion of Venezuela<br />
Inclusion of Uruguay<br />
Inclusion of Nigeria<br />
Inclusion of Brazil IDU<br />
Two new Philippine Brady bonds issued<br />
Final Philippine Brady issued<br />
Inclusion of Argentina<br />
Final Argentine Brady issued<br />
Introduction of the Emerging Market Mutual Fund Debt <strong>Index</strong><br />
Minimum entry size increased to US$500 million from US$200 million<br />
Exclusion of Uruguay and Costa Rica<br />
May 1994<br />
Final Brazilian Brady bonds included<br />
August 1994<br />
Inclusion of Bulgaria<br />
November 1994<br />
Inclusion of Poland<br />
January 1995<br />
Settlement date changed to same day for daily calculations and last calendar day<br />
for monthly calculations<br />
Issuance cutoff for profile changed to the twenty-fifth day of the calendar month<br />
April 1995<br />
Inclusion of Ecuador<br />
May 1995<br />
Inclusion of Ecuador PDI<br />
July 1996<br />
Inclusion of Panama<br />
March 1997<br />
Inclusion of Peru<br />
December 1997<br />
EMMF <strong>Index</strong>: Russia V-bank loans exchanged for Russia IANs and Prins<br />
August 2000<br />
Brady Bond <strong>Index</strong>: Ecuador removed as a result of the Ecuador Brady Exchange<br />
EMMF <strong>Index</strong>: Ecuador 2012 and 2030 global bonds replace Bradys; Russia 2010 and 2030<br />
global bonds replace IANs and Prins as a result of an exchange<br />
September 2000<br />
Exclusion of Ivory Coast from ESBI due to default event<br />
January 2002<br />
Introduction of the <strong>Global</strong> Emerging Market Sovereign Bond <strong>Index</strong> (ESBI)<br />
January 2002<br />
Exclusion of Argentina from ESBI due to default event<br />
May 2003<br />
Mexico calls 2008 and 2033 Brady Par bonds<br />
Mexico sector drops out of Brady Bond <strong>Index</strong><br />
EMMF <strong>Index</strong> re-weighted to reflect termination of Mexico sector. Argentina and Brazil weights<br />
increase to 25% from 15% and 20%, respectively. Mexico weight drops to 0%.<br />
July 2003<br />
Brady Bond <strong>Index</strong> — Market coverage was migrated to the <strong>Global</strong> Emerging Market<br />
Sovereign <strong>Index</strong><br />
Discontinued EMMF <strong>Index</strong> b<br />
a Inception Date is April 1990 for Brady Bond <strong>Index</strong>; January 1994 for EMMF; and January 1996 for ESBI <strong>Index</strong>es.<br />
b An alternative to the EMMF<br />
<strong>Index</strong> is our ESBI-Capped, which limits exposure to any one country by placing a ceiling on the par value contribution of each country.<br />
IAN Interest Amortization Notes. IDU Interest Due and Unpaid. PDI Past-Due Interest. Prin Restructured Principal Loan.<br />
Source: <strong>Citigroup</strong>.<br />
Sector Classification<br />
For the ESBI <strong>Index</strong>es, we publish the characteristics of the <strong>Index</strong> in maturity, rating,<br />
region, and country breakdowns. <strong>The</strong> country classification is based on the sovereign<br />
government issuing the debt. In addition to US dollar terms, the returns are available<br />
in a total of 28 base currencies unhedged, including euro, sterling, and yen.<br />
<strong>Citigroup</strong> <strong>Global</strong> Markets 49
October 20, 2003<br />
<strong>Citigroup</strong> <strong>Global</strong> <strong>Fixed</strong>-<strong>Income</strong> <strong>Index</strong> <strong>Catalog</strong> — 2003 Edition<br />
Credit<br />
We impose a credit rule on the foreign sovereign markets included in the ESBI<br />
<strong>Index</strong>es. We classify an emerging market as a sovereign with a foreign debt rating of<br />
BBB+/Baa1 by S&P or Moody’s. A split-rated country with rating of A-/Baa1 or<br />
BBB+/A3 will be included in the ESBI <strong>Index</strong>es. If a country has foreign debt that is<br />
rated above BBB+/Baa1 by S&P and Moody’s, neither its foreign debt nor its Brady<br />
bonds will be included. <strong>The</strong> family of the ESBI <strong>Index</strong>es can be subdivided into the<br />
following credit quality sectors:<br />
Investment-Grade<br />
Recognizing that some investment-grade sovereign bonds resemble emerging market<br />
products in valuation and trading, we include the Brady bonds and the sovereign debt<br />
that are in our US dollar WorldBIG <strong>Index</strong> with a maximum rating of BBB+/Baa1 by<br />
either S&P or Moody’s. Split-rated issues (Five Bs, A-/Baa1, BBB+/A3) would be<br />
included in this category.<br />
Sub-Investment-Grade<br />
Sub-investment-grade comprises below-investment-grade Brady bonds and the<br />
sovereign debt with a maximum rating of BB+/Ba1 by both S&P and Moody’s. This<br />
sector excludes defaulted bonds.<br />
Default<br />
A country’s bonds are placed in the Extended <strong>Index</strong>es if the sovereign government<br />
meets the following default criteria:<br />
1 Failure to pay: <strong>The</strong> sovereign has failed to make a full principal or interest<br />
payment by the due date (including any applicable grace period).<br />
2 Repudiation/moratorium: <strong>The</strong> sovereign repudiates or challenges the validity of<br />
its bonds, or declares a moratorium or standstill applicable to the bond payments.<br />
3 Acceleration: <strong>The</strong> sovereign bonds become due and payable in full or eligible for<br />
acceleration by meeting the conditions of acceleration specified in their terms.<br />
4 Restructuring: <strong>The</strong> sovereign, because of a deterioration in financial conditions<br />
or creditworthiness, changes in the financial terms or causes subordination of its<br />
bonds not provided for in their terms and imposes such changes on bondholders.<br />
Sector-Level Spread Computation<br />
With the ESBI <strong>Index</strong>es, we introduce a new methodology in computing sector-level<br />
spread by weighting the spreads with dollar duration as follows:<br />
sprd<br />
sector<br />
n<br />
∑<br />
sprd<br />
i=<br />
1<br />
=<br />
n<br />
∑<br />
j = 1<br />
i<br />
× mkv<br />
mkv<br />
j<br />
i<br />
× spddur<br />
× spddur<br />
j<br />
i<br />
In this equation, n is the number of issues in the sector and for each issue; sprd is the<br />
stripped spread; mkv is market value; and spddur is the spread duration. We refer to<br />
the product of the market value and the spread duration as the spread-dollar duration.<br />
This methodology will calculate the average spread of a sector according to both the<br />
market value and the duration of the underlying issues within the sector. Weighting<br />
50<br />
<strong>Citigroup</strong> <strong>Global</strong> Markets
October 20, 2003<br />
<strong>Citigroup</strong> <strong>Global</strong> <strong>Fixed</strong>-<strong>Income</strong> <strong>Index</strong> <strong>Catalog</strong> — 2003 Edition<br />
by spread-dollar duration helps to more accurately reflect changes to the value of the<br />
portfolio associated with spread curve movement by assigning a larger weight to<br />
securities with larger spread duration. For example, given two bonds of the same<br />
market value, the spread of the long-duration bond will have a larger weight in the<br />
sector-level spread than the spread of the short-duration bond.<br />
Related Benchmarks and Definitions<br />
<strong>Global</strong> Emerging Market Sovereign — Capped Bond <strong>Index</strong> (ESBI-C)<br />
<strong>The</strong> <strong>Global</strong> Emerging Market Sovereign-Capped Bond <strong>Index</strong> (ESBI-C) represents a<br />
modified version of the ESBI. It imposes a maximum par amount of US dollar 15<br />
billion per country, thereby limiting the effect of debt-burdened countries on index<br />
characteristics and performance. Large debt markets can be explained by one of two<br />
reasons: <strong>The</strong>ir countries have large economies with reasonable debt-to-GDP ratios,<br />
or, they have smaller economies and larger debt-to-GDP ratios. <strong>The</strong> former are more<br />
likely to have stable outstanding amounts and stable or even increasing prices<br />
leading to positive returns. <strong>The</strong> latter might be expected to have unstable outstanding<br />
amounts and fluctuating prices resulting in volatile returns. Capping the par size of a<br />
country will prevent the latter group from dominating.<br />
<strong>Global</strong> Emerging Market Sovereign-Extended Bond <strong>Index</strong> (ESBI-E)<br />
and <strong>Global</strong> Emerging Market Sovereign-Capped Extended Bond<br />
<strong>Index</strong> (ESBI-CE)<br />
<strong>The</strong> ESBI-Extended Bond <strong>Index</strong> (ESBI-E) and ESBI-Capped Extended Bond <strong>Index</strong><br />
(ESBI-CE) capture the bonds that are excluded from the ESBI and ESBI-Capped<br />
because of default by the issuer.<br />
For a country to be moved to the Extended <strong>Index</strong>es, at least one foreign currency<br />
debt that is a direct obligation of the sovereign government in the ESBI and ESBI-<br />
Capped will meet the default criteria stated above.<br />
In the event that a country defaults, all its issues in the ESBI and ESBI-Capped,<br />
including its Brady bonds, will be moved to the Extended <strong>Index</strong>es. We will also<br />
adjust the returns for the bonds to reflect the loss of coupon payments or accrued<br />
interest, where applicable. <strong>The</strong> adjustment occurs at the month-end following the<br />
default of the issuer. <strong>The</strong> return calculation for the default issues reflects only<br />
principal gains or losses.<br />
Additional Definitions<br />
Spread Duration<br />
Spread duration is a measure of relative changes in the full price because of changes<br />
in the stripped spread.<br />
Stripped <strong>Yield</strong><br />
<strong>Yield</strong> calculated on cash flows reduced by any guaranteed payments of principal and<br />
interest and with the price reduced by the present value of the guaranteed payments.<br />
<strong>Citigroup</strong> <strong>Global</strong> Markets 51
October 20, 2003<br />
<strong>Citigroup</strong> <strong>Global</strong> <strong>Fixed</strong>-<strong>Income</strong> <strong>Index</strong> <strong>Catalog</strong> — 2003 Edition<br />
Stripped Spread<br />
<strong>The</strong> spread (in basis points) over the pricing yield curve for the unguaranteed portion<br />
of a security’s cash flows, equal to the amount that, when added to each of the yield<br />
curve’s spot rates, makes the present value of the unguaranteed portion of the cash<br />
flows equal to the price reduced by the present value of the guaranteed payments.<br />
Blended <strong>Yield</strong><br />
Blended yield is the yield obtained from discounting both the sovereign and<br />
collateral component of future cash flows.<br />
Cash Flow <strong>Yield</strong><br />
<strong>The</strong> rate of return indicated by the security’s full price, settlement date, and assumed<br />
cash flows.<br />
Cash Flow Spread<br />
<strong>The</strong> security’s yield, minus the yield of a suitable benchmark security, in basis points.<br />
52<br />
<strong>Citigroup</strong> <strong>Global</strong> Markets
October 20, 2003<br />
<strong>Citigroup</strong> <strong>Global</strong> <strong>Fixed</strong>-<strong>Income</strong> <strong>Index</strong> <strong>Catalog</strong> — 2003 Edition<br />
World Money Market <strong>Index</strong> SM<br />
<strong>The</strong> World Money Market <strong>Index</strong> approximates the performance of money market<br />
instruments in the following 17 currencies: US dollar, Canadian dollar, Czech<br />
koruna, Danish kroner, euro, Hungarian forint, Norwegian krone, Polish zloty,<br />
Swedish krona, Swiss franc, UK sterling, Australian dollar, Hong Kong dollar,<br />
Japanese yen, New Zealand dollar, Singapore dollar, and South African rand. <strong>The</strong><br />
index tracks the following instruments: one-, two-, three-, six-, and 12-month<br />
Eurodeposits. We believe that Eurodeposits represent a common, liquid asset class<br />
across currencies and provide a good proxy for short-term markets.<br />
We compute returns daily and monthly for each of these instruments in their local<br />
currencies and in US dollar terms.<br />
<strong>The</strong> index dates back to December 1997 and measures the return of money market<br />
instruments, making the following assumptions:<br />
➤ All Eurodeposits are held to maturity.<br />
➤ <strong>The</strong> index invests only in Eurodeposits with maturities that correspond to the<br />
index. For example, the three-month US Dollar Money Market <strong>Index</strong> invests<br />
only in three-month US Dollar Eurodeposits, and the six-month Japanese yen<br />
invests only in six-month Japanese yen Eurodeposits.<br />
➤ For each index, at the beginning of each month, a fraction of the index matures<br />
and is rolled over into a new Eurodeposit of the same maturity. In any given<br />
month, the index includes a group of Eurodeposits equal in number to the<br />
number of months in the maturity of instruments in that particular index. For<br />
example, a three-month index is at any given time composed of three threemonth<br />
Eurodeposits, and at the beginning of each month one of the three<br />
Eurodeposits matures and is rolled over into a new three-month Eurodeposit.<br />
Similarly, a six-month index is at any given time composed of six six-month<br />
Eurodeposits, and at the beginning of each month one of the six Eurodeposits<br />
matures and is rolled over into a new six-month Eurodeposit.<br />
➤ <strong>The</strong> returns for any given maturity index are computed from the actual<br />
Eurodeposits that constitute the index in that particular month. For example, the<br />
return for October for the three-month indexes would include the return of a<br />
laddered investment from July, August, and September. At the end of October,<br />
the July 31 Eurodeposit would mature and a new Eurodeposit would be included<br />
as of October 31 to continue the ladder for future returns. More details of return<br />
computation are given in the next section.<br />
➤ For one-month Eurodeposits, a new Eurodeposit replaces a matured Eurodeposit<br />
at the beginning of every month and the returns correspond to the Eurodeposit<br />
rate for the month for which the returns are being computed.<br />
<strong>Citigroup</strong> <strong>Global</strong> Markets 53
October 20, 2003<br />
<strong>Citigroup</strong> <strong>Global</strong> <strong>Fixed</strong>-<strong>Income</strong> <strong>Index</strong> <strong>Catalog</strong> — 2003 Edition<br />
Figure 37. World Money Market <strong>Index</strong> (WMMI) — Design Criteria<br />
Category<br />
Maturity<br />
Pricing<br />
Calculation Frequency<br />
Criteria<br />
One, Two, Three, Six, and 12 Months<br />
Monthly yields (bid), obtained from Reuters, 4:00 PM London time<br />
Daily<br />
Composition<br />
Generic Eurodeposits in the following currencies: US dollar, Canadian dollar, Czech koruna,<br />
Danish kroner, euro, Hungarian forint, Norwegian krone, Polish zloty, Swedish krona, Swiss<br />
franc, UK sterling, Australian dollar, Hong Kong dollar, Japanese yen, New Zealand dollar,<br />
Singapore dollar, and South African rand<br />
Base Date December 31, 1997<br />
Source: <strong>Citigroup</strong>.<br />
Figure 38. Chronological Summary of World Money Market <strong>Index</strong> (WMMI) Events/Enhancements<br />
Date Introduced<br />
January 1978<br />
January 1999<br />
April 2000<br />
November 2000<br />
January 2001<br />
Source: <strong>Citigroup</strong>.<br />
Enhancement/Event<br />
Original Money Market <strong>Index</strong> introduced: Equally weighted composite of three-month deposits<br />
in eight currencies (US dollar, Canadian dollar, Deutschemark, Dutch guilder, French franc,<br />
Japanese yen, Swiss franc, and UK sterling)<br />
Expanded currency coverage to include Australian dollar, New Zealand dollar, Danish kroner,<br />
euro, Norwegian krone, and Swedish krona<br />
Discontinued tracking deposits in the Deutschemark, Dutch guilder, and French franc (all EMU<br />
currencies folded into the euro)<br />
Composition changed to cover one- and three-month Eurodeposits for each currency<br />
Introduction of Greece drachma one- and three-month indexes<br />
Greek drachma also included within the equally weighted composite WMMI<br />
Expanded currency coverage of the World Money Market <strong>Index</strong> to include six new currencies<br />
(Czech koruna, Hong Kong dollar, Hungarian forint, Polish zloty, Singapore dollar, and South<br />
African rand)<br />
Expanded maturity coverage of money market instruments to include the one-, two-, three-,<br />
six-, and 12-month Eurodeposits in each of the 18 currencies<br />
(Expansion in coverage does not affect the composite World Money Market <strong>Index</strong>es)<br />
Composite World Money Market <strong>Index</strong> discontinued<br />
Greece drachma indexes discontinued as Greece joins the EMU<br />
Steps for Local Currency Return Computation<br />
<strong>The</strong> return computation methodology is consistent across maturities. We detail below<br />
the steps for computing returns on three-month Eurodeposits for a given month, m.<br />
Step 1. Obtain the nominal three-month Eurodeposit rates (quoted on an annual<br />
basis), y m-i<br />
, as of the end of the months m-1, m-2, and m-3.<br />
Step 2. Convert y m-i<br />
into an effective term yield (equivalent to the three-month<br />
return), e m-i<br />
, for the three-month term starting on the last calendar day of month m-i<br />
and ending on the last calendar date of month m-i+3, using the actual number of days<br />
in the term and the day-count convention of the quoted rate (360 days per year for<br />
most, but not all, Eurodeposit rates):<br />
e m-i<br />
= y m-i<br />
* (Actual days in term)/360, i = 1,2,3<br />
Step 3. Calculate the effective monthly return, r m-i<br />
, which when compounded through<br />
the length of the three-month term would result in the effective term yield computed<br />
in Step 2:<br />
r m-i<br />
= (1 + e m-i<br />
) Days in m / Days in 3-month term - 1, i = 1,2,3<br />
54<br />
<strong>Citigroup</strong> <strong>Global</strong> Markets
October 20, 2003<br />
<strong>Citigroup</strong> <strong>Global</strong> <strong>Fixed</strong>-<strong>Income</strong> <strong>Index</strong> <strong>Catalog</strong> — 2003 Edition<br />
Step 4. Calculate an average of the three monthly period yields derived in Step 3.<br />
This is the return on three-month deposits for the month m.<br />
<strong>The</strong> same method is used to compute month-to-date returns on three-month<br />
Eurodeposits; the number of days used in Step 3 is appropriately modified.<br />
For calculating returns for any other maturity, similar methodology is used. For<br />
example, to calculate returns for the six-month Eurodeposits for a given month m, we<br />
average the six effective monthly returns calculated using the six six-month<br />
Eurodeposit rates as of the end of months m-1, m-2, m-3, m-4, m-5, and m-6.<br />
For one-month Eurodeposits, since a new Eurodeposit replaces a matured<br />
Eurodeposit at the beginning of every month, the averaging in Step 4 is omitted for<br />
calculating returns.<br />
Sample Base Currency Return Computation<br />
<strong>The</strong> following example illustrates the computation steps for local and US dollar<br />
based returns on a three-month Sterling Eurodeposit.<br />
Figure 39. World Money Market <strong>Index</strong> (WMMI)— Assumed Conventions and Data<br />
Conventions<br />
Data<br />
Month for Which Returns Are Being Computed April 2003<br />
Quote Convention<br />
<strong>Yield</strong> (%/Annum)<br />
Day-Count Basis<br />
ACT/365<br />
<strong>Yield</strong>s January 31: 3.91%<br />
February 28: 3.60%<br />
March 31: 3.50%<br />
US Dollar/UK Sterling Spot Exchange Rates March 31: 1.58065<br />
April 30: 1.59825<br />
Source: <strong>Citigroup</strong>.<br />
Compute Local Currency Return<br />
Calculate the term yield:<br />
y January-3m<br />
= 3.91% * (28+31+30)/365 = 0.9534%<br />
y February-3m<br />
= 3.60% * (31+30+31)/365 = 0.9074%<br />
y March-3m<br />
= 3.50% * (30+31+30)/365 = 0.8726%<br />
where y month<br />
should be interpreted as the effective yield for the three-month return. In<br />
other words, the Eurodeposit that yielded 3.91% per annum on January 31 returns<br />
0.9534% for the three-month term (89 days).<br />
Calculate the effective monthly returns:<br />
y January-1m<br />
= (1+0.9534%) (30/89) – 1 = 0.3204%<br />
y February-1m<br />
= (1+0.9074%) (30/92) – 1 = 0.2950%<br />
y March-1m<br />
= (1+0.8726%) (30/91) – 1 = 0.2868%<br />
<strong>Citigroup</strong> <strong>Global</strong> Markets 55
October 20, 2003<br />
<strong>Citigroup</strong> <strong>Global</strong> <strong>Fixed</strong>-<strong>Income</strong> <strong>Index</strong> <strong>Catalog</strong> — 2003 Edition<br />
where y month-1m<br />
is the Eurodeposit return for the 30-day month of April. For example,<br />
the January 31 Eurodeposit returned 0.3204% for the month of April. This return, in<br />
turn, would compound over 89 days to yield y month-3m<br />
or 0.9534%.<br />
Compute the average of the monthly returns from above. This is our sector return for<br />
the month in local (sterling) terms.<br />
y avg<br />
= (y January-1m<br />
+ y February-1m<br />
+ y March-1m<br />
)/3 = 0.3007%<br />
Compute Currency Return<br />
C uk<br />
= (1.59825 – 1.58065)/(1.58065) = 1.1135%<br />
Compute Total Return (in US Dollar Terms)<br />
R usd<br />
= [(1+0.3007%) * (1+1.1135%)] - 1 = 1.418%<br />
Figure 40. World Money Market <strong>Index</strong> — Reuters Instrument Codes (RICs) Used to Obtain Monthly <strong>Yield</strong>s<br />
(Bid) for Eurodeposits<br />
Currency 1-Month 2-Month 3-Month 6-Month 12-Month<br />
US Dollar USD1MD USD2MD USD3MD USD6MD USD1YD<br />
Australian Dollar AUD1MD AUD2MD AUD3MD AUD6MD AUD1YD<br />
Canadian Dollar CAD1MD CAD2MD CAD3MD CAD6MD CAD1YD<br />
New Zealand Dollar NZD1MD NZD2MD NZD3MD NZD6MD NZD1YD<br />
Japanese Yen JPY1MD JPY2MD JPY3MD JPY6MD JPY1YD<br />
Danish Krone DKK1MD DKK2MD DKK3MD DKK6MD DKK1YD<br />
Euro EUR1MD EUR2MD EUR3MD EUR6MD EUR1YD<br />
Norwegian Krone NOK1MD NOK2MD NOK3MD NOK6MD NOK1YD<br />
Swedish Krona SEK1MD SEK2MD SEK3MD SEK6MD SEK1YD<br />
Swiss Franc CHF1MD CHF2MD CHF3MD CHF6MD CHF1YD<br />
UK Sterling GBP1MD GBP2MD GBP3MD GBP6MD GBP1YD<br />
Czech Koruna CZK1MD CZK2MD CZK3MD CZK6MD CZK1YD<br />
Hong Kong Dollar HKD1MD HKD2MD HKD3MD HKD6MD HKD1YD<br />
Hungarian Forint HUF1MD HUF2MD HUF3MD HUF6MD HUF1YD<br />
Polish Zloty PLN1MD PLN2MD PLN3MD PLN6MD PLN1YD<br />
Singapore Dollar SGD1MD SGD2MD SGD3MD SGD6MD SGD1YD<br />
South African Rand ZAR1MD ZAR2MD ZAR3MD ZAR6MD ZAR1YD<br />
Source: Reuters.<br />
56<br />
<strong>Citigroup</strong> <strong>Global</strong> Markets
October 20, 2003<br />
<strong>Citigroup</strong> <strong>Global</strong> <strong>Fixed</strong>-<strong>Income</strong> <strong>Index</strong> <strong>Catalog</strong> — 2003 Edition<br />
Discontinued <strong>Index</strong>es<br />
<strong>The</strong> <strong>Citigroup</strong> indexes in this section have been discontinued.<br />
Brady Bond <strong>Index</strong><br />
Market Coverage of the Brady Bonds was migrated to the ESBI <strong>Index</strong>. <strong>The</strong><br />
performance and characteristics will be available via the Brady Bond sector of ESBI<br />
family of indexes.<br />
<strong>The</strong> Brady Bond <strong>Index</strong>, was designed to measure the performance of US dollar<br />
emerging markets debt that has been restructured under the Brady Plan and has a<br />
minimum of US$500 million per issue amount outstanding. <strong>The</strong> index measures<br />
returns for all Brady bonds beginning with the first issue by Mexico in March 1990.<br />
Emerging Markets Mutual Fund (EMMF) Debt <strong>Index</strong> SM<br />
<strong>The</strong> Emerging Markets Mutual Fund (EMMF) Debt <strong>Index</strong>, discontinued on June 30,<br />
2003, was designed to provide the managers of regulated mutual funds with a more<br />
appropriate benchmark than the Brady Bond <strong>Index</strong>. Regulated mutual funds face<br />
diversification rules that prevent the managers from matching the market weightings<br />
of the Brady Bond <strong>Index</strong>, which are concentrated in a few large credits. <strong>The</strong> EMMF<br />
<strong>Index</strong> was constructed to conform to mutual fund diversification regulations. Under<br />
these rules, half of a portfolio must be invested in individual credits in amounts of<br />
less than 5% of the total portfolio size. <strong>The</strong> remaining half may be invested in<br />
positions not greater than 25%.<br />
An alternative to the EMMF <strong>Index</strong> is our ESBI-Capped <strong>Index</strong>, which limits exposure<br />
to any one country by placing a ceiling on the par value contribution of each country.<br />
Safest of High-<strong>Yield</strong>s <strong>Index</strong><br />
<strong>The</strong> Safest of High-<strong>Yield</strong>s <strong>Index</strong>, discontinued on June 30, 2003, was a marketcapitalization-weighted<br />
managed portfolio of high-yield securities selected by<br />
<strong>Citigroup</strong> credit research analysts for high-coupon income and stable or improving<br />
credit quality.<br />
Government and Eurobond Composite <strong>Index</strong> (GECI) SM<br />
<strong>The</strong> GECI was discontinued in January 2002. It was originally created to track the<br />
performance of the international investment-grade bond markets. With the launch of<br />
the World Broad Investment-Grade (WorldBIG) Bond <strong>Index</strong> in August 2000, the<br />
GECI benchmark grew obsolete. <strong>The</strong> WorldBIG <strong>Index</strong> is designed to be our broadest<br />
market measure for global investors. It is a liquid-replicable index that offers a<br />
natural extension of credit risk for investors who favor traditional government debt.<br />
<strong>Citigroup</strong> <strong>Global</strong> Markets 57
October 20, 2003<br />
<strong>Citigroup</strong> <strong>Global</strong> <strong>Fixed</strong>-<strong>Income</strong> <strong>Index</strong> <strong>Catalog</strong> — 2003 Edition<br />
World Bond <strong>Index</strong> SM<br />
<strong>The</strong> World Bond <strong>Index</strong> was discontinued on December 31, 1995. This index served<br />
as a broad benchmark measuring the performance of government, Eurobonds, and<br />
foreign bonds in ten currencies. <strong>The</strong> index was sample-based and focused on the<br />
five-year and longer sectors of these markets. It was introduced in 1981 and had<br />
historical returns dating back to January 1978. <strong>The</strong> introduction of the World<br />
Government Bond <strong>Index</strong> in 1986 made the World Bond <strong>Index</strong> obsolete.<br />
58<br />
<strong>Citigroup</strong> <strong>Global</strong> Markets
October 20, 2003<br />
<strong>Citigroup</strong> <strong>Global</strong> <strong>Fixed</strong>-<strong>Income</strong> <strong>Index</strong> <strong>Catalog</strong> — 2003 Edition<br />
<strong>Fixed</strong>-<strong>Income</strong> Glossary<br />
Asset-Backed<br />
Financings that are backed purely by pools of assets and supporting credit<br />
enhancement structures, such as American Express Master Trust issues that are<br />
backed by credit card loans.<br />
Corporate<br />
This sector includes bonds issued by industrial companies, utilities, and financial<br />
service companies, including those that carry bank guarantees. In addition, special<br />
purpose debt-issuing subsidiaries of such corporations are included, as are<br />
subsidiaries whose primary purpose is to provide financing to customers for the<br />
purchase and/or lease of the parent companies’ products, for example, General<br />
Motors Acceptance Corporation.<br />
Covered<br />
We define this sector to include all Pfandbriefe and Pfandbrief-like securities<br />
predominant in the euro region.<br />
Eurodollar Bond<br />
A bond issued outside the boundaries of the United States that pays interest and<br />
principal in US dollars.<br />
Euro Medium-Term Note<br />
A facility for an issuer to issue debt opportunistically in the Euromarkets in various<br />
currencies, maturities, and structures, using a single set of documentation.<br />
European Economic and Monetary Union (EMU) Member<br />
Countries (as of October 2003)<br />
Austria, Belgium, Finland, France, Germany, Greece, Ireland, Italy, Luxembourg,<br />
the Netherlands, Portugal, and Spain.<br />
European Union (EU) Member States (as of October 2003)<br />
Austria, Belgium, Denmark, Finland, France, Germany, Greece, Ireland, Italy,<br />
Luxembourg, the Netherlands, Portugal, Spain, Sweden, and the United Kingdom.<br />
<strong>Citigroup</strong> <strong>Global</strong> Markets 59
October 20, 2003<br />
<strong>Citigroup</strong> <strong>Global</strong> <strong>Fixed</strong>-<strong>Income</strong> <strong>Index</strong> <strong>Catalog</strong> — 2003 Edition<br />
Eurosterling Bond<br />
A bond issued outside the boundaries of the United Kingdom that pays interest and<br />
principal in British pounds sterling.<br />
Euroyen Bond<br />
A bond issued outside the boundaries of Japan that pays interest and principal in<br />
Japanese yen.<br />
Financial<br />
<strong>The</strong> issuer must be solely engaged in the financial sector. This includes commercial<br />
and investment banks, insurance companies, savings and loans, and building<br />
societies. It also includes the financial subsidiaries of conglomerates when the<br />
subsidiary does not operate for the primary benefit of the manufacturing arm (such as<br />
General Electric Capital Corporation).<br />
<strong>Global</strong> Bond<br />
Registered bonds issued simultaneously within and outside the United States. <strong>The</strong>se<br />
issues are traded across all markets and can settle through Cedel, Euroclear, and DTC.<br />
Group-of-Ten (G-10) Countries<br />
Belgium, Canada, France, Germany, Italy, Japan, the Netherlands, Sweden, the<br />
United Kingdom, and the United States (Switzerland is the honorary 11th member of<br />
the G-10).<br />
National Currency Unit (NCU)<br />
<strong>The</strong> pre-EMU currencies of the EMU member countries (e.g., French francs). <strong>The</strong>se<br />
currencies continue to exist and circulate, but the intra-NCU exchange rates and the<br />
NCU exchange rates with the euro are irrevocably locked. Most EMU sovereign debt<br />
issued in NCUs has been redenominated into euros, but most other bonds remain<br />
denominated in NCUs. For index purposes, we quote all NCU amounts in euro terms<br />
regardless of whether individual bonds have redenominated or not, since there is no<br />
foreign exchange effect.<br />
Official and Agency<br />
This includes all local government, provincial, and city debt as well as other agencies<br />
such as nonsovereign-guaranteed central and state banks and export credit agencies.<br />
Issues in this sector may have provincial or local government guarantees, but do not<br />
have sovereign guarantees. Examples include Canadian provinces, Bank of Greece,<br />
Crédit Local de France, and the German Landesbanks.<br />
60<br />
<strong>Citigroup</strong> <strong>Global</strong> Markets
October 20, 2003<br />
<strong>Citigroup</strong> <strong>Global</strong> <strong>Fixed</strong>-<strong>Income</strong> <strong>Index</strong> <strong>Catalog</strong> — 2003 Edition<br />
Regulation S and Rule 144A<br />
Regulation S (Reg S) of the US Securities and Exchange Commission (SEC) sets<br />
forth a “safe harbor” that allows issuers exemption from the registration<br />
requirements of the Securities Act of 1933, provided that such securities are not<br />
offered in the primary market to US investors. Rule 144A modifies the primary<br />
market restriction to allow the sale of such securities to Qualified Institutional<br />
Buyers (QIBs).<br />
Securities issued under Reg S and sold initially to non-US investors may subsequently<br />
be sold to US investors in the secondary market after a brief “seasoning” period has<br />
elapsed, typically 40 days. However, a holding of securities issued under Reg S and<br />
sold initially to QIBs under Rule 144A cannot be on-sold to other US investors in the<br />
secondary market until a two-year seasoning period has elapsed.<br />
<strong>The</strong> US Broad Investment-Grade Bond <strong>Index</strong> includes securities issued under Rule<br />
144A that have registration rights.<br />
<strong>The</strong> High-<strong>Yield</strong> Market <strong>Index</strong> includes issues available for sale under Rule 144A<br />
immediately on satisfaction of our entry criteria. Before 1999, we delayed entry of<br />
these securities until the SEC registration process was completed.<br />
<strong>The</strong> Eurodollar <strong>Index</strong> includes these securities immediately on satisfaction of our<br />
entry criteria.<br />
Seasoning<br />
<strong>The</strong> rules defining the length of time by which a bond is seasoned are complex and<br />
vary for different issuers; there has been a trend toward shortening this period. We<br />
adopt a simplifying rule for the purpose of determining when a bond becomes<br />
seasoned: An issue is to be deemed seasoned for the purposes of the Eurobond<br />
<strong>Index</strong>es 40 calendar days after the initial payment date.<br />
Sovereign and Sovereign-Guaranteed<br />
This sector includes sovereign debt and any issues carrying an explicit sovereign<br />
guarantee irrespective of the function of the issuer, for example, Qantas Airways and<br />
Kobe City.<br />
Supranational<br />
Supranationals are supported by the capital of more than one sovereign state, such as<br />
the World Bank and the Asian Development Bank.<br />
Yankee<br />
A bond denominated in US dollars issued in the United States by foreign banks,<br />
sovereigns, other government entities, and corporations whose parent companies<br />
resides outside the United States. <strong>The</strong>se bonds are registered with the SEC.<br />
<strong>Citigroup</strong> <strong>Global</strong> Markets 61
Disclosure Appendix<br />
ANALYST CERTIFICATION<br />
For each security or issuer mentioned in this compendium report, the respective analyst (or analysts) who cover the security or issuer certifies that all of the views expressed<br />
in this research report accurately reflect the analyst's (or analysts') personal views about any and all of the subject securities or issuer(s). <strong>The</strong> analyst (or analysts) also certify<br />
that no part of the analyst's compensation was, is, or will be directly or indirectly related to the specific recommendation(s) or view(s) in this report.<br />
Other Disclosures<br />
ADDITIONAL INFORMATION AVAILABLE UPON REQUEST<br />
Citibank, N.A., London Branch and <strong>Citigroup</strong> <strong>Global</strong> Markets Inc, including its parent, subsidiaries and/or affiliates (“the Firm”), may make a market in the securities<br />
discussed in this report and may sell to or buy from customers, as principal, securities recommended in this report. <strong>The</strong> Firm may have a position in securities or<br />
options of any issuer recommended in this report. An employee of the Firm may be a director of an issuer recommended in this report. <strong>The</strong> Firm may perform or<br />
solicit investment banking or other services from any issuer recommended in this report.<br />
Within the past three years, the Firm may have acted as manager or co-manager of a public offering of the securities of any issuer recommended in this report. Securities<br />
recommended, offered, or sold by the Firm : (i) are not insured by the Federal Deposit Insurance Corporation; (ii) are not deposits or other obligations of any insured<br />
depository institution (including Citibank); and (iii) are subject to investment risks, including the possible loss of the principal amount invested. <strong>The</strong> Firm are regular issuers<br />
of, and trade in including position taking), traded financial instruments linked to securities which may have been reported on in the preceding research report.<br />
Investing in non-U.S. securities, including ADR’s entails certain risks. <strong>The</strong> securities of non-U.S. issuers may not be registered with, nor be subject to the reporting<br />
requirements of, the U.S. Securities and Exchange Commission. <strong>The</strong>re may be limited information available on foreign securities. Foreign companies are generally not<br />
subject to uniform audit and reporting standards, practices and requirements comparable to those in the U.S. Securities of some foreign companies may be less liquid<br />
and their prices more volatile than securities of comparable U.S. companies. In addition, exchange rate movements may have an adverse effect on the value of an<br />
investment in a foreign stock and its corresponding dividend payment for U.S. investors. Net dividends to ADR investors are estimated, using withholding tax rates<br />
conventions, deemed accurate, but investors are urged to consult their tax advisor for exact dividend computations.<br />
Although information has been obtained from and is based upon sources the Firm believes to be reliable, we do not guarantee its accuracy and it may be incomplete or<br />
condensed. All opinions and estimates constitute the Firm 's judgement as of the date of the report and are subject to change without notice. This report is for informational<br />
purposes only and is not intended as an offer or solicitation for the purchase or sale of a security. This research report does not constitute an offer of securities. Any<br />
decision to purchase securities mentioned in this research must take into account existing public information on such security or any registered prospectus.<br />
Investing in non-US securities by US persons may entail certain risks. Investors who have received this report from the Firm may be prohibited in certain US States<br />
from purchasing securities mentioned in this report from the Firm; please ask your Financial Consultant for additional details.This report is distributed in the United<br />
Kingdom by Citibank, N.A. London Branch or <strong>Citigroup</strong> <strong>Global</strong> Markets Limited, <strong>Citigroup</strong> Centre, Canada Square, Canary Wharf, London E14 5LB, UK. This material is<br />
directed exclusively at market professional and institutional investor customers and is not for distribution to private customers, as defined by the rules of the Financial<br />
Services Authority, who should not rely on this material. Moreover, any investment or service to which the material may relate will not be made available to such<br />
private customers. This material may relate to investments or services of a person outside of the United Kingdom or to other matters which are not regulated by the<br />
Financial Services Authority and further details as to where this may be the case are available upon request in respect of this material. If this publication is being made<br />
available in certain provinces of Canada by <strong>Citigroup</strong> <strong>Global</strong> Markets (Canada) Inc. ("<strong>The</strong> Firm Canada"), the Firm Canada has approved this publication. If this report<br />
was prepared by the Firm (excluding Nikko <strong>Citigroup</strong> Limited) and distributed in Japan by Nikko <strong>Citigroup</strong> Limited, it is being so distributed under license. This report is<br />
made available in Australia, to non-retail clients through <strong>Citigroup</strong> <strong>Global</strong> Markets Australia Pty Limited (ABN 64 003 114 832), and to retail clients through Smith<br />
Barney <strong>Citigroup</strong> Australia Pty Ltd (ABN 10 009 145 555), Licensed Securities Dealers. In New Zealand it is made available through <strong>Citigroup</strong> <strong>Global</strong> Markets New<br />
Zealand Limited, a member firm of the New Zealand Stock Exchange. This report does not take into account the investment objectives, financial situation or particular<br />
needs of any particular person. Investors should obtain advice based on their own individual circumstances before making an investment decision. <strong>Citigroup</strong> <strong>Global</strong><br />
Markets (Pty) Limited is incorporated in the Republic of South Africa (company registration number 2000/025866/07) and its registered office is at Citibank Plaza, 145<br />
West Street, Sandown, Sandton, 2196, Republic of South Africa. <strong>The</strong> investments and services contained herein are not available to private customers in South Africa.<br />
This publication is made available in Singapore through <strong>Citigroup</strong> <strong>Global</strong> Markets Singapore Holdings Pte Ltd, a licensed Dealer and Investment Advisor. This report is<br />
being distributed in Hong Kong by or on behalf of, and is attributable to <strong>Citigroup</strong> <strong>Global</strong> Markets Asia Limited, 20th Floor, Three Exchange Square, Hong Kong.<br />
<strong>Citigroup</strong> <strong>Global</strong> Markets Inc. is a member of the Securities Investor Protection Corporation (SIPC). © <strong>Citigroup</strong> <strong>Global</strong> Markets Inc., 2003. All rights reserved Smith<br />
Barney is a division and service mark of <strong>Citigroup</strong> <strong>Global</strong> Markets Inc. and its affiliates and is used and registered throughout the world. <strong>Citigroup</strong> and the Umbrella<br />
Device are trademarks and service marks of Citicorp and its affiliates and are used and registered throughout the world. CitiFx Ò is a service mark of Citicorp. Any<br />
unauthorized use, duplication or disclosure is prohibited by law and may result in prosecution. Nikko is a service mark of Nikko Cordial Corporation.<br />
FI09D059