Determining the Orbital Period of the Cataclysmic Variable ...
Determining the Orbital Period of the Cataclysmic Variable ...
Determining the Orbital Period of the Cataclysmic Variable ...

You also want an ePaper? Increase the reach of your titles
YUMPU automatically turns print PDFs into web optimized ePapers that Google loves.
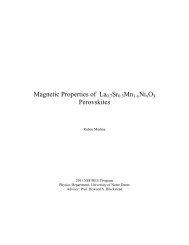
<strong>Determining</strong> <strong>the</strong> <strong>Orbital</strong> <strong>Period</strong> <strong>of</strong> <strong>the</strong> <strong>Cataclysmic</strong><br />
<strong>Variable</strong> CSS1204 Using Data from <strong>the</strong> Vatican<br />
Advanced Technology Telescope<br />
Amy Applegate<br />
2012 NSF/REU Program<br />
Physics Department, University <strong>of</strong> Notre Dame<br />
Advisor: Dr. Peter Garnavich
Abstract: Using time-resolved photometry from three nights <strong>of</strong> observing at <strong>the</strong> Vatican<br />
Advanced Technology Telescope (VATT), we obtained light curves <strong>of</strong> <strong>the</strong> cataclysmic<br />
variable (CV) CSS1204 (RA.11:11:26.87 Dec.+57:12:38.9(J2000)).From <strong>the</strong>se<br />
observations, we calculated <strong>the</strong> power spectrum <strong>of</strong> CSS1204 and determined <strong>the</strong> orbital<br />
period <strong>of</strong> <strong>the</strong> binary. We determined <strong>the</strong> orbital period for CSS1204 to be 0.8876 hours.<br />
Using <strong>the</strong> orbital period along with <strong>the</strong> pre-determined superhump period (p=0.9370 h),<br />
we can infer <strong>the</strong> mass ratio <strong>of</strong> <strong>the</strong> primary and secondary stars in this CV. We calculated<br />
a mass ratio <strong>of</strong> 0.458 using <strong>the</strong> fractional superhump excess for <strong>the</strong> minimum superhump<br />
period (P SH ) which was used in Kato et al. 2009.CSS1204 is unusual in that its period is<br />
approximately 25 minutes below <strong>the</strong> period minimum for hydrogen-rich CVs. The<br />
research outlined in this paper will be included in a forthcoming journal article about<br />
this star.<br />
Keywords: CSS1204, cataclysmic variable, orbital period, VATT<br />
Introduction<br />
“<strong>Cataclysmic</strong> variables (CVs) are compact binary systems in which <strong>the</strong> surface gas <strong>of</strong> a<br />
secondary star overflows and is accreted by a more massive white dwarf” (qtd. in Uemura, et al<br />
2001). A disk consisting <strong>of</strong> infalling matter forms around <strong>the</strong> primary star due to <strong>the</strong> angular<br />
momentum that needs to be conserved. In <strong>the</strong> accretion disk, viscosity occurs and as a result, <strong>the</strong><br />
disk material loses it angular momentum and eventually is accreted on <strong>the</strong> white dwarf star.<br />
When <strong>the</strong> density and temperature <strong>of</strong> <strong>the</strong> hydrogen layer in <strong>the</strong> accretion disk around <strong>the</strong> white<br />
dwarf rises to a considerable amount, an event known as a cataclysmic outburst (or<br />
superoutburst) will take place. During outbursts and superoutbursts, <strong>the</strong> system becomes much<br />
brighter. When observing a CV during a superoutburst, an additional modulation will appear in<br />
<strong>the</strong> light curve <strong>of</strong> <strong>the</strong> star, called a superhump. This event is caused by <strong>the</strong> precession <strong>of</strong> <strong>the</strong><br />
accretion disc and it can occur approximately every 20-300 days depending on <strong>the</strong> CV itself. The<br />
orbital periods <strong>of</strong> CVs are typically only several hours long with an observed period minimum<br />
close to 78 minutes. Very few CVs have orbital periods between 2-3 hours. This duration <strong>of</strong> time<br />
is known as <strong>the</strong> period gap.
CSS120422:111127+571239 (more commonly known as SBS 1108+574) is classified as a CV<br />
like <strong>the</strong> one mentioned above. It was first observed by <strong>the</strong> Catalina Real-Time Transient Survey<br />
(CRTS) during an outburst. As a result <strong>of</strong> later observations from <strong>the</strong> Japanese-run network,<br />
VSNET and Peter Garnavich, <strong>the</strong> binary star in CSS1204 was specifically classified as a SU<br />
UMa star. Garnavich, et al (2012) reported spectra showing strong Hydrogen emission along<br />
with <strong>the</strong> expected abundance <strong>of</strong> Helium emission present. Before this discovery, it was assumed<br />
that CSS1204 was a AM CVn star which are ultrashort-period CVs with no amounts <strong>of</strong> hydrogen<br />
in <strong>the</strong>ir spectra. “Stars which show both superoutbursts and superhumps are referred to as SU<br />
UMa stars” (Hellier, 2001). “Superhump oscillations with a period <strong>of</strong> 0.93 hours” were observed<br />
from CSS1204 (Garnavich, et al 2012). Superhumps are caused by <strong>the</strong> gravitational interaction<br />
between <strong>the</strong> disk and <strong>the</strong> secondary star. When <strong>the</strong> disk becomes asymmetric and precesses, it<br />
causes fluctuations in brightness which usually last slightly longer than <strong>the</strong> orbital period <strong>of</strong> <strong>the</strong><br />
CV.<br />
Figure 1. A summed “superCSS1204” FITS image showing <strong>the</strong> variable star and <strong>the</strong> four nearby<br />
comparison stars. Star A is <strong>the</strong> comparison star used in <strong>the</strong> aperture photometry. Var is <strong>the</strong> CV<br />
CSS1204.
Figure 2. This image 1 shows <strong>the</strong> Magnitude vs. Phase plot for <strong>the</strong> superhump period <strong>of</strong> CSS1204.<br />
The purpose <strong>of</strong> this paper is to describe <strong>the</strong> process and results from analyzing <strong>the</strong> power<br />
spectrum <strong>of</strong> CSS1204, in order to determine <strong>the</strong> orbital period. The superhump period for <strong>the</strong> CV<br />
CSS1204 is already known, but an orbital period in <strong>the</strong> quiescent state has yet to be determined.<br />
Knowing <strong>the</strong> orbital period for CSS1204 along with <strong>the</strong> pre-determined superhump period will<br />
allow us to derive <strong>the</strong> mass ratio <strong>of</strong> <strong>the</strong> primary white dwarf to <strong>the</strong> secondary star. If our orbital<br />
period is close to <strong>the</strong> superhump period determined by VSNET, <strong>the</strong>n <strong>the</strong>re will be a large mass<br />
ratio between <strong>the</strong> two components in <strong>the</strong> CV, but if our period is much shorter than <strong>the</strong><br />
superhump period, <strong>the</strong> mass ratio <strong>of</strong> <strong>the</strong> primary and secondary stars will be small. The mass<br />
ratio <strong>of</strong> this CV contains clues as to <strong>the</strong> nature <strong>of</strong> <strong>the</strong> secondary “donor” star. Comparing <strong>the</strong><br />
superhump period to <strong>the</strong> true orbital period <strong>of</strong> CSS1204 is <strong>the</strong> only method that will allow us to<br />
discover <strong>the</strong>se clues.<br />
1 This plot <strong>of</strong> <strong>the</strong> superhump period for CSS1204 was created by Univ. <strong>of</strong> Notre Dame School <strong>of</strong> Law student, Colin<br />
Littlefield.
Materials and Methods<br />
Situated atop Mt. Graham in Safford, Arizona, <strong>the</strong> VATT is operated by <strong>the</strong> Vatican Observatory<br />
in partnership with <strong>the</strong> University <strong>of</strong> Arizona. Its primary mirror consists <strong>of</strong> a 1.83-m f/1.0<br />
mirror. The location <strong>of</strong> <strong>the</strong> VATT atop Mt. Graham provides one <strong>of</strong> <strong>the</strong> best areas in <strong>the</strong> U.S. for<br />
seeing even without <strong>the</strong> use <strong>of</strong> adaptive optics. Observations <strong>of</strong> CSS1204 were recorded through<br />
<strong>the</strong> Blue (FWHM-94nm) and Red (FWHM-138nm) filters within <strong>the</strong> visible light spectrum. The<br />
CCD (Charge Coupled Device) used in <strong>the</strong> VATT is a STA0500A back illuminated 4k CCD. On<br />
<strong>the</strong> third night <strong>of</strong> observation, a thunderstorm passed over Mt. Graham creating bad seeing so as<br />
a result, CSS1204 was not observed.<br />
Image Reduction and Analysis Facility (IRAF) is a s<strong>of</strong>tware system that we utilized to prepare<br />
<strong>the</strong> images taken from <strong>the</strong> VATT. To extract chip [2] data from <strong>the</strong> original mosaic files, we used<br />
<strong>the</strong> imcopy package for each night’s pixel data. Once <strong>the</strong> chip [2] data was extracted from <strong>the</strong><br />
original mosaic files, bias images (exposures taken when <strong>the</strong> camera’s shutter is left shut) were<br />
combined using <strong>the</strong> imcombine package. Bias images are important in <strong>the</strong> image reduction<br />
process because <strong>the</strong>y eliminate readout noise from exposure to exposure and allows for better<br />
measurements <strong>of</strong> <strong>the</strong> star photometry. This created a “supersmallbias” which we subtracted from<br />
<strong>the</strong> CSS1204 FITS files using <strong>the</strong> imarith package.<br />
Using <strong>the</strong> IRAF package, qphot, we performed aperture photometry on all <strong>of</strong> <strong>the</strong> biased<br />
CSS1204 FITS images. Photometry is <strong>the</strong> use <strong>of</strong> an electronic detector to measure <strong>the</strong> amount <strong>of</strong><br />
flux from an object in a given region <strong>of</strong> <strong>the</strong> spectrum. The atmosphere absorbs and scatters some<br />
light from <strong>the</strong> target star, <strong>the</strong> flux <strong>of</strong> <strong>the</strong> target star will change depending on <strong>the</strong> amount <strong>of</strong><br />
atmosphere along <strong>the</strong> line-<strong>of</strong>-sight from Earth, so to lessen <strong>the</strong> impact <strong>the</strong> atmosphere has on <strong>the</strong>
flux <strong>of</strong> <strong>the</strong> target star, we need to compare it to a few nearby stars. We wanted to ensure that <strong>the</strong><br />
variation in magnitude we were seeing was strictly from <strong>the</strong> target star and not due to <strong>the</strong><br />
variation in seeing conditions from night to night, so we subtracted <strong>the</strong> magnitude <strong>of</strong> <strong>the</strong><br />
brightest comparison star (Comparison star A) with <strong>the</strong> most constant flux from <strong>the</strong> magnitude <strong>of</strong><br />
our target star. To do this, we configured <strong>the</strong> parameters in qphot accordingly, created MAG files<br />
from each star, subtracted <strong>the</strong> Comp 1 star MAG file from <strong>the</strong> variable MAG file, and <strong>the</strong>n<br />
subtracted <strong>the</strong> mean <strong>of</strong> <strong>the</strong> magnitudes as well. It should be known that <strong>the</strong> last two FITS images<br />
from night 2 were not included in <strong>the</strong> corresponding MAG files because during <strong>the</strong> time that<br />
<strong>the</strong>se exposures were being taken, a glitch occurred in <strong>the</strong> telescope causing it to change<br />
coordinates.<br />
Interactive Data Language (IDL) is a programming language used to analyze large quantities <strong>of</strong><br />
data. Using this program language, we used <strong>the</strong> program power.pro created by Peter Garnavich<br />
and created <strong>the</strong> program n1power.pro to run in conjunction. The program power.pro calculated<br />
<strong>the</strong> power spectrum <strong>of</strong> <strong>the</strong> star with a low frequency <strong>of</strong> 0.1 cycles/hour and a high frequency <strong>of</strong><br />
10 cycles/hour out <strong>of</strong> 10,000.0 frequencies. We compiled n1power.pro to plot <strong>the</strong> magnitude<br />
difference <strong>of</strong> CSS1204 vs. <strong>the</strong> phase (cycle). To reduce <strong>the</strong> noise present in <strong>the</strong> plot, we applied a<br />
3-pixel boxcar smooth function to <strong>the</strong> data.<br />
Data<br />
Figure 3 is a light curve which shows <strong>the</strong> relationship between <strong>the</strong> relative magnitude and <strong>the</strong><br />
phase <strong>of</strong> CSS1204. The phase is measured in cycles or time (hours) per period. As <strong>the</strong> stars orbit<br />
<strong>the</strong>ir center <strong>of</strong> mass, <strong>the</strong> observed flux from <strong>the</strong> system will change as some features come into
view and o<strong>the</strong>rs become hidden. Since <strong>the</strong> orbital period is stable, <strong>the</strong>se changes in brightness<br />
should repeat <strong>the</strong>mselves during every orbit.<br />
Figure 3. This image shows <strong>the</strong> Magnitude vs. Phase plot we created for CSS1204.Two phases<br />
(cycles) are shown for clarity.<br />
Results and Analysis<br />
After three nights <strong>of</strong> observing <strong>the</strong> CV CSS1204 at <strong>the</strong> VATT, we determined that <strong>the</strong> orbital<br />
period was 0.8876 hours in duration. Looking at this value as well as <strong>the</strong> superhump period<br />
(0.9370 h) one can see that <strong>the</strong>y are close in comparison. To determine <strong>the</strong> mass ratio <strong>of</strong> <strong>the</strong>
components in CSS1204, we used <strong>the</strong> fractional superhump excess for <strong>the</strong> minimum superhump<br />
period (P SH ) which was used in Kato et al. 2009<br />
2<br />
ε = 0.25q<br />
+ 0.16q<br />
(1),<br />
⎛P<br />
⎞<br />
SH<br />
where q represents <strong>the</strong> mass ratio <strong>of</strong> <strong>the</strong> secondary star to <strong>the</strong> primary star andε<br />
= ⎜ ⎟−1; P SH<br />
⎝ PO<br />
⎠<br />
represents <strong>the</strong> superhump period, and P O represents <strong>the</strong> orbital period. The calculated mass ratio<br />
was 0.25175 or 25.2%. This makes <strong>the</strong> empirical assumption that <strong>the</strong> secondary star is<br />
approximately 1/4 th <strong>the</strong> size <strong>of</strong> <strong>the</strong> primary star.<br />
Conclusion<br />
Using time-resolved photometry from three nights <strong>of</strong> observing at <strong>the</strong> Vatican Advanced<br />
Technology Telescope, we calculated <strong>the</strong> true orbital period and <strong>the</strong> mass ratio <strong>of</strong> <strong>the</strong> cataclysmic<br />
variable, CSS120422:111127+571239. From <strong>the</strong>se values, one can see that <strong>the</strong> components in<br />
this CV are distanced extremely close to each o<strong>the</strong>r-even closer to each o<strong>the</strong>r than <strong>the</strong> distance <strong>of</strong><br />
Mercury and our Sun. The research outlined in this paper will be included in a forthcoming<br />
article about this star.<br />
References<br />
Garnavich, P., et al 2012, The Astronomer’s Telegram<br />
Hellier, C. 2001, <strong>Cataclysmic</strong> <strong>Variable</strong> Stars: How and Why <strong>the</strong>y Vary. Praxis Publishing.<br />
Chichester, UK.<br />
Kato, T., et al 2009, arXiv:0905.1757v2.<br />
Uemura, M., et al 2001, Astronomical Society <strong>of</strong> Japan, 1