MOT scheme performance report - Driving, transport and travel
MOT scheme performance report - Driving, transport and travel
MOT scheme performance report - Driving, transport and travel
Create successful ePaper yourself
Turn your PDF publications into a flip-book with our unique Google optimized e-Paper software.
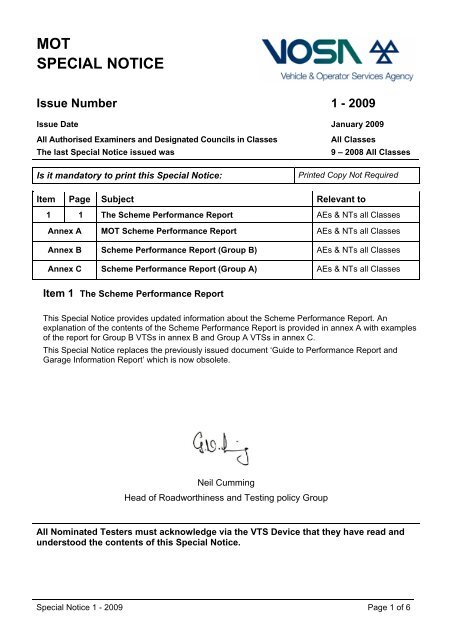
<strong>MOT</strong><br />
SPECIAL NOTICE<br />
Issue Number 1 - 2009<br />
Issue Date January 2009<br />
All Authorised Examiners <strong>and</strong> Designated Councils in Classes<br />
The last Special Notice issued was<br />
Is it m<strong>and</strong>atory to print this Special Notice:<br />
All Classes<br />
9 – 2008 All Classes<br />
Printed Copy Not Required<br />
Item Page Subject Relevant to<br />
1 1 The Scheme Performance Report AEs & NTs all Classes<br />
Annex A <strong>MOT</strong> Scheme Performance Report AEs & NTs all Classes<br />
Annex B Scheme Performance Report (Group B) AEs & NTs all Classes<br />
Annex C Scheme Performance Report (Group A) AEs & NTs all Classes<br />
Item 1 The Scheme Performance Report<br />
This Special Notice provides updated information about the Scheme Performance Report. An<br />
explanation of the contents of the Scheme Performance Report is provided in annex A with examples<br />
of the <strong>report</strong> for Group B VTSs in annex B <strong>and</strong> Group A VTSs in annex C.<br />
This Special Notice replaces the previously issued document ‘Guide to Performance Report <strong>and</strong><br />
Garage Information Report’ which is now obsolete.<br />
Neil Cumming<br />
Head of Roadworthiness <strong>and</strong> Testing policy Group<br />
All Nominated Testers must acknowledge via the VTS Device that they have read <strong>and</strong><br />
understood the contents of this Special Notice.<br />
Special Notice 1 - 2009 Page 1 of 6
Annex A <strong>MOT</strong> Scheme Performance Report<br />
Introduction<br />
The Scheme Performance Report contains information about <strong>MOT</strong> tests conducted at individual<br />
VTSs. The <strong>report</strong> can be used by Authorised Examiners to manage <strong>and</strong> monitor their VTS(s) <strong>and</strong> NTs<br />
by comparing the VTS [NT] <strong>performance</strong> data against national averages.<br />
The information is presented at VTS or NT level depending on the <strong>report</strong> selection criteria.<br />
• For example, an AE may request a <strong>report</strong> showing information for the VTS(s) associated<br />
with the AE, for the NT(s) associated with a specified VTS or for an individual NT working at<br />
a VTS.<br />
• A Site Manager may request a <strong>report</strong> showing information for the NT(s) working at a<br />
specified VTS that the Site Manager is associated with or for an individual NT working at<br />
the VTS.<br />
• An NT may request a <strong>report</strong> showing information on their own <strong>performance</strong> only.<br />
Change to the data collection method<br />
Each month <strong>MOT</strong> Comp collects <strong>and</strong> analyses a sample of data for each VTS. Formerly, the<br />
starting date for the monthly collection of data for each VTS varied across the month but from<br />
January 2009, the sample data for every VTS will be collected from the same date each month.<br />
The benefit of this is that more accurate comparisons may be made between individual averages<br />
<strong>and</strong> <strong>scheme</strong> averages because the sets of data will be matched on the normal weekly <strong>and</strong> monthly<br />
variations.<br />
Please note that whilst this change to the collection method works its way through the system,<br />
<strong>report</strong>s requested in January <strong>and</strong> February 2009 will contain data relating to tests conducted in<br />
December 2008. From March 2009 onwards, a request for the current Scheme Performance<br />
Report will display data which relates to tests performed in the month before last.<br />
For example, a <strong>report</strong> requested in early March 2009 will show data on the last 100 tests collected<br />
in January 2009.<br />
A <strong>report</strong> requested in early April 2009 will show data on the last 100 tests collected in February<br />
2009.<br />
A <strong>report</strong> requested in early May 2009 will show data on the last 100 tests collected in March 2009.<br />
Explanation of the <strong>MOT</strong> Scheme Performance Report<br />
The example shown in Annexes B <strong>and</strong> C illustrates the contents of the <strong>report</strong> at VTS level. Labels<br />
have been added (e.g. ) where a detailed description of the item is given below. The descriptions<br />
assume the VTS level <strong>report</strong> but provide the options for the NT level in brackets [ ].<br />
0<br />
Number of tests analysed (dd/mm/yyyy – dd/mm/yyyy)<br />
<strong>MOT</strong> Comp selects the last 100 tests (Initial Test, Full Retest or Partial Retest) performed at the<br />
VTS or by the specified NT. The dates given are the dates between which the 100 tests were<br />
performed.<br />
V<br />
VTS Key Metrics NEW from May 2009<br />
The Scheme Performance <strong>report</strong>, at VTS level only, includes a section called VTS Key Metrics<br />
which provides information about 4 key measures (metrics) of the VTS <strong>performance</strong>. These<br />
metrics are calculated from the consolidated data of tests performed at the VTS.<br />
Special Notice 1 - 2009 Page 2 of 6
For each key metric, there are two values :<br />
VTS 3 Month Average – this is the rolling average over the last 3 months. By calculating the<br />
average over this period, minor variations in any month are smoothed out.<br />
VTS Baseline mm/yyyy – this is a snapshot of the values of each of the four key metrics taken in<br />
the month specified.<br />
Please note that the first VTS 3 Month Average will be calculated in March 2009 (03/2009) based<br />
on data collected over the previous three months (January, February, March 2009). The first VTS<br />
Baseline will be taken in March 2009 <strong>and</strong> will be the same as the VTS 3 Month Average.<br />
Seasonally Adjusted Number of Tests / Day – a seasonal adjustment is applied to the sample of<br />
initial tests to compensate for the non-uniform distribution of tests through the year.<br />
Average Mins for Initial Group (A <strong>and</strong> / or B) Test – The time taken is from Registration to Result<br />
Entry. The calculation excludes ab<strong>and</strong>oned <strong>and</strong> emergency catch-up tests or tests with duration<br />
greater than 24 hours.<br />
Initial Test Failure Rate – all classes (%) – shows the proportion of initial tests (including<br />
ab<strong>and</strong>oned tests) of all classes that have an outcome of fail.<br />
Average Age of Tested Vehicles (years) – a vehicle’s age is derived from the vehicle’s Date of First<br />
Use <strong>and</strong> the vehicle test date.<br />
For each metric, <strong>MOT</strong> Computerisation will automatically monitor the rolling three month average<br />
against the baseline value <strong>and</strong> will highlight significant change between the average <strong>and</strong> the<br />
baseline by marking ### against the relevant metric.<br />
The baseline value is re-set immediately after a Site Assessment has been conducted at the VTS<br />
or following a review of the VTS by VOSA. This will be indicated by the change in baseline date;<br />
the baseline value may remain the same.<br />
Data in the remainder of the <strong>report</strong> is displayed in two columns: the first column is the VTS [NT]<br />
results; the second column is the average of sampled <strong>MOT</strong> activity from all VTSs [NTs] during the<br />
period selected e.g. 03/2009 is March 2009. Any data with a value that is abnormally higher or<br />
lower than the <strong>scheme</strong> value is highlighted by ‘***’ in the space between the two columns.<br />
1<br />
Average Number of Tests / Day - all test types<br />
This compares the average daily throughput of the VTS [NT] against the average across the<br />
<strong>scheme</strong>. Both calculations are based on an assumed 5 working days per week <strong>and</strong> no allowance is<br />
made for differences in opening hours.<br />
2<br />
Average Mins for Initial Group A <strong>and</strong> / or B Test<br />
(Group A = Classes I <strong>and</strong> II, Group B = Classes III, IV, V <strong>and</strong> VII)<br />
The time taken is from Registration to Result Entry.<br />
3<br />
Initial Test Failure Rate – all classes (%)<br />
This is the proportion of initial tests (including ab<strong>and</strong>oned tests) of all classes that have an<br />
outcome of fail.<br />
Special Notice 1 - 2009 Page 3 of 6
4<br />
Average Age of Tested Vehicles (years)<br />
A vehicle’s age is derived from the vehicle’s Date of First Use <strong>and</strong> the vehicle test date.<br />
5<br />
Average Mins for Full Retest / Partial Retest<br />
The time taken is from Registration to Result Entry<br />
6<br />
Defect Rate for Initial Test (%)<br />
Component groups for all classes tested are displayed with the appropriate label, eg Lighting <strong>and</strong><br />
signalling. If no defects have been recorded for a component in the <strong>report</strong>ing period, a zero value<br />
is displayed in the VTS [NT] Period column.<br />
7<br />
Full Retest / Partial Retest Failure Rate (%)<br />
This is the proportion of full retests <strong>and</strong> partial retests that have an outcome of fail.<br />
8<br />
Replacement Issue Rate (%)<br />
This shows the rate of replacement test certificates issued by the VTS [NT]. This figure does not<br />
include a count of any replacements issued by the local Area Office on behalf of the VTS [NT].<br />
9<br />
QC Index<br />
The QC Index is the average QC scores recorded within the VTS or by the NT where a QC test<br />
scores 8 for Satisfactory, 3 for Minor Discrepancies <strong>and</strong> 1 for Unsatisfactory. The value is only<br />
calculated if Quality Check Tests are found. If none have been done at the VTS, this value is<br />
omitted.<br />
Requesting a Scheme Performance Report<br />
From the Main Menu<br />
Other Functions<br />
Request Non Personnel Reports<br />
Request Performance Report (AE) or<br />
Request Performance Report (Site) or<br />
<br />
Request Performance Report (Self)<br />
Complete the selection criteria (VTS or NT) then select month for which <strong>report</strong> is required :<br />
Select Sample Month eg. 03/2009<br />
Submit request<br />
The system will send you an acknowledgement message with details of the <strong>report</strong> requested. The<br />
<strong>report</strong> will be produced overnight <strong>and</strong> will be available the following day.<br />
To view the <strong>report</strong> :<br />
From the Main Menu<br />
Messages VSI <strong>and</strong> Reports<br />
Select the <strong>report</strong> message<br />
Click on the link to the <strong>report</strong><br />
A <strong>report</strong> will appear on your screen which you may print if you wish but it may also be read directly<br />
from the screen.<br />
Special Notice 1 - 2009 Page 4 of 6
Annex B Scheme Performance Report (Group B)<br />
0<br />
AE Name<br />
John Smith <strong>and</strong> Jane Smith<br />
AE Number<br />
A1234<br />
Number of VTSs 1<br />
VTS Trading as<br />
Smith’s Garage<br />
Site Number<br />
V123456<br />
Number of NTs 3<br />
Number of Tests Analysed 24/02/2009– 19/03/2009<br />
Initial Test 87<br />
Full Retest 3<br />
Partial Retest 10<br />
VTS Key Metrics VTS VTS<br />
3 Month Baseline<br />
Average 03/2009<br />
Seasonally Adjusted Number of Tests / Day 10.53 12.15<br />
Average Mins for Initial Group B Test 32.42 44.23<br />
V Initial Test Failure Rate – all classes (%) 18.18 ### 35.89<br />
Average Age of Tested Vehicles (years) 4.04 3.75<br />
1<br />
3<br />
2<br />
4<br />
5<br />
6<br />
VTS<br />
Scheme<br />
Period<br />
Average<br />
03/2009 03/2009<br />
Average Number of Tests / Day - all test types 2.15 7.99<br />
Average Mins for Initial Group B Test 52.00 47.43<br />
Initial Test Failure Rate – all classes (%) 29.63 28.54<br />
Average Age of Tested Vehicles (years) 5.36 6.21<br />
Average Mins for Full Retest 8.21 31.76<br />
Average Mins for Partial Retest 5.03 5.56<br />
Defect Rate for Initial Test (%)<br />
Lighting <strong>and</strong> signalling 23.87 *** 18.54<br />
Steering 2.78 3.59<br />
Suspension 8.97 11.37<br />
Brakes 12.87 12.09<br />
Tyres 7.21 8.41<br />
Road wheels 0.00 *** 1.03<br />
Seatbelts 3.76 3.15<br />
Body <strong>and</strong> structure 3.76 3.15<br />
Fuel <strong>and</strong> exhaust 8.67 6.82<br />
Drivers view of the road 9.24 8.11<br />
<strong>Driving</strong> controls 1.38 1.95<br />
Reg plates <strong>and</strong> VIN 2.13 2.55<br />
Motor tricycles <strong>and</strong> quadricycles 0.00 *** 0.63<br />
7<br />
Full Retest Failure Rate (%) 0.02 1.23<br />
Partial Retest Failure Rate (%) 0.00 0.09<br />
Spare Card Usage Rate (%) 0.00 0.78<br />
Average VIN VRM Mismatches 0.87 0.77<br />
_______________________________________________________________________________<br />
Analysed 60 Days Data (preceding 19/03/2009)<br />
8<br />
Replacement Issue Rate (%) 1.20 *** 0.64<br />
Test Registration failed because:<br />
Neither VRM nor VIN matched with DVLA 4.00 7.00<br />
9<br />
QC Index 8.00 7.82<br />
Special Notice 1 - 2009 Page 5 of 6
Annex C Scheme Performance Report (Group A)<br />
0<br />
AE Name<br />
John Smith <strong>and</strong> Jane Smith<br />
AE Number<br />
A1234<br />
Number of VTSs 1<br />
VTS Trading as<br />
Smith’s Garage<br />
Site Number<br />
V123456<br />
Number of NTs 3<br />
Number of Tests Analysed 24/02/2009– 19/03/2009<br />
Initial Test 87<br />
Full Retest 3<br />
Partial Retest 10<br />
VTS Key Metrics VTS VTS<br />
3 Month Baseline<br />
Average 03/2009<br />
Seasonally Adjusted Number of Tests / Day 10.53 12.15<br />
Average Mins for Initial Group A Test 16.09 14.35<br />
V Initial Test Failure Rate – all classes (%) 18.18 ### 35.89<br />
Average Age of Tested Vehicles (years) 4.04 3.75<br />
1<br />
3<br />
2<br />
4<br />
5<br />
6<br />
VTS<br />
Scheme<br />
Period<br />
Average<br />
03/2009 03/2009<br />
Average Number of Tests / Day - all test types 2.15 7.99<br />
Average Mins for Initial Group A Test 23.78 22.76<br />
Initial Test Failure Rate – all classes (%) 29.63 28.54<br />
Average Age of Tested Vehicles (years) 5.36 6.21<br />
Average Mins for Full Retest 8.21 31.76<br />
Average Mins for Partial Retest 5.03 5.56<br />
Defect Rate for Initial Test (%)<br />
Motorcycle lighting <strong>and</strong> signalling 10.94 8.86<br />
Motorcycle steering <strong>and</strong> suspension 4.89 5.43<br />
Motorcycle brakes 6.32 5.25<br />
Motorcycle tyres <strong>and</strong> wheels 4.58 3.81<br />
Motorcycle sidecar 0.00 *** 1.87<br />
Motorcycle fuel <strong>and</strong> exhaust 2.15 2.56<br />
Motorcycle body <strong>and</strong> structure 2.42 2.47<br />
Motorcycle drive system 1.65 2.38<br />
Motorcycle driving controls 2.76 2.99<br />
Motorcycle reg plates <strong>and</strong> VIN 3.45 2.55<br />
7<br />
Full Retest Failure Rate (%) 0.02 1.23<br />
Partial Retest Failure Rate (%) 0.00 0.09<br />
Spare Card Usage Rate (%) 0.00 0.78<br />
Average VIN VRM Mismatches 0.87 0.77<br />
_______________________________________________________________________________<br />
Analysed 60 Days Data (preceding 19/03/2009)<br />
8<br />
Replacement Issue Rate (%) 1.20 *** 0.64<br />
Test Registration failed because:<br />
Neither VRM nor VIN matched with DVLA 4.00 7.00<br />
9<br />
QC Index 8.00 7.82<br />
Special Notice 1 - 2009 Page 6 of 6


