Cointegration Analysis in the Presence of Outliers
Cointegration Analysis in the Presence of Outliers
Cointegration Analysis in the Presence of Outliers

Create successful ePaper yourself
Turn your PDF publications into a flip-book with our unique Google optimized e-Paper software.
DISCUSSION PAPERS<br />
Institute <strong>of</strong> Economics<br />
University <strong>of</strong> Copenhagen<br />
03-05<br />
<strong>Co<strong>in</strong>tegration</strong> <strong>Analysis</strong> <strong>in</strong> <strong>the</strong> <strong>Presence</strong><br />
<strong>of</strong> <strong>Outliers</strong><br />
He<strong>in</strong>o Bohn Nielsen<br />
Studiestræde 6, DK-1455 Copenhagen K., Denmark<br />
Tel. +45 35 32 30 82 - Fax +45 35 32 30 00<br />
http://www.econ.ku.dk
I am grateful to Hans Christian Kongsted, Bent Nielsen, participants at <strong>the</strong> Conference on Bridg<strong>in</strong>g Economics<br />
∗<br />
Econometrics <strong>in</strong> Florence 2001, as well as participarts <strong>in</strong> sem<strong>in</strong>ars at <strong>the</strong> Institute <strong>of</strong> Economics, Copenhagen,<br />
and<br />
<strong>Co<strong>in</strong>tegration</strong> <strong>Analysis</strong> <strong>in</strong> <strong>the</strong> <strong>Presence</strong> <strong>of</strong> <strong>Outliers</strong><br />
He<strong>in</strong>o Bohn Nielsen ∗<br />
Institute <strong>of</strong> Economics,<br />
University <strong>of</strong> Copenhagen<br />
he<strong>in</strong>o.bohn.nielsen@econ.ku.dk<br />
March 18, 2003<br />
Abstract<br />
The effects <strong>of</strong> <strong>in</strong>novational outliers and additive outliers <strong>in</strong> co<strong>in</strong>tegrated vector autoregressions<br />
are exam<strong>in</strong>ed and it is analyzed how outliers can be modelled with dummy variables.<br />
Us<strong>in</strong>g a Monte Carlo simulation it is illustrated how misspecified dummies may distort <strong>in</strong>ference<br />
on <strong>the</strong> co<strong>in</strong>tegration rank <strong>in</strong> f<strong>in</strong>ite samples.<br />
That questions <strong>the</strong> common practice<br />
<strong>in</strong> applied co<strong>in</strong>tegration analyses <strong>of</strong> <strong>in</strong>clud<strong>in</strong>g unrestricted dummy variables to account for<br />
large residuals. Instead it is suggested to test <strong>the</strong> adequacy <strong>of</strong> a particular specification <strong>of</strong><br />
dummies prior to determ<strong>in</strong><strong>in</strong>g <strong>the</strong> co<strong>in</strong>tegration rank. The po<strong>in</strong>ts are illustrated on a UK<br />
moneydemanddataset.<br />
Keywords: Co<strong>in</strong>tegrated VAR, Innovational outlier, Additive outlier, Dummy variables,<br />
Monte Carlo.<br />
JEL Classification: C32.<br />
and Nuffield College, Oxford, for numerous comments and suggestions.<br />
1
1 Introduction<br />
Economic time series are frequently affected by special events, for <strong>in</strong>stance policy <strong>in</strong>terventions,<br />
strikes or gross measurement errors. Such events <strong>of</strong>ten show up as large residuals, or outliers, <strong>in</strong><br />
econometric models and that raises two issues for an applied econometrician; first <strong>the</strong> <strong>in</strong>ferential<br />
consequences <strong>of</strong> outliers if <strong>the</strong>y are not detected, and second how <strong>the</strong> irregularities can be modelled<br />
with dummy variables. This paper addresses <strong>the</strong>se issues for <strong>the</strong> case <strong>of</strong> <strong>the</strong> co<strong>in</strong>tegrated<br />
vector autoregression (VAR), which has been widely applied <strong>in</strong> many fields <strong>of</strong> empirical research.<br />
The effects <strong>of</strong> non-modelled outliers <strong>in</strong> autoregressive models depend on <strong>the</strong>ir precise nature<br />
and a dist<strong>in</strong>ction is <strong>of</strong>ten made between <strong>in</strong>novational outliers (IOs) and additive outliers (AOs),<br />
see <strong>in</strong>ter alia Fox (1972), Tsay (1986) or Muirhead (1986). An IO is produced by a shock to <strong>the</strong><br />
<strong>in</strong>novation term <strong>of</strong> a data generat<strong>in</strong>g process (DGP). The shock is <strong>the</strong>n propagated through <strong>the</strong><br />
autoregressive structure <strong>of</strong> <strong>the</strong> model and <strong>the</strong> total effects on <strong>the</strong> levels <strong>of</strong> <strong>the</strong> variables depend<br />
on <strong>the</strong> autoregressive parameters. An AO, on <strong>the</strong> o<strong>the</strong>r hand, is superimposed on <strong>the</strong> levels <strong>of</strong><br />
<strong>the</strong> data, i.e. <strong>in</strong>dependently <strong>of</strong> <strong>the</strong> autoregressive parameters.<br />
In <strong>the</strong> case <strong>of</strong> a fixed number <strong>of</strong> outly<strong>in</strong>g observations asymptotic <strong>in</strong>ference <strong>in</strong> <strong>the</strong> co<strong>in</strong>tegration<br />
model is unchanged, <strong>in</strong> <strong>the</strong> sense that <strong>the</strong> asymptotic distributions are unaffected. The<br />
distortionary effects could be important <strong>in</strong> f<strong>in</strong>ite samples, however, and <strong>in</strong> applied co<strong>in</strong>tegration<br />
analyses it is commonplace to <strong>in</strong>clude dummy variables to whiten residuals. Us<strong>in</strong>g simulations<br />
Doornik, Hendry, and Nielsen (1998) f<strong>in</strong>d that ignored IOs have only m<strong>in</strong>or consequences for<br />
small sample <strong>in</strong>ference on <strong>the</strong> co<strong>in</strong>tegration rank <strong>of</strong> a VAR process, while Franses and Haldrup<br />
(1994), Sh<strong>in</strong>, Sarkar, and Lee (1996) and Vogelsang (1999) f<strong>in</strong>d that AOs may bias <strong>in</strong>ference<br />
towards <strong>the</strong> f<strong>in</strong>d<strong>in</strong>g <strong>of</strong> stationarity or co<strong>in</strong>tegration.<br />
The second issue, how outliers <strong>in</strong> a co<strong>in</strong>tegrated VAR can be modelled with dummy variables,<br />
is less resolved. An IO is straightforward to model with an unrestricted dummy variable, whereas<br />
an AO is more difficult because it imposes non-l<strong>in</strong>ear restrictions on <strong>the</strong> dynamics and requires<br />
a more complicated estimation procedure. In applications <strong>of</strong> <strong>the</strong> co<strong>in</strong>tegrated VAR it is common<br />
practice to identify outly<strong>in</strong>g observations from <strong>the</strong> estimated residuals and to model outliers with<br />
unrestricted (<strong>in</strong>novational) dummies, see Hendry and Juselius (2001), Johansen (1996, chapter<br />
5) and Juselius (2002, chapter 6). But to <strong>the</strong> best <strong>of</strong> our knowledge <strong>the</strong>re is little justification<br />
for this practice; and it is not obvious that outliers <strong>of</strong> a general form, and AOs <strong>in</strong> particular,<br />
can be successfully modelled with unrestricted dummies.<br />
In this paper we use a Monte Carlo simulation to analyze how IOs and AOs can be approximated<br />
with dummy variables <strong>in</strong> small samples. We f<strong>in</strong>d that <strong>the</strong> usual <strong>in</strong>novational model is<br />
misspecified if an outlier is additive, and <strong>in</strong> general it is very difficult to approximate AOs with<br />
unrestricted dummies. As a result <strong>the</strong> usual practice may bias <strong>the</strong> estimated parameters <strong>in</strong> <strong>the</strong><br />
case <strong>of</strong> AOs and may distort <strong>in</strong>ference on <strong>the</strong> co<strong>in</strong>tegration rank. As an alternative we propose<br />
a simple algorithm for estimat<strong>in</strong>g <strong>the</strong> co<strong>in</strong>tegrated VAR with additive dummies, and we suggest<br />
a test<strong>in</strong>g procedure between <strong>the</strong> <strong>in</strong>novational model and <strong>the</strong> additive model <strong>in</strong> <strong>the</strong> detection <strong>of</strong><br />
outly<strong>in</strong>g observations.<br />
Theplanfor<strong>the</strong>rest<strong>of</strong><strong>the</strong>paperisasfollows.First,Section2<strong>in</strong>troduces<strong>the</strong>co<strong>in</strong>tegrated<br />
VAR and two ways to <strong>in</strong>clude dummy variables.<br />
Section 3 briefly presents <strong>the</strong> estimation<br />
2
ease <strong>of</strong> notation we will sometimes drop <strong>the</strong> direct reference to T 0 and denote <strong>the</strong> variables D t<br />
t∑<br />
1 <strong>Outliers</strong> are necessarily def<strong>in</strong>ed relative to a statistical model. The used notation implies that irregular<br />
are outliers relative to <strong>the</strong> basel<strong>in</strong>e model, µ t<br />
=0.<br />
observations<br />
For a p<br />
2 r matrix α we denote by α⊥ <strong>the</strong> p ×(p − r) dimensional orthogonal complement such that α ′ α ⊥ =0<br />
×<br />
algorithms and some hypo<strong>the</strong>ses <strong>of</strong> <strong>in</strong>terest. Section 4 <strong>the</strong>n gives an empirical illustration <strong>of</strong><br />
<strong>the</strong> role <strong>of</strong> outliers and dummy variables based on UK money demand data, and <strong>the</strong> effects<br />
<strong>of</strong> outliers and dummy variables are <strong>the</strong>n analyzed <strong>in</strong> a Monte Carlo simulation <strong>in</strong> Section 5.<br />
F<strong>in</strong>ally, Section 6 concludes.<br />
2 Models for Determ<strong>in</strong>istic Components<br />
We consider <strong>the</strong> p−dimensional co<strong>in</strong>tegrated VAR<br />
∑k−1<br />
∆Y t = αβ ′ Y t−1 +<br />
Γ i ∆Y t−i + µ 0 + αβ ′ 0 t + µ t + ɛ t , t =1, 2,...,T, (1)<br />
i=1<br />
where ɛ t are i.i.d. Gaussian <strong>in</strong>novations, N (0, Ω). The parameters α and β are both <strong>of</strong> dimension<br />
p × r such that <strong>the</strong> rank <strong>of</strong> Π = αβ ′ is r ≤ p, and <strong>the</strong> rema<strong>in</strong><strong>in</strong>g autoregressive parameters,<br />
Γ 1 , ..., Γ k−1 , are each <strong>of</strong> dimension p × p.<br />
We consider a determ<strong>in</strong>istic specification given by an unrestricted constant, µ 0 ,andare-<br />
l<strong>in</strong>ear drift term, µ 1 t = αβ ′ 0t. This model allows for a l<strong>in</strong>ear trend both <strong>in</strong> <strong>the</strong> stastrictetionary<br />
and non-stationary directions <strong>of</strong> <strong>the</strong> data and is <strong>of</strong>ten favored <strong>in</strong> empirical applications,<br />
see Nielsen and Rahbek (2000) for a comparison with o<strong>the</strong>r specifications. F<strong>in</strong>ally, (1) <strong>in</strong>cludes<br />
an additional determ<strong>in</strong>istic function, µ t , which will conta<strong>in</strong> <strong>in</strong>dicator variables. To characterize<br />
impulses and balanced impulses respectively, we def<strong>in</strong>e for a particular observation T 0 <strong>the</strong><br />
<strong>in</strong>dicators<br />
D t (T 0 )=1{t = T 0 } and d t (T 0 )=∆D t (T 0 ) ,<br />
where 1 {·} is <strong>the</strong> <strong>in</strong>dicator function equal to one if <strong>the</strong> expression <strong>in</strong> curly brackets is true. For<br />
and d t . Throughout <strong>the</strong> paper we consider (1) with µ t = 0 as <strong>the</strong> basel<strong>in</strong>e specification and we<br />
denote this model H ∗ (r). In <strong>the</strong> subsections below we present two dist<strong>in</strong>ct ways to augment <strong>the</strong><br />
basel<strong>in</strong>e model with <strong>in</strong>dicator variables, and we characterize <strong>the</strong> result<strong>in</strong>g specifications both as<br />
DGPs and estimation models. When (1) is a DGP we denote by outliers <strong>the</strong> effects on <strong>the</strong> data<br />
<strong>of</strong> <strong>the</strong> <strong>in</strong>dicator variables <strong>in</strong> µ t ≠0 1 . When (1) is an estimation model we use dummy variables<br />
to denote <strong>the</strong> <strong>in</strong>dicators <strong>in</strong>cluded <strong>in</strong> µ t to approximate irregularities <strong>in</strong> <strong>the</strong> data.<br />
If <strong>the</strong> (p − r) × (p − r) matrixα ′ ⊥ Γβ ⊥ is non-s<strong>in</strong>gular 2 and <strong>the</strong> roots <strong>of</strong> <strong>the</strong> characteristic<br />
∑k−1<br />
polynomial<br />
A (z) =(1− z) I − αβ ′ z −<br />
Γ i (1 − z) z i , (2)<br />
i=1<br />
are located ei<strong>the</strong>r outside <strong>the</strong> complex unit circle or at z = 1, <strong>the</strong> solution for Y t is given by <strong>the</strong><br />
Grangers Representation<br />
Y t = C<br />
(ɛ i + µ t )+C 1 (L)(ɛ t + µ t )+κ 0 + κ 1 t + A, (3)<br />
i=1<br />
span (α : α ⊥ )=R p . Fur<strong>the</strong>r we def<strong>in</strong>e Γ = I − ∑ k−1<br />
i=1 Γ i.<br />
and<br />
3
Stationary directions, β ′ Y t<br />
Non-stationary directions, β ′ ⊥ Y t<br />
is a p × n matrix <strong>of</strong> unrestricted coefficients, see Johansen (1996, chapter 5) and Hendry and<br />
φ<br />
(2001). It follows from (3) that <strong>the</strong> total effect <strong>in</strong> Y t is given by C ∑ t<br />
Juselius<br />
<strong>in</strong>terpretation <strong>of</strong> an <strong>in</strong>novational impulse outlier at time T 0 , i.e. <strong>the</strong> <strong>in</strong>dicator variable<br />
The<br />
t = D t (T 0 ) <strong>in</strong>cluded <strong>in</strong> a DGP, is a large shock that follows <strong>the</strong> same dynamic adjustment<br />
D<br />
DGP with k =1lagandaco<strong>in</strong>tegrationrank<strong>of</strong>r =1withabalancedimpulse,<br />
2−dimensional<br />
t = d t , and a non-balanced impulse, D t = D t . The effects <strong>in</strong> <strong>the</strong> stationary and non-stationary<br />
D<br />
d t ,Innovational D t , Additive D t ,Innovational<br />
Figure 1: Examples <strong>of</strong> <strong>the</strong> effects (relative to <strong>the</strong> basel<strong>in</strong>e <strong>of</strong> no outliers) <strong>of</strong> different types <strong>of</strong><br />
outliers <strong>in</strong> <strong>the</strong> stationary and non-stationary directions. Based on a 2-dimensional VAR(1) with<br />
r =1.<br />
where C = β ⊥ (α ′ ⊥ Γβ ⊥) −1 α ′ ⊥ has reduced rank p−r, C 1(L) is an <strong>in</strong>f<strong>in</strong>ite but convergent matrix<br />
polynomial, κ 0 and κ 1 arefunctions<strong>of</strong><strong>the</strong>parametersandA <strong>in</strong>volves <strong>the</strong> <strong>in</strong>itial values, see<br />
Johansen (1996, <strong>the</strong>orem 4.2).<br />
2.1 The Innovational Model, H ∗ I (r)<br />
The usual way to <strong>in</strong>clude dummy variables <strong>in</strong> co<strong>in</strong>tegration analyses is to specify <strong>the</strong> determ<strong>in</strong>istic<br />
function <strong>in</strong> (1) as µ t = φD t ,whereD t is a n−dimensional vector <strong>of</strong> dummy variables and<br />
i=1 φD t+C 1 (L)φD t ,<br />
and unless α ′ ⊥ φ = 0 <strong>the</strong> levels will conta<strong>in</strong> <strong>the</strong> cumulated effect <strong>of</strong> <strong>the</strong> variables <strong>in</strong> D t. S<strong>in</strong>ce<br />
β ′ C = 0, <strong>the</strong> co<strong>in</strong>tegrat<strong>in</strong>g relations, β ′ Y t , annihilate both <strong>the</strong> common stochastic trends and<br />
<strong>the</strong> cumulated effect <strong>of</strong> D t , imply<strong>in</strong>g that <strong>the</strong> stationary and non-stationary directions are not<br />
balanced <strong>in</strong> terms <strong>of</strong> <strong>the</strong> determ<strong>in</strong>istic specification.<br />
as <strong>the</strong> usual <strong>in</strong>novations. In columns one and three <strong>of</strong> Figure 1 we have augmented a simple<br />
directions, relative to <strong>the</strong> basel<strong>in</strong>e <strong>of</strong> no outliers, are reported <strong>in</strong> <strong>the</strong> two rows.<br />
In an estimation model an <strong>in</strong>cluded <strong>in</strong>novational impulse dummy, D t = D t (T 0 ), renders <strong>the</strong><br />
correspond<strong>in</strong>g residual, ɛ T 0, equal to zero and elim<strong>in</strong>ates <strong>the</strong> contribution from that residual to<br />
<strong>the</strong> likelihood function.<br />
2.2 The Additive Model, H ∗ A (r)<br />
An alternative additive formulation can be written as <strong>the</strong> unobserved components model<br />
Y t = X t + θD t (4)<br />
A (L) X t − µ 0 − αβ ′ 0 t = ɛ t, (5)<br />
4
∆Y t = α ( β ′ : β ′ 0 : β ′ 1<br />
Y t−1<br />
D t−1<br />
(RRR), which reduces to solv<strong>in</strong>g <strong>the</strong> eigenvalue problem ∣ ∣ λS11 − S 10 S −1<br />
−1 ∑ T<br />
t=1 R itR ′ jt are sample moment matrices, and R 0t and R 1t are least squares residuals <strong>of</strong><br />
T<br />
∗ that <strong>the</strong> basic model H (r) can be expressed as <strong>the</strong> unobserved component representation, Y<br />
3<br />
= t Note,<br />
+˜θ0 +˜θ1t, where X t follows a co<strong>in</strong>tegrated VAR with no determ<strong>in</strong>istic components. In this case <strong>the</strong> non-l<strong>in</strong>ear<br />
t X<br />
(7) and (8) cancel due to co<strong>in</strong>cidence between ∆t and <strong>the</strong> constant. The balance <strong>of</strong> <strong>the</strong> determ<strong>in</strong>istic<br />
restrictions<br />
<strong>of</strong> this model implies that <strong>the</strong> tests for reduced rank are asymptotic similar with respect to <strong>the</strong><br />
components<br />
where X t are unobserved variables that obey a co<strong>in</strong>tegrated VAR and θ conta<strong>in</strong>s unrestricted<br />
coefficients. In this case <strong>the</strong> effects on <strong>the</strong> levels <strong>of</strong> <strong>the</strong> observed data, Y t , are <strong>in</strong>dependent <strong>of</strong> <strong>the</strong><br />
autoregressive parameters <strong>of</strong> <strong>the</strong> model. The <strong>in</strong>terpretation <strong>of</strong> an impulse AO, i.e. <strong>the</strong> <strong>in</strong>dicator<br />
variable D t = D t <strong>in</strong>cluded <strong>in</strong> <strong>the</strong> DGP, could be an isolated measurement error, for <strong>in</strong>stance a<br />
typ<strong>in</strong>g mistake. It follows from (4) that θD t enters <strong>the</strong> Granger Representation additively and<br />
<strong>in</strong> general, <strong>the</strong> stationary and non-stationary directions are balanced, cf. column two <strong>of</strong> Figure<br />
1.<br />
To characterize <strong>the</strong> properties <strong>of</strong> <strong>the</strong> additive specification as an estimation model it is useful<br />
to solve (4) and (5) for <strong>the</strong> observed variables to obta<strong>in</strong><br />
⎛<br />
⎜ )<br />
⎞<br />
⎟<br />
∑k−1<br />
∑k−1<br />
Γ i ∆Y t−i +<br />
⎝<br />
t<br />
θ i ∆D t−i + µ 0 + ɛ t , (6)<br />
⎠ +<br />
i=1<br />
i=0<br />
subject to <strong>the</strong> k sets <strong>of</strong> restrictions<br />
β 1 = −θ ′ 0 β (7)<br />
θ i = −Γ i θ 0 , i =1, ..., k − 1. (8)<br />
Note, that <strong>the</strong> dummy variables are <strong>in</strong>cluded with <strong>the</strong> full lag structure <strong>of</strong> <strong>the</strong> endogenous<br />
variables, µ t = A (L) θD t .<br />
The restrictions (7) and (8) ensures an <strong>in</strong>stantaneous transition<br />
to <strong>the</strong> effects <strong>of</strong> <strong>the</strong> dummies and <strong>the</strong> effects on Y t are qualitatively identical to <strong>the</strong> dummy<br />
variable itself. If <strong>the</strong>se restrictions are not imposed <strong>the</strong> transition is approximated by <strong>the</strong> k free<br />
parameters (θ 0 , ..., θ k−1 ), which is closely related to <strong>the</strong> model proposed by Johansen, Mosconi,<br />
and Nielsen (2000) for broken levels and broken l<strong>in</strong>ear trends. While <strong>the</strong> approximation is <strong>of</strong>ten<br />
appropriate <strong>in</strong> <strong>the</strong> case <strong>of</strong> a transition to a structural break it is very costly <strong>in</strong> terms <strong>of</strong> degrees<br />
<strong>of</strong> freedom for <strong>the</strong> case <strong>of</strong> isolated outliers and <strong>the</strong>re is a potential efficiency ga<strong>in</strong> by impos<strong>in</strong>g<br />
<strong>the</strong> restrictions 3 .<br />
It is worth not<strong>in</strong>g that an additive impulse dummy, D t (T 0 ), elim<strong>in</strong>ates <strong>the</strong> effects <strong>of</strong> <strong>the</strong><br />
observation, Y T 0, from <strong>the</strong> likelihood function ra<strong>the</strong>r than <strong>the</strong> effects <strong>of</strong> <strong>the</strong> residual, ɛ T 0.This<br />
is equivalent to <strong>the</strong> <strong>in</strong>terpretation <strong>of</strong> a dummy variable <strong>in</strong> a static model, where an entire case is<br />
cancelled; and it is closely related to <strong>the</strong> <strong>in</strong>terpolation <strong>of</strong> miss<strong>in</strong>g values, see Gomez, Maravall,<br />
and Peña (1999).<br />
3 Estimation and Some Hypo<strong>the</strong>ses <strong>of</strong> Interest<br />
Maximum Likelihood estimation <strong>of</strong> <strong>the</strong> basic model, µ t = 0, is based on reduced rank regression<br />
00 S 01<br />
∣<br />
∣ =0,whereSij =<br />
coefficients to <strong>the</strong> l<strong>in</strong>ear trend, see Nielsen and Rahbek (2000).<br />
5
t ,andY ∗<br />
t U<br />
i=r+1<br />
log<br />
)<br />
̂λi . −<br />
(1<br />
For a given dummy variable, D t = D t (T 0 ), both <strong>the</strong> <strong>in</strong>novational model, H ∗ I<br />
H ∗ A<br />
(r), nest <strong>the</strong> basic model, i.e.<br />
model,<br />
∆Y t and Y ∗<br />
t−1 = ( Y ′<br />
t−1 : t)′ respectively on <strong>the</strong> unrestricted variables U t =(∆Y ′<br />
t−1 :<br />
regress<strong>in</strong>g<br />
:∆Y ′ ...<br />
t−k+1 :1)′ , see Johansen (1996, chapter 6). That yields p + 1 ordered eigenvalues, 1 ><br />
1 ><br />
̂λ2 > ... > ̂λp ><br />
̂λp+1 = 0, and <strong>the</strong> estimate <strong>of</strong> <strong>the</strong> co<strong>in</strong>tegrat<strong>in</strong>g relations,<br />
̂β∗ =(̂β′ :<br />
̂β′<br />
0) ′ ,<br />
̂λ<br />
is given by <strong>the</strong> eigenvectors correspond<strong>in</strong>g to <strong>the</strong> r largest eigenvalues.<br />
Different values <strong>of</strong> r def<strong>in</strong>e a sequence <strong>of</strong> nested models, H ∗ (0) ⊂ ... ⊂ H ∗ (r) ⊂ ... ⊂ H ∗ (p),<br />
and a Likelihood Ratio (LR) test for a co<strong>in</strong>tegration rank smaller or equal r aga<strong>in</strong>st a rank<br />
smallerorequalp is given by <strong>the</strong> so-called Trace test statistic<br />
p∑<br />
Q r = −2logQ (H ∗ (r) | H ∗ (p)) = −T<br />
The asymptotic distribution <strong>of</strong> Q r depends on <strong>the</strong> determ<strong>in</strong>istic specification and <strong>in</strong>volves functionals<br />
<strong>of</strong> Brownian motions. In <strong>the</strong> determ<strong>in</strong>ation <strong>of</strong> <strong>the</strong> co<strong>in</strong>tegration rank <strong>the</strong> usual strategy<br />
is to reject a model, H ∗ (r), only if all <strong>the</strong> more restricted models, H ∗ (0) ,...,H ∗ (r − 1), are<br />
also rejected, start<strong>in</strong>g from <strong>the</strong> most restricted model H ∗ (0), see Johansen (1996, chapter 12).<br />
The presence <strong>of</strong> <strong>in</strong>novational dummies does not complicate estimation. The dummies, D t ,<br />
can be <strong>in</strong>cluded <strong>in</strong> U t and concentrated out prior to <strong>the</strong> RRR. The asymptotic distribution<br />
<strong>of</strong> <strong>the</strong> Trace test statistic is not changed by a fixed number <strong>of</strong> outliers or a fixed number <strong>of</strong><br />
<strong>in</strong>novational dummies, see Doornik, Hendry, and Nielsen (1998).<br />
It is also straightforward to modify <strong>the</strong> RRR procedure to estimate <strong>the</strong> additive model (6)<br />
without <strong>the</strong> restrictions (7) and (8). The first differences, ∆D t , ..., ∆D t−k+1 , can be <strong>in</strong>cluded <strong>in</strong><br />
can be augmented with <strong>the</strong> lagged levels, D t−1 . IfD t is an impulse or a balanced<br />
impulse, <strong>the</strong> effect <strong>of</strong> <strong>the</strong> dummy per se is asymptotically negligible but <strong>the</strong> <strong>in</strong>creased dimension<br />
<strong>of</strong><strong>the</strong>eigenvalueproblemwillchange<strong>the</strong>asymptoticdistribution<strong>of</strong><strong>the</strong>Tracetest.<br />
Tobe<br />
specific, each <strong>in</strong>cluded impulse dummy will add an <strong>in</strong>dependent χ 2 (p − r) contribution to <strong>the</strong><br />
distribution <strong>of</strong> Q r , see Johansen, Mosconi, and Nielsen (2000) and Doornik, Hendry, and Nielsen<br />
(1998).<br />
When <strong>the</strong> restrictions (7) and (8) are imposed, no closed form solution for <strong>the</strong> estimator<br />
exists. Maximum Likelihood estimates can be obta<strong>in</strong>ed by a standard numerical (e.g. gradient<br />
based) procedure, but due to <strong>the</strong> number <strong>of</strong> parameters this method can be relatively slow. As<br />
an alternative we suggest a simpler algorithm that switches between two conditional Maximum<br />
Likelihood estimations for which closed form solutions exist. The idea is that conditional on<br />
an estimate ̂θ <strong>of</strong> θ, <strong>the</strong> parameters <strong>in</strong> (5) can be found from a RRR <strong>of</strong> <strong>the</strong> corrected variables,<br />
X t = Y t − ̂θDt . And given <strong>the</strong> parameters <strong>of</strong> <strong>the</strong> co<strong>in</strong>tegrated VAR (5), <strong>the</strong> parameters to <strong>the</strong><br />
determ<strong>in</strong>istic variable, θ, can be estimated by generalized least squares from <strong>the</strong> residuals and<br />
<strong>the</strong> structure <strong>in</strong> (4). That suggests an iterative procedure, see <strong>the</strong> Appendix for details.<br />
3.1 TestsBetweenIOsandAOs<br />
(r), and <strong>the</strong> additive<br />
H ∗ (r) ⊂ H ∗ I (r) and H ∗ (r) ⊂ H ∗ A (r) , (9)<br />
6
When <strong>the</strong> basic model, H ∗ (r), can be rejected aga<strong>in</strong>st both outlier models, H ∗ I<br />
∗<br />
A<br />
(r), a choice has to be made between <strong>the</strong> non-nested candidates. One possible test strategy<br />
H<br />
is to f<strong>in</strong>d a model that nests both alternatives, H ∗ N<br />
<strong>the</strong> nest<strong>in</strong>g alternative. In many situations, however, H ∗ N<br />
H ∗ I (r) andH∗ A<br />
(r), conta<strong>in</strong> <strong>the</strong> same number <strong>of</strong> parameters, <strong>the</strong>n irrespectively <strong>the</strong><br />
models,<br />
For <strong>the</strong> last observation,<br />
4<br />
= D t (T ), <strong>the</strong> two models are equivalent.<br />
Dt<br />
It should be noted that outliers are def<strong>in</strong>ed relative to <strong>the</strong> statistical model and <strong>the</strong> outlier detection should<br />
5<br />
pr<strong>in</strong>ciple be performed conditional on <strong>the</strong> co<strong>in</strong>tegration rank. If <strong>the</strong> correct rank is imposed on <strong>the</strong> model,<br />
<strong>in</strong><br />
<strong>the</strong> memory structure should be very similar to <strong>the</strong> full rank case, and simulations (not reported) <strong>in</strong>dicate<br />
however,<br />
outlier detection based on <strong>the</strong> full rank model is roughly as effective as outlier detection based on <strong>the</strong> true<br />
that<br />
rank model. This facilitates a sequential procedure; First <strong>the</strong> outly<strong>in</strong>g observations can be identified <strong>in</strong><br />
reduced<br />
while H ∗ I (r) andH∗ A (r) arenotmutuallynested4 . Each <strong>of</strong> <strong>the</strong> hypo<strong>the</strong>ses <strong>in</strong> (9) can be tested<br />
us<strong>in</strong>g e.g. a LR test statistic <strong>of</strong> <strong>the</strong> form<br />
τ j = −2 · log Q ( H ∗ (r) ∣ ∣ H<br />
∗<br />
j (r) ) , j = I,A. (10)<br />
Note, however, that if D t conta<strong>in</strong>s dummy variables <strong>in</strong>volv<strong>in</strong>g a fixed number <strong>of</strong> observations,<br />
like d t (T 0 )andD t (T 0 ), <strong>the</strong>n <strong>the</strong> Law <strong>of</strong> Large Numbers and <strong>the</strong> Central Limit Theorem do<br />
not apply to <strong>the</strong> correspond<strong>in</strong>g columns <strong>of</strong> ̂φ and ̂θ, see e.g. Davidson (2001, p.147). As a<br />
consequence, <strong>the</strong> estimates are not consistent, see also Doornik, Hendry, and Nielsen (1998),<br />
and <strong>the</strong> asymptotic distribution <strong>of</strong> τ j (T 0 )isonlyχ 2 under <strong>the</strong> (non-testable) assumption that<br />
<strong>the</strong> particular residuals <strong>in</strong> question are Gaussian under <strong>the</strong> null <strong>of</strong> no outliers.<br />
(r) and<br />
(r) say, and test <strong>the</strong> non-nested models aga<strong>in</strong>st<br />
(r) is not a natural ma<strong>in</strong>ta<strong>in</strong>ed model,<br />
and an alternative is to apply a model selection approach. One strategy is to apply <strong>the</strong> Likelihood<br />
Dom<strong>in</strong>ance Criterion <strong>of</strong> Pollak and Wales (1991), which states that s<strong>in</strong>ce <strong>the</strong> two candidate<br />
significance level and <strong>the</strong> chosen nest<strong>in</strong>g model, H ∗ N (r), a reduction from H∗ N (r)to<strong>the</strong>candidate<br />
model with <strong>the</strong> lower likelihood would not be accepted unless <strong>the</strong> reduction to <strong>the</strong> outlier<br />
model with <strong>the</strong> higher likelihood is also accepted. That implies that if both outlier models are<br />
significant over <strong>the</strong> basic model, H ∗ (r), and we do not allow for both an IO and an AO for<br />
<strong>the</strong> same observation, <strong>the</strong> model with <strong>the</strong> higher likelihood could be selected. A similar l<strong>in</strong>e <strong>of</strong><br />
arguments could be constructed us<strong>in</strong>g conventional <strong>in</strong>formation criteria.<br />
3.2 Outlier Detection<br />
In <strong>the</strong> construction <strong>of</strong> <strong>the</strong> test (10) <strong>the</strong> location <strong>of</strong> a potential outlier is considered known. In<br />
practical applications, however, this is typically not <strong>the</strong> case and an important issue is how to<br />
identify also <strong>the</strong> location <strong>of</strong> outly<strong>in</strong>g observations. Usually <strong>in</strong> applied co<strong>in</strong>tegration analyses,<br />
outliers are identified from apriori<strong>in</strong>formation and <strong>the</strong> size <strong>of</strong> <strong>the</strong> residuals. As an example,<br />
Hendry and Juselius (2001) <strong>in</strong>clude unrestricted dummy variables for observations with absolute<br />
values <strong>of</strong> <strong>the</strong> standardized residuals larger that 3.3.<br />
To determ<strong>in</strong>e <strong>the</strong> location as well as <strong>the</strong> type <strong>of</strong> outliers, an automatic outlier detection<br />
procedure can be used, see also Tsay (1986), Chen and Liu (1993) and Tsay, Peña, and Pankratz<br />
(2000) 5 . This corresponds to perform<strong>in</strong>g <strong>the</strong> test (10) for all observations, τ j (T 0 )forT 0 =<br />
1, 2, ..., T , produc<strong>in</strong>g two series <strong>of</strong> test statistics, τ j (1) ,...,τ j (T ), j = I,A. It is natural to focus<br />
<strong>the</strong> stationary VAR, and <strong>the</strong>n <strong>the</strong> co<strong>in</strong>tegration rank can be determ<strong>in</strong>ed conditional on <strong>the</strong> identified outliers.<br />
7
max<br />
j = max<br />
τ {τ j (T 0 )} . (11)<br />
1≤T0≤T<br />
<strong>the</strong> Gaussianity assumption <strong>the</strong> <strong>in</strong>dividual LR statistics, τ j (T 0 ), are asymptotically<br />
Under 2 (p). An approximation <strong>of</strong> <strong>the</strong> critical values <strong>of</strong> <strong>the</strong> maximum test statistic, τ max<br />
χ<br />
where m t denotes <strong>the</strong> log <strong>of</strong> real money M1, y t denotes <strong>the</strong> log <strong>of</strong> real f<strong>in</strong>al expenditures, ∆p t<br />
<strong>the</strong> change <strong>in</strong> <strong>the</strong> log <strong>of</strong> <strong>the</strong> deflator <strong>of</strong> y t ,andr t denotes <strong>the</strong> difference between <strong>the</strong><br />
denotes<br />
month <strong>in</strong>terest rate and a measure <strong>of</strong> <strong>the</strong> own <strong>in</strong>terest rate <strong>of</strong> M1. 6<br />
three<br />
Doil t = 1{t = 1973 : 3} +1{t =1973:4} +1{t =1979:3}<br />
Dout t = 1{t = 1972 : 4} +1{t =1973:1} +1{t =1979:2}<br />
All calculation have been performed us<strong>in</strong>g a set <strong>of</strong> procedures programmed <strong>in</strong> Ox 3.0, see Doornik (2001).<br />
6<br />
7<br />
accounts for expansionary economic policy measures attributed to <strong>the</strong> Heath-Barber boom and <strong>the</strong><br />
Doutt<br />
on <strong>the</strong> largest test statistic, i.e.<br />
j<br />
,canbe<br />
based on <strong>the</strong> Bonferroni <strong>in</strong>equality. In particular we can use <strong>the</strong> multi comparison significance<br />
level δ max =1− (1 − δ) 1/T <strong>in</strong> each test to ensure an overall Type I error frequency below δ.<br />
If multiple outliers are present, we follow <strong>in</strong>ter alia Tsay (1986) and Tsay, Peña, and<br />
Pankratz (2000) and <strong>in</strong>clude a dummy for <strong>the</strong> most significant outlier, and repeat <strong>the</strong> procedure<br />
conditional on previously identified outliers.<br />
4 Empirical Illustration<br />
To illustrate <strong>the</strong> importance <strong>of</strong> outliers and dummy variables <strong>in</strong> co<strong>in</strong>tegration analyses we consider<br />
<strong>the</strong> quarterly UK money demand data Y t =(m t : y t :∆p t : r t ) ′ , t =1963:1, ..., 1989 : 2,<br />
The data have previously been analyzed <strong>in</strong> <strong>in</strong>ter alia Hendry and Doornik (1994) and<br />
Doornik, Hendry, and Nielsen (1998) us<strong>in</strong>g a VAR with k = 2 lags and we set up a similar<br />
model. Hendry and Mizon (1993) analyze <strong>the</strong> data for a shorter sample and <strong>in</strong>clude two<br />
<strong>in</strong>novational dummy variables, D t =(Doil t : Dout t ) ′ ,where<br />
and give a detailed account for <strong>the</strong>ir <strong>in</strong>terpretation <strong>of</strong> <strong>the</strong> dummies 7 .<br />
Hendry and Doornik<br />
(1994) and Doornik, Hendry, and Nielsen (1998) <strong>in</strong>clude <strong>the</strong> same dummies for <strong>the</strong> extended<br />
sample.<br />
The Trace statistics for determ<strong>in</strong><strong>in</strong>g <strong>the</strong> co<strong>in</strong>tegration rank are reported <strong>in</strong> Table 1. Row (A)<br />
is based on <strong>the</strong> specification with no dummies. The hypo<strong>the</strong>sis <strong>of</strong> r = 0 can be easily rejected<br />
whereas <strong>the</strong> test for r ≤ 1 is a borderl<strong>in</strong>e case with a p−value <strong>of</strong> 8%. Row (B) reports<strong>the</strong><br />
results based on a model <strong>in</strong>clud<strong>in</strong>g <strong>the</strong> orig<strong>in</strong>al <strong>in</strong>novational dummies, Doil t and Dout t . This<br />
specification clearly po<strong>in</strong>t towards r = 1. The dummy variables, Doil t and Dout t ,identify6<br />
outliers <strong>in</strong> <strong>the</strong> data. The restriction that <strong>the</strong>se can be modelled with two composite dummies is<br />
not important for <strong>the</strong> rank determ<strong>in</strong>ation, and row (C) reports results based on a model with<br />
6 unrestricted dummies.<br />
Irrespectively that <strong>the</strong> second co<strong>in</strong>tegrat<strong>in</strong>g relation appears to be <strong>in</strong>significant <strong>in</strong> <strong>the</strong>ir<br />
preferred model, Doornik, Hendry, and Nielsen (1998) reta<strong>in</strong> it and cont<strong>in</strong>ue <strong>the</strong> analysis with<br />
first effect <strong>of</strong> <strong>the</strong> Thatcher government. Doil t accounts for <strong>the</strong> effects <strong>of</strong> <strong>the</strong> two oil crises.<br />
8
11.5<br />
Real money<br />
11.9<br />
F<strong>in</strong>al expenditures<br />
11.4<br />
11.3<br />
11.2<br />
11.1<br />
11.0<br />
10.9<br />
10.8<br />
10.7<br />
11.8<br />
11.7<br />
11.6<br />
11.5<br />
11.4<br />
11.3<br />
11.2<br />
10.6<br />
64 67 70 73 76 79 82 85 88<br />
11.1<br />
64 67 70 73 76 79 82 85 88<br />
0.07<br />
Inflation<br />
0.200<br />
Interest rate<br />
0.06<br />
0.175<br />
0.05<br />
0.04<br />
0.03<br />
0.02<br />
0.01<br />
0.150<br />
0.125<br />
0.100<br />
0.075<br />
0.00<br />
0.050<br />
-0.01<br />
64 67 70 73 76 79 82 85 88<br />
0.025<br />
64 67 70 73 76 79 82 85 88<br />
2.5<br />
First co<strong>in</strong>tegrat<strong>in</strong>g relation<br />
500<br />
Second co<strong>in</strong>tegrat<strong>in</strong>g relation<br />
495<br />
0.0<br />
490<br />
-2.5<br />
485<br />
480<br />
-5.0<br />
475<br />
470<br />
-7.5<br />
64 67 70 73 76 79 82 85 88<br />
465<br />
64 67 70 73 76 79 82 85 88<br />
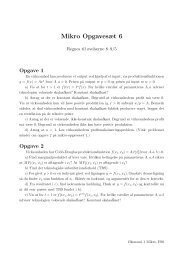
Figure 2: Orig<strong>in</strong>al data (–) and <strong>the</strong> estimated determ<strong>in</strong>istic components <strong>of</strong> <strong>the</strong> orig<strong>in</strong>al model <strong>of</strong><br />
Doornik, Hendry, and Nielsen (1998) (- -). Calculated for r=2.<br />
9
Hypo<strong>the</strong>ses<br />
specification r =0 r ≤ 1 r ≤ 2 r ≤ 3<br />
Dummy<br />
No dummies. 119.38 40.89 12.12 4.48<br />
(A)<br />
[.08] [.80] [.67]<br />
[.00]<br />
Orig<strong>in</strong>al D t =(Doil t : Dout ′ t) . 108.53 29.25 14.77 6.20<br />
(B) dummies,<br />
[.60] [.45]<br />
[.55] [.00]<br />
The 6 unrestricted dummies from (B). 106.19 32.48 14.13 5.07<br />
(C)<br />
[.37] [.65] [.59]<br />
[.00]<br />
Preferred specification. 129.37 47.67 14.05 5.56<br />
(D)<br />
additive and 2 <strong>in</strong>novational dummies, see Table 2. [.00] [.01] [.66] [.53]<br />
3<br />
Table 1: Trace test statistics, Q r , based on different dummy specifications. p−values based on<br />
<strong>the</strong> Γ−approximation <strong>of</strong> Doornik (1998) <strong>in</strong> square brackets.<br />
r = 2. To illustrate <strong>the</strong> role <strong>of</strong> <strong>the</strong> dummies <strong>in</strong> <strong>the</strong> orig<strong>in</strong>al specification <strong>of</strong> Doornik, Hendry,<br />
and Nielsen (1998), Figure 2 depicts <strong>the</strong> actual data toge<strong>the</strong>r with <strong>the</strong> estimated determ<strong>in</strong>istic<br />
components. The latter reflects <strong>the</strong> total effects <strong>of</strong> <strong>the</strong> dummies, Doil t and Dout t ,and<strong>the</strong>l<strong>in</strong>ear<br />
drift term, and is generated from <strong>the</strong> <strong>in</strong>itial values by sett<strong>in</strong>g all <strong>in</strong>novations equal to zero <strong>in</strong> <strong>the</strong><br />
estimated model. Fur<strong>the</strong>rmore <strong>the</strong> co<strong>in</strong>tegrat<strong>in</strong>g l<strong>in</strong>ear comb<strong>in</strong>ations are given toge<strong>the</strong>r with<br />
<strong>the</strong> estimated determ<strong>in</strong>istic components. The unrestricted impulse dummies produce marked<br />
shifts <strong>in</strong> <strong>the</strong> levels <strong>of</strong> <strong>the</strong> data and <strong>the</strong> short run transitions are prolonged.<br />
The dummies<br />
have no long run effects <strong>in</strong> <strong>the</strong> co<strong>in</strong>tegrat<strong>in</strong>g relations, but <strong>the</strong> short run effects account for<br />
a considerable proportion <strong>of</strong> <strong>the</strong> variation around <strong>the</strong> l<strong>in</strong>ear trend.<br />
We believe this k<strong>in</strong>d <strong>of</strong><br />
illustration could be very useful <strong>in</strong> empirical applications, because it highlights <strong>the</strong> consequences<br />
<strong>of</strong> a given determ<strong>in</strong>istic specification.<br />
As an alternative to <strong>the</strong> orig<strong>in</strong>al model we apply <strong>the</strong> automatic outlier detection procedure,<br />
and Table 2 reports <strong>the</strong> outliers detected <strong>in</strong> each iteration. In first iteration <strong>the</strong> observation<br />
1973 : 2 is chosen to be an outlier. Hendry and Mizon (1993) identify 1973 as a year for<br />
potential problems due to <strong>the</strong> Heath government attempts to ”go for growth” and <strong>the</strong> first<br />
oil crisis.<br />
The particular observation is associated with a large positive residual <strong>in</strong> <strong>the</strong> real<br />
money equation and a negative residual <strong>in</strong> <strong>the</strong> <strong>in</strong>flation equation, but <strong>the</strong> observation is not<br />
modelled by <strong>the</strong> orig<strong>in</strong>al dummies. Based on <strong>the</strong> likelihood values it is difficult to dist<strong>in</strong>guish<br />
a model with an <strong>in</strong>novational dummy and an additive dummy, but <strong>the</strong> <strong>in</strong>novational model is<br />
marg<strong>in</strong>ally preferred. In second iteration, which is conditional on <strong>the</strong> dummy for 1973 : 2, an<br />
AO <strong>in</strong> 1974 : 2 is detected, apparently <strong>in</strong> <strong>the</strong> <strong>in</strong>flation equation. Nei<strong>the</strong>r this one is picked up<br />
by <strong>the</strong> orig<strong>in</strong>al dummies. In third iteration an outlier <strong>in</strong> 1973 : 1 is detected. This is an outlier<br />
ma<strong>in</strong>ly <strong>in</strong> total expenditures and is also identified <strong>in</strong> Dout t and <strong>in</strong>terpreted as an expansionist<br />
policy measure. The tests suggest to model <strong>the</strong> outlier as additive but <strong>the</strong> likelihood function<br />
is not very <strong>in</strong>formative on <strong>the</strong> outlier type. Number four is an IO for 1979 : 2 located <strong>in</strong> total<br />
expenditures, and is also <strong>in</strong>cluded <strong>in</strong> Dout t . In iteration five an AO is detected for 1971 : 1.<br />
Hendry and Mizon (1993) mention <strong>the</strong> Competition and Credit Control Regulations <strong>in</strong> 1971 as<br />
a special event but <strong>the</strong> particular observation is not modelled.<br />
There are still 22 observations for which a dummy is significant accord<strong>in</strong>g to <strong>the</strong> <strong>in</strong>dividual<br />
critical value χ 2 0.95 (4), but none <strong>of</strong> <strong>the</strong>se are significant judged at <strong>the</strong> jo<strong>in</strong>t significance level δmax .<br />
10
Detected outliers Test statistics Critical values Standardized residuals<br />
Iteration<br />
Type τ I τ A χ 2 0.95 (4) χ 2 0.9995 (4) m t y t ∆p t r t<br />
Date<br />
1973:2 IO 29.785 28.924 9.488 19.942 4.07 0.39 -3.95 -1.90<br />
1<br />
1974:2 AO 24.911 29.874 9.488 19.942 -0.04 1.22 3.28 -1.30<br />
2<br />
1973:1 AO 26.246 27.209 9.488 19.942 -0.51 3.98 -1.36 0.86<br />
3<br />
1979:2 IO 24.799 8.514 9.488 19.942 0.33 4.40 1.03 -0.10<br />
4<br />
2: Outlier detection. The critical value χ 2 0.95 (4) is based on <strong>the</strong> distribution <strong>of</strong> <strong>in</strong>dividual test<br />
Table<br />
while χ 2 0.9995 (4) is based on <strong>the</strong> Bonferroni <strong>in</strong>equality and allows for <strong>the</strong> fact that <strong>in</strong> each<br />
statistics,<br />
all dummy variables are excluded. This is a 4−dimensional VAR(2) with a co<strong>in</strong>tegration<br />
where<br />
<strong>of</strong> r =2. 8<br />
rank<br />
t =(D t (T 1 ):D t (T 2 ):... : D t (T n )) ′ ,whereT i = i · T · (n +1) −1 ,toproduceIOsorAOs<br />
D<br />
equidistantly <strong>in</strong> <strong>the</strong> time series. Each outlier is imposed randomly on one <strong>of</strong> <strong>the</strong> four<br />
located<br />
8 The simulation has also been carried out for o<strong>the</strong>r DGPs. While <strong>the</strong> absolute levels <strong>of</strong> size and power vary<br />
conclusions on outliers and dummy variables rema<strong>in</strong> unchanged.<br />
<strong>the</strong><br />
An alternative set-up, where outliers are assumed to occur with a fixed probability and <strong>the</strong> (expected) number<br />
9<br />
5 1971:1 AO 18.858 22.167 9.488 19.942 2.83 -2.32 -0.02 -0.18<br />
iteration we focus on <strong>the</strong> maximum test statistic.<br />
For<strong>the</strong>4observations<strong>of</strong><strong>the</strong>orig<strong>in</strong>aldummiesnotselected<strong>in</strong>Table2,1972:4is<strong>in</strong>dividually<br />
and close to jo<strong>in</strong>tly significant with a test statistic for an IO <strong>of</strong> 16.3.<br />
The rema<strong>in</strong><strong>in</strong>g three<br />
are <strong>in</strong>significant judged by <strong>the</strong> <strong>in</strong>dividual critical value with test statistics <strong>of</strong> 6.3 foranIO<strong>in</strong><br />
1973 : 3, a test statistic <strong>of</strong> 7.1 for an AO <strong>in</strong> 1973 : 4 and a test statistic <strong>of</strong> 2.9 foranAO<strong>in</strong><br />
1979 : 3.<br />
Our preferred model, based on <strong>the</strong> formal outlier detection, <strong>in</strong>cludes 3 additive dummies<br />
and 2 <strong>in</strong>novational dummies and <strong>the</strong>reby 20 parameters to dummy variables. The rank determ<strong>in</strong>ation<br />
based on <strong>the</strong> preferred specification is presented <strong>in</strong> row (D) <strong>of</strong> Table 1 and suggests<br />
a co<strong>in</strong>tegration rank <strong>of</strong> r = 2. This is <strong>in</strong> l<strong>in</strong>e with <strong>the</strong> priors <strong>of</strong> Doornik, Hendry, and Nielsen<br />
(1998) based on economic <strong>the</strong>ory.<br />
This empirical example illustrates that <strong>in</strong>ference on <strong>the</strong> co<strong>in</strong>tegration rank is sensitive to <strong>the</strong><br />
specification <strong>of</strong> dummy variables, and care should be taken <strong>in</strong> <strong>the</strong> design <strong>of</strong> <strong>the</strong> empirical model.<br />
Fur<strong>the</strong>rmore, it illustrates how a formal outlier detection, comb<strong>in</strong>ed with aprioriknowledge on<br />
<strong>the</strong> tim<strong>in</strong>g <strong>of</strong> special events <strong>in</strong> <strong>the</strong> data, can be a useful tool.<br />
5 Monte Carlo Simulation<br />
In this section we set up a Monte Carlo simulation to analyze how outliers can be modelled<br />
with dummy variables <strong>in</strong> small samples. In particular, it is <strong>of</strong> <strong>in</strong>terest to assess if <strong>the</strong> common<br />
strategy <strong>of</strong> <strong>in</strong>clud<strong>in</strong>g unrestricted dummies is robust also to <strong>the</strong> presence <strong>of</strong> additive outliers.<br />
As<strong>the</strong>basel<strong>in</strong>eDGP<strong>in</strong><strong>the</strong>simulationsweuse<strong>the</strong>preferredmodelestimated<strong>in</strong>Section4,<br />
We augment <strong>the</strong> basic DGP with n =1, 2, 4, 6 impulse <strong>in</strong>dicator variables,<br />
variables, and has a magnitude <strong>of</strong> 5 times <strong>the</strong> residual standard deviation <strong>of</strong> <strong>the</strong> particular<br />
equation.<br />
S<strong>in</strong>ce <strong>the</strong> set-up <strong>in</strong>volves a fixed number <strong>of</strong> outliers, <strong>the</strong> asymptotic effects are negligible,<br />
and we focus on <strong>the</strong> small sample properties <strong>of</strong> different estimation strategies 9 .From<strong>the</strong>DGP<br />
11
µ it = θ i0 D it<br />
µ it = αθ i0 D it−1 + θ i1 d it + θ i2 d it−1<br />
µ it = θ i0 D it + θ i1 D it−1 + θ i2 D it−2<br />
Villani (2001) 10 . For <strong>the</strong> case r =2thismeasure,Λ(̂β, β), is bounded between Λ = 0 if<br />
and<br />
⊂ sp (β) andΛ= √ 2if̂β ⊂ sp (β⊥ ). The distance can be <strong>in</strong>terpreted as a simple measure <strong>of</strong><br />
̂β<br />
outliers <strong>in</strong>creases with <strong>the</strong> sample length, is used <strong>in</strong> Franses and Haldrup (1994). In this case <strong>the</strong> asymptotic<br />
<strong>of</strong><br />
will typically <strong>in</strong>volve nuisance parameters, see also Sh<strong>in</strong>, Sarkar, and Lee (1996) for a comparison<br />
distributions<br />
<strong>the</strong> two approaches.<br />
<strong>of</strong><br />
To compare <strong>the</strong> subspaces span (A) andspan (B), we first f<strong>in</strong>d an orthonormal basis for each subspace, a and<br />
10<br />
note that α ⊥<br />
evaluated by <strong>the</strong> matrix norm, i.e. Λ = T race (γ ′ 2 γ 2) 1/2 . The measure can also be written as a function <strong>of</strong> <strong>the</strong><br />
γ2<br />
between all pairs <strong>of</strong> columns <strong>in</strong> a and b, see Larsson and Villani (2001).<br />
angles<br />
we generate samples for t = −101,...,0, 1, ..., T and discard 100 observations to m<strong>in</strong>imize <strong>the</strong><br />
importance <strong>of</strong> <strong>the</strong> <strong>in</strong>itial values (taken from <strong>the</strong> actual data). For each case <strong>the</strong> same pseudorandom<br />
Gaussian <strong>in</strong>novations are used. The Monte Carlo results are based on 10000 replications<br />
and <strong>the</strong> asymptotic standard deviation <strong>of</strong> an estimator <strong>of</strong> <strong>the</strong> true rejection probability, γ, is<br />
given by σ γ = [ γ · (1 − γ) · 10000 −1] 1/2 and for example σ .05 ≃ .002.<br />
5.1 Modell<strong>in</strong>g Known Outly<strong>in</strong>g Observations<br />
To illustrate <strong>the</strong> ability <strong>of</strong> different specifications to approximate outly<strong>in</strong>g observations we first<br />
assume that <strong>the</strong> locations <strong>of</strong> outliers are known. We estimate <strong>the</strong> model (1) with µ t = µ 1t +<br />
µ 2t + ... + µ nt ,whereµ it is given by <strong>the</strong> 6 follow<strong>in</strong>g configurations <strong>of</strong> dummy variables:<br />
0 : µ it =0<br />
M<br />
1 : µ it = θ i0 d it<br />
M<br />
M 2 :<br />
M 3 :<br />
M 4 :<br />
M 5 : µ it = A (L) θ i0 D it .<br />
Based on each configuration we calculate <strong>the</strong> Trace tests for rank determ<strong>in</strong>ation and compare<br />
with <strong>the</strong> appropriate critical values calculated from a Γ−approximation based <strong>of</strong> <strong>the</strong> mean and<br />
variance <strong>of</strong> <strong>the</strong> asymptotic distribution estimated <strong>in</strong> a response surface regression by Doornik<br />
(1998). Fur<strong>the</strong>rmore, we analyze <strong>the</strong> precision <strong>of</strong> <strong>the</strong> estimated long-run parameters by impos<strong>in</strong>g<br />
<strong>the</strong> correct rank, r = 2, and compare <strong>the</strong> estimated co<strong>in</strong>tegration space, ̂β, with<strong>the</strong>space<br />
spanned by <strong>the</strong> columns <strong>of</strong> β <strong>in</strong> <strong>the</strong> DGP. The comparison is based on <strong>the</strong> metric <strong>of</strong> Larsson<br />
<strong>the</strong> efficiency <strong>of</strong> different estimators.<br />
The simulation results for sample lengths T =75andT = 200 observations are reported <strong>in</strong><br />
Table 3 and Table 4 respectively. Panel (A) and(B) <strong>of</strong> <strong>the</strong> tables report rejection frequencies<br />
<strong>of</strong> <strong>the</strong> Trace tests. The test Q 0 = −2logQ (r =0| r ≤ 4) <strong>of</strong> no co<strong>in</strong>tegration is (almost) always<br />
rejected and is not reported. Panel (A) reports <strong>the</strong> rejection frequencies <strong>of</strong> <strong>the</strong> test statistic<br />
Q 1 = −2logQ (r ≤ 1 | r ≤ 4) based on a nom<strong>in</strong>al size <strong>of</strong> 5%. This illustrates <strong>the</strong> power <strong>of</strong><br />
<strong>the</strong> test <strong>of</strong> a too restricted model, r ≤ 1, aga<strong>in</strong>st <strong>the</strong> unrestricted VAR when r =2<strong>in</strong><strong>the</strong><br />
DGP. Panel (B) reports <strong>the</strong> rejection frequencies <strong>of</strong> Q 2 = −2logQ (r ≤ 2 | r ≤ 4), which is <strong>the</strong><br />
empirical size <strong>of</strong> <strong>the</strong> tests <strong>of</strong> <strong>the</strong> (true) co<strong>in</strong>tegration rank r = 2. F<strong>in</strong>ally, panel (C) reports <strong>the</strong><br />
averagedistanceΛ(̂β,β) given <strong>the</strong> correct rank, r =2.<br />
b say, and decompose b = aγ1 + a ⊥ γ2, where γ1 =(a ′ a) −1 a ′ b = a ′ b and γ1 =(a ′ ⊥a ⊥ ) −1 a ′ ⊥b ⊥ = a ′ ⊥b. We now<br />
is <strong>the</strong> as far as we can get from a and <strong>the</strong> distance is simply measured by <strong>the</strong> size <strong>of</strong> <strong>the</strong> coefficient<br />
12
first column <strong>of</strong> <strong>the</strong> tables report results for <strong>the</strong> basic model,<br />
The<br />
0 : µ it = 0, which ignores potential outliers. First row <strong>in</strong> each panel illustrates <strong>the</strong> benchmark<br />
M<br />
1 is clearly under-sized, and <strong>the</strong><br />
In<strong>the</strong>case<strong>of</strong>impulseIOs<strong>in</strong><strong>the</strong>data<strong>the</strong>testbasedonM<br />
is rapidly decreas<strong>in</strong>g. In <strong>the</strong> case <strong>of</strong> AOs <strong>the</strong> size is only marg<strong>in</strong>ally distorted but power<br />
power<br />
2 : µ it = θ i0D it . This is probably <strong>the</strong> most common modell<strong>in</strong>g strategy to control for outliers.<br />
M<br />
2 is identical to <strong>the</strong> DGP and we obta<strong>in</strong> good<br />
In<strong>the</strong>case<strong>of</strong>IOs<strong>the</strong>estimationmodelM<br />
In <strong>the</strong> text we will concentrate on <strong>the</strong> results for <strong>the</strong> small sample, T = 75, and make<br />
reference to <strong>the</strong> medium sample, T = 200, only <strong>in</strong> case <strong>of</strong> differences <strong>in</strong> results.<br />
Estimation model M 0 .<br />
case where <strong>the</strong> DGP conta<strong>in</strong>s no outliers.<br />
In <strong>the</strong> small sample, T = 75, <strong>the</strong> Trace test is<br />
somewhat oversized with a rejection frequency <strong>of</strong> r ≤ 2 aga<strong>in</strong>st r ≤ 4 <strong>of</strong> approximately 11%.<br />
Thepower<strong>of</strong><strong>the</strong>testforr ≤ 1 aga<strong>in</strong>st r ≤ 4 is reasonably high at around 80%. For T = 200<br />
<strong>the</strong> actual size is down to 7% and <strong>the</strong> power is 100%. The size and power properties are specific<br />
to <strong>the</strong> chosen DGP and constitute <strong>the</strong> benchmark for alternative specifications.<br />
The follow<strong>in</strong>g rows illustrate <strong>the</strong> effects <strong>of</strong> non-modelled outliers <strong>in</strong> <strong>the</strong> data. It appears<br />
that IOs moves <strong>the</strong> actual distributions to <strong>the</strong> left, marg<strong>in</strong>ally decreas<strong>in</strong>g <strong>the</strong> size and power.<br />
Panel (C) illustrates that <strong>the</strong> average precision <strong>of</strong> <strong>the</strong> estimated parameters <strong>in</strong>creases with <strong>the</strong><br />
number <strong>of</strong> IOs. This reflects that IOs provide events <strong>of</strong> large variations, and because IOs follow<br />
<strong>the</strong> same autoregressive adjustment as <strong>the</strong> small chocks, IOs can be helpful <strong>in</strong> reveal<strong>in</strong>g <strong>the</strong><br />
autoregressive structure. The overall conclusion is that IOs do not seriously distort <strong>in</strong>ference <strong>in</strong><br />
<strong>the</strong> co<strong>in</strong>tegration model, see Doornik, Hendry, and Nielsen (1998) for a similar result.<br />
The effects <strong>of</strong> ignored AOs are more severe. The size distortion <strong>in</strong>creases markedly with <strong>the</strong><br />
number <strong>of</strong> outliers, confirm<strong>in</strong>g <strong>the</strong> f<strong>in</strong>d<strong>in</strong>gs <strong>in</strong> Franses and Haldrup (1994). Fur<strong>the</strong>rmore, <strong>the</strong><br />
average precision <strong>in</strong> panel (C) illustrates that AOs are pure noise <strong>in</strong> <strong>the</strong> autoregressive model<br />
and <strong>the</strong>y can potentially distort statistical <strong>in</strong>ference.<br />
An important question is now if <strong>the</strong> outliers can be successfully modelled with dummy<br />
variables. And below we consider a number <strong>of</strong> different specifications.<br />
Estimation model M 1 .<br />
In <strong>the</strong> second column outliers are modelled by balanced impulse<br />
dummies, M 1 : µ it = θ i0d it . These dummies are too ‘small’ <strong>in</strong> <strong>the</strong> sense that <strong>the</strong>y can at<br />
most create impulses <strong>in</strong> <strong>the</strong> non-stationary directions, i.e. column 1 <strong>of</strong> Figure 1, whereas <strong>the</strong><br />
DGP replicates column 3 and 2 respectively. The specification is not unusual, however, and<br />
Juselius (2002, chapter 6) argues that AOs (e.g. typ<strong>in</strong>g mistakes) can be described by this k<strong>in</strong>d<br />
<strong>of</strong> balanced <strong>in</strong>novational dummies. See also Hendry and Juselius (2001).<br />
is much lower than for <strong>the</strong> basel<strong>in</strong>e specification. In both cases <strong>the</strong> comb<strong>in</strong>ation <strong>of</strong> power and<br />
size implies that <strong>the</strong> proportion <strong>of</strong> cases where <strong>the</strong> correct rank, r = 2, is selected us<strong>in</strong>g <strong>the</strong><br />
normal test sequence is markedly lower for M 1 than for <strong>the</strong> basic model M 0 .<br />
The same picture appears for <strong>the</strong> average precision <strong>of</strong> <strong>the</strong> estimates <strong>of</strong> β. BothforIOsand<br />
AOs <strong>the</strong> results are clearly <strong>in</strong>ferior to ignor<strong>in</strong>g <strong>the</strong> outliers.<br />
Estimation model M 2 .<br />
In <strong>the</strong> third column we consider unrestricted impulse dummies,<br />
results. The size distortion is decreased compared to <strong>the</strong> basic model M 0 ,and<strong>the</strong>test<strong>of</strong><strong>the</strong><br />
13
<strong>Outliers</strong> Known location Outlier detection<br />
<strong>in</strong> DGP M 0 M 1 M 2 M 3 M 4 M 4b M 5 M 6 M 7 M 8<br />
(A) Power, Q 1 = −2logQ (r ≤ 1 | r ≤ 4)<br />
0 80.5 ... ... ... ... ... ... 80.9 80.8 81.3<br />
1 IO 79.8 71.0 82.2 87.7 79.9 82.2 80.1 82.8 82.0 83.1<br />
2 IO 78.7 59.4 84.2 92.7 80.7 84.9 79.6 85.0 84.0 85.3<br />
4 IO 77.5 40.2 88.6 97.7 82.0 88.4 79.1 87.7 86.2 89.6<br />
6 IO 75.7 26.5 92.4 99.4 84.2 92.2 78.0 90.6 87.6 92.8<br />
1 AO 80.3 76.0 88.2 79.5 81.5 82.8 80.3 87.6 82.2 81.7<br />
2 AO 80.8 71.9 82.7 79.6 82.0 84.5 79.8 91.9 83.7 82.3<br />
4 AO 83.3 63.5 97.3 82.5 83.5 87.1 79.5 95.8 87.1 84.5<br />
6 AO 85.8 56.8 99.0 87.5 85.3 89.7 79.0 97.4 90.2 86.7<br />
(B) Size, Q 2 = −2logQ (r ≤ 2 | r ≤ 4)<br />
0 10.9 ... ... ... ... ... ... 11.3 10.8 11.6<br />
1 IO 9.6 7.0 9.6 25.0 10.7 11.0 9.7 10.6 10.8 10.8<br />
2 IO 8.8 4.2 9.1 38.7 10.9 11.5 8.9 10.3 10.7 10.6<br />
4 IO 7.9 1.8 7.5 62.3 11.7 12.1 7.9 9.3 10.5 9.6<br />
6 IO 7.2 .7 6.9 79.5 12.5 13.9 7.3 9.4 10.0 9.6<br />
1 AO 12.0 10.3 19.7 12.1 12.5 13.3 10.7 19.6 13.1 12.1<br />
2 AO 13.3 9.7 28.9 13.8 14.8 16.7 10.7 28.1 15.7 13.4<br />
4 AO 17.1 8.5 46.5 19.0 17.9 21.5 10.4 41.4 20.0 16.3<br />
6 AO 20.3 8.5 60.2 28.5 21.4 25.9 10.8 51.0 24.4 19.9<br />
(C) Average distance, given r =2<br />
0 .2001 ... ... ... ... ... ... .2007 .2007 .2018<br />
1 IO .2014 .2102 .1876 .2091 .1961 .1925 .1964 .1909 .1948 .1912<br />
2 IO .1997 .2148 .1736 .2146 .1892 .1829 .1926 .1798 .1881 .1792<br />
4 IO .1900 .2155 .1571 .2246 .1812 .1717 .1820 .1684 .1790 .1639<br />
6 IO .1825 .2139 .1448 .2379 .1778 .1650 .1755 .1600 .1734 .1537<br />
1 AO .2118 .2139 .2258 .2099 .2080 .2103 .2012 .2255 .2109 .2047<br />
2 AO .2216 .2274 .2466 .2181 .2162 .2204 .2020 .2451 .2225 .2079<br />
4 AO .2346 .2501 .2753 .2365 .2322 .2380 .2046 .2688 .2391 .2165<br />
6 AO .2475 .2729 .2971 .2595 .2521 .2578 .2083 .2876 .2571 .2285<br />
Table 3: Simulation results, T=75. Results for <strong>the</strong> size and power are <strong>the</strong> rejection frequencies at a<br />
nom<strong>in</strong>al 5% level <strong>of</strong> <strong>the</strong> Trace test for <strong>the</strong> co<strong>in</strong>tegration rank. Note that <strong>the</strong> tests are not performed<br />
sequentially. Bold <strong>in</strong>dicates that <strong>the</strong> estimation model and <strong>the</strong> DGP co<strong>in</strong>cide. Results are based on<br />
10000 replications.<br />
14
<strong>Outliers</strong> Known location Outlier detection<br />
<strong>in</strong> DGP M 0 M 1 M 2 M 3 M 4 M 4b M 5 M 6 M 7 M 8<br />
(A) Power, Q 1 = −2logQ (r ≤ 1 | r ≤ 4)<br />
0 100.0 ... ... ... ... ... ... 100.0 100.0 100.0<br />
1 IO 100.0 100.0 100.0 100.0 100.0 100.0 100.0 100.0 100.0 100.0<br />
2 IO 100.0 100.0 100.0 100.0 100.0 100.0 100.0 100.0 100.0 100.0<br />
4 IO 100.0 100.0 100.0 100.0 100.0 100.0 100.0 100.0 100.0 100.0<br />
6 IO 100.0 100.0 100.0 100.0 100.0 100.0 100.0 100.0 100.0 100.0<br />
1 AO 100.0 100.0 100.0 100.0 100.0 100.0 100.0 100.0 100.0 100.0<br />
2 AO 100.0 100.0 100.0 100.0 100.0 100.0 100.0 100.0 100.0 100.0<br />
4 AO 100.0 100.0 100.0 100.0 100.0 100.0 100.0 100.0 100.0 100.0<br />
6 AO 100.0 100.0 100.0 100.0 100.0 100.0 100.0 100.0 100.0 100.0<br />
(B) Size, Q 2 = −2logQ (r ≤ 2 | r ≤ 4)<br />
0 7.0 ... ... ... ... ... ... 7.0 7.3 7.3<br />
1 IO 7.1 6.2 6.9 23.9 7.3 7.2 6.9 7.2 7.2 7.2<br />
2 IO 6.5 5.0 6.6 40.2 7.2 7.3 6.3 7.0 6.8 6.9<br />
4 IO 6.4 3.6 5.8 65.9 7.1 6.9 5.9 6.9 6.3 6.2<br />
6 IO 6.5 2.8 6.0 81.0 7.5 7.7 6.1 7.3 6.9 6.7<br />
1 AO 7.6 7.3 10.6 7.6 7.6 7.7 7.0 7.7 10.4 7.3<br />
2 AO 8.3 7.6 14.4 7.8 8.1 8.7 7.0 8.3 13.3 7.4<br />
4 AO 9.8 8.0 22.8 9.2 9.1 10.1 6.9 10.0 20.5 7.5<br />
6 AO 11.2 8.4 31.7 11.0 10.4 12.1 6.9 11.8 27.6 7.7<br />
(C) Average distance, given r =2<br />
0 .0571 ... ... ... ... ... ... .0571 .0571 .0572<br />
1 IO .0573 .0575 .0559 .0566 .0563 .0561 .0567 .0563 .0562 .0561<br />
2 IO .0574 .0578 .0550 .0565 .0559 .0554 .0566 .0558 .0554 .0553<br />
4 IO .0565 .0573 .0527 .0554 .0542 .0534 .0552 .0542 .0536 .0532<br />
6 IO .0551 .0563 .0510 .0555 .0533 .0520 .0536 .0531 .0522 .0517<br />
1 AO .0580 .0580 .0586 .0576 .0576 .0577 .0572 .0577 .0586 .0573<br />
2 AO .0586 .0586 .0599 .0582 .0581 .0583 .0572 .0585 .0599 .0574<br />
4 AO .0598 .0600 .0623 .0591 .0591 .0596 .0573 .0597 .0621 .0576<br />
6 AO .0607 .0611 .0650 .0601 .0600 .0608 .0574 .0613 .0646 .0578<br />
Table 4: Simulation results, T=200. See notes for Table 3.<br />
15
<strong>in</strong>cluded with <strong>the</strong> full lag structure <strong>of</strong> <strong>the</strong> autoregressive model and unrestricted coefficients;<br />
are<br />
4 : µ it = θ i0D it + θ i1D it−1 + θ i2D it−2. A similar model is applied <strong>in</strong> Vogelsang (1999) for<br />
M<br />
11 For this model we base <strong>the</strong> critical values on <strong>the</strong> mean and variance for <strong>the</strong> basic model augmented with <strong>the</strong><br />
<strong>of</strong> n <strong>in</strong>dependent χ 2 (p − r) distributions, cf. Section 3.<br />
12 moments<br />
<strong>in</strong>terest<strong>in</strong>g feature <strong>of</strong> this model is that <strong>the</strong> same test statistics are obta<strong>in</strong>ed <strong>in</strong>dependent <strong>of</strong> <strong>the</strong> magnitude<br />
An<br />
estimation model.<br />
13 <strong>the</strong><br />
we can note, that <strong>the</strong> same test statistics would have been obta<strong>in</strong>ed irrespectively <strong>the</strong> magnitude <strong>of</strong><br />
Aga<strong>in</strong><br />
too restricted model, r ≤ 1, is very powerful. This picture is confirmed by <strong>the</strong> results on <strong>the</strong><br />
averagedistancebetweenβ and ̂β.<br />
In <strong>the</strong> case <strong>of</strong> AOs <strong>the</strong> estimation model with an unrestricted dummy is not well suited. To<br />
remove <strong>the</strong> isolated outly<strong>in</strong>g observations <strong>the</strong> estimation model <strong>in</strong>troduces a shift <strong>in</strong> <strong>the</strong> levels<br />
<strong>of</strong> <strong>the</strong> non-stationary directions. The tests are highly over-sized, with a rejection frequency <strong>of</strong><br />
60% for 6 AOs, and <strong>the</strong> average precision is extremely low. With T =200<strong>the</strong>sizeisonlydown<br />
to around 30%. This clearly illustrates that it is not recommendable <strong>in</strong> practice just to <strong>in</strong>sert<br />
<strong>in</strong>novational impulse dummies for observations with large residuals.<br />
Estimation model M 3 .<br />
One possibility for modell<strong>in</strong>g <strong>the</strong> additive outliers is <strong>the</strong> specification<br />
(6), where <strong>the</strong> non-l<strong>in</strong>ear restrictions (7) and (8) are not imposed; M 3 : µ it = αθ i0D it−1+θ i1d it +<br />
θ i2d it−1. 11 This model can still be estimated by standard RRR.<br />
When<strong>the</strong>DGPconta<strong>in</strong>sIOsresultsarepoorandforan<strong>in</strong>creas<strong>in</strong>gnumber<strong>of</strong>outliers,<strong>the</strong><br />
size approaches 100%. This reflects an additional contributions to <strong>the</strong> Trace test statistic from<br />
impos<strong>in</strong>g <strong>the</strong> reduced rank restrictions also on <strong>the</strong> dummy terms when <strong>the</strong>y are unrestricted<br />
<strong>in</strong> <strong>the</strong> DGP, see also Doornik, Hendry, and Nielsen (1998). Note that <strong>the</strong> distortion does not<br />
disappear for T →∞, see also <strong>the</strong> results for T =200.<br />
When AOs are present, M 3 is <strong>the</strong> correct model apart from <strong>the</strong> restrictions (7) and (8) not<br />
imposed, but <strong>the</strong> model is costly <strong>in</strong> terms <strong>of</strong> degrees <strong>of</strong> freedom. In longer samples or with a<br />
limited number <strong>of</strong> outliers <strong>the</strong> size and power are reasonable and <strong>the</strong>re is a small ga<strong>in</strong> compared<br />
to <strong>the</strong> basic model M 0 . But <strong>in</strong> small samples and with several outliers <strong>the</strong> loss <strong>in</strong> degrees <strong>of</strong><br />
freedom is prohibitive 12 .<br />
Estimation model M 4 .<br />
In column five we <strong>in</strong>troduce a general model where <strong>the</strong> dummies<br />
univariate Dickey-Fuller unit root tests. This model is <strong>in</strong>terest<strong>in</strong>g because it is (<strong>in</strong> pr<strong>in</strong>ciple)<br />
robust to both IOs and AOs and can be estimated us<strong>in</strong>g RRR. The model is, however, potentially<br />
costly <strong>in</strong> terms <strong>of</strong> degrees <strong>of</strong> freedom and this <strong>in</strong>efficiency is important <strong>in</strong> small samples. In <strong>the</strong><br />
case <strong>of</strong> IOs <strong>the</strong> properties are marg<strong>in</strong>ally better than for <strong>the</strong> basic specification, M 0 ,butisclearly<br />
<strong>in</strong>ferior to <strong>the</strong> correct <strong>in</strong>novational specification, M 2 . For<strong>the</strong>case<strong>of</strong>AOs<strong>the</strong>specificationis<br />
comparable to ignor<strong>in</strong>g <strong>the</strong> outliers <strong>in</strong> small samples and implies a small ga<strong>in</strong> <strong>in</strong> larger samples 13 .<br />
4 is to estimate <strong>the</strong> general model and <strong>the</strong>n to delete <strong>in</strong>significant<br />
Asimpleref<strong>in</strong>ement<strong>of</strong>M<br />
to save degrees <strong>of</strong> freedom. This is applied <strong>in</strong> model M 4b <strong>in</strong> columns six. More specif-<br />
dummies<br />
ically we delete a dummy if all four t−test statistics (for <strong>the</strong> hypo<strong>the</strong>ses <strong>of</strong> dummy coefficients<br />
<strong>of</strong> <strong>the</strong> AOs. The important th<strong>in</strong>g is not <strong>the</strong> magnitude <strong>of</strong> <strong>the</strong> actual outliers, but <strong>the</strong> presence <strong>of</strong> <strong>the</strong> dummies <strong>in</strong><br />
<strong>the</strong> AOs, because all contributions to <strong>the</strong> likelihood function <strong>in</strong>volv<strong>in</strong>g <strong>the</strong> outly<strong>in</strong>g observations are set to zero<br />
by <strong>the</strong> <strong>in</strong>cluded unrestricted dummy variables.<br />
16
5 : µ it = A (L) θ i0D it , estimated with <strong>the</strong> switch<strong>in</strong>g algorithm.<br />
M<br />
<strong>the</strong> presence <strong>of</strong> IOs results are comparable to ignor<strong>in</strong>g <strong>the</strong> outlier. This illustrates that<br />
In<br />
14 The critical value corresponds to a multi-comparison significance level δ max for a nom<strong>in</strong>al 5% and T =75<br />
<strong>in</strong> a standard normal distribution.<br />
15 observations<br />
m<strong>in</strong>imize <strong>the</strong> computational burden we only calculate <strong>the</strong> test for an outliers at a given po<strong>in</strong>t <strong>in</strong> time if<br />
To<br />
equal zero) are lower than <strong>the</strong> conventional 1.96. For <strong>the</strong> case <strong>of</strong> IOs M 4b is closer to <strong>the</strong> true<br />
specification, M 2 ,<strong>in</strong>terms<strong>of</strong><strong>the</strong>averagedistance. For<strong>the</strong>case<strong>of</strong>AOs<strong>the</strong>resultsare<strong>the</strong><br />
opposite, because <strong>the</strong> additional zero restrictions imposed <strong>in</strong> M 4b do not br<strong>in</strong>g <strong>the</strong> model closer<br />
to <strong>the</strong> correct additive specification.<br />
The broader conclusion <strong>of</strong> <strong>the</strong> results from model M 1 −M 4 seemstobethatitisnot<br />
really possible <strong>in</strong> small samples to approximate AOs with simple comb<strong>in</strong>ations <strong>of</strong> unrestricted<br />
dummies.<br />
Estimation model M 5 .<br />
In columns seven, we f<strong>in</strong>ally consider <strong>the</strong> exact additive specification;<br />
IOs can not be approximated by additive dummies.<br />
In<strong>the</strong>case<strong>of</strong>AOs<strong>the</strong>estimationmodelisidenticalto<strong>the</strong>DGP.Because<strong>the</strong>outly<strong>in</strong>g<br />
observations are completely removed from <strong>the</strong> likelihood function, <strong>the</strong> size and <strong>the</strong> power are<br />
by and large similar to <strong>the</strong> benchmark case with no outliers - and <strong>the</strong>y are <strong>in</strong>dependent <strong>of</strong> <strong>the</strong><br />
magnitude <strong>of</strong> <strong>the</strong> outliers. There is no potential ga<strong>in</strong> from additive outliers, but us<strong>in</strong>g <strong>the</strong> correct<br />
model it is possible to conduct <strong>in</strong>ference conditional on additive outly<strong>in</strong>g observations.<br />
5.2 Feasible Strategies<br />
In <strong>the</strong> specifications M 0 −M 5 we assumed that <strong>the</strong> locations <strong>of</strong> outliers were known. In this<br />
subsection we extend <strong>the</strong> analysis to strategies for modell<strong>in</strong>g outliers, which are feasible <strong>in</strong><br />
empirical applications. This <strong>in</strong>troduces <strong>the</strong> additional cost <strong>of</strong> detect<strong>in</strong>g <strong>the</strong> locations <strong>of</strong> outliers.<br />
First, we consider for comparison a stylized version <strong>of</strong> <strong>the</strong> usual practice <strong>in</strong> applied co<strong>in</strong>tegration<br />
analyses; i.e.<br />
<strong>the</strong> use <strong>of</strong> unrestricted impulse dummies for observations with large<br />
residuals. In particular, we def<strong>in</strong>e an outlier as an observation with an absolute value <strong>of</strong> <strong>the</strong><br />
standardized residual larger than 3.39. 14 For <strong>the</strong>se observations we <strong>in</strong>sert an unrestricted (<strong>in</strong>novational)<br />
dummy, D t (T i ). The results are reported under M 6 <strong>in</strong> column eight and are not far<br />
from <strong>the</strong> results <strong>of</strong> M 2 . The additional cost <strong>of</strong> search<strong>in</strong>g for <strong>the</strong> location <strong>of</strong> outliers thus seems<br />
to be small, but <strong>the</strong> strategy is disastrous if <strong>the</strong> outliers are additive.<br />
Next we consider a parallel to M 4b <strong>in</strong><strong>the</strong>case<strong>of</strong>unknownlocation. Aga<strong>in</strong>wedef<strong>in</strong>e<br />
outliers as absolute residuals larger than 3.39 and <strong>in</strong>sert unrestricted dummies with <strong>the</strong> full<br />
lag structure, D t =(D t (T i ):D t−1 (T i ):D t−2 (T i )) ′ . From this model we delete <strong>in</strong>significant<br />
dummies based on standard t−tests. The results are reported under M 7 . Aga<strong>in</strong> <strong>the</strong> search per<br />
se is not problematic, but <strong>the</strong> unrestricted dummies are still misspecified <strong>in</strong> <strong>the</strong> case <strong>of</strong> AOs<br />
and <strong>the</strong> overall ga<strong>in</strong> compared to ignor<strong>in</strong>g <strong>the</strong> outliers is questionable <strong>in</strong> small samples, cf. also<br />
panel (C).<br />
F<strong>in</strong>ally, we consider under M 8 <strong>in</strong> column ten <strong>the</strong> results from apply<strong>in</strong>g <strong>the</strong> formal outlier<br />
detection from Section 3.2. 15 In <strong>the</strong> case <strong>of</strong> IO <strong>the</strong> size is relatively constant around 10% and<br />
<strong>the</strong> numerical value <strong>of</strong> <strong>the</strong> standardized residual is larger than 2.<br />
17
<strong>the</strong> power for <strong>the</strong> test <strong>of</strong> r ≤ 1ishigh. Theresultsarenotfarfrom<strong>the</strong>correctmodelM 2 ,cf.<br />
also <strong>the</strong> average distance <strong>in</strong> panel (C). In case <strong>of</strong> AOs <strong>the</strong> size is <strong>in</strong>creas<strong>in</strong>g with <strong>the</strong> number<br />
<strong>of</strong> outliers. This reflects that <strong>in</strong> small samples AOs are sometimes mistaken for IOs and that<br />
<strong>in</strong>troduces a distortion similar to one driv<strong>in</strong>g <strong>the</strong> results <strong>the</strong> for M 2 . In larger samples, e.g.<br />
T = 200, this effect is small. In terms <strong>of</strong> <strong>the</strong> average distance <strong>the</strong> results are between <strong>the</strong> optimal<br />
result <strong>of</strong> M 5 and <strong>the</strong> basic model M 0 .ForT = 200 <strong>the</strong> results are very close to <strong>the</strong> results <strong>of</strong><br />
<strong>the</strong> correct models both <strong>in</strong> case <strong>of</strong> IOs and AOs.<br />
6 Summary and Conclud<strong>in</strong>g Remarks<br />
In this paper we have considered <strong>the</strong> role <strong>of</strong> outliers and dummy variables <strong>in</strong> <strong>the</strong> co<strong>in</strong>tegrated<br />
VAR. First, it was illustrated that <strong>in</strong>ference can be distorted by additive outliers while <strong>in</strong>novational<br />
outliers are less harmful and can actually be helpful <strong>in</strong> reveal<strong>in</strong>g <strong>the</strong> autoregressive<br />
structure. Second, it was shown that <strong>in</strong>ference based on a misspecified specification <strong>of</strong> dummy<br />
variables can be seriously mislead<strong>in</strong>g. And third, it was very difficult to approximate additive<br />
outliers with <strong>in</strong>novational dummies. In larger samples it is possible to use a general specification<br />
which nests both alternatives. But <strong>in</strong> small samples, none <strong>of</strong> <strong>the</strong> tried specifications was able<br />
to successfully approximate both IOs and AOs.<br />
Taken toge<strong>the</strong>r, <strong>the</strong>se results seriously question <strong>the</strong> usual practice <strong>in</strong> applied co<strong>in</strong>tegration<br />
analyses <strong>of</strong> <strong>in</strong>clud<strong>in</strong>g unrestricted dummy variables to whiten residuals—withoutconcernfor<strong>the</strong><br />
adequacy <strong>of</strong> <strong>the</strong> implied <strong>in</strong>novational model. That led us to suggest an estimator for <strong>the</strong> additive<br />
model and to test for <strong>the</strong> location and types <strong>of</strong> outliers prior to <strong>in</strong>ference <strong>in</strong> <strong>the</strong> co<strong>in</strong>tegration<br />
model. The simulation results based on this procedure are clearly superior to <strong>the</strong> alternative<br />
feasible strategies.<br />
An additional <strong>in</strong>terest<strong>in</strong>g result <strong>of</strong> <strong>the</strong> simulations was that it is clearly preferable to ignore<br />
possible outliers than to model <strong>the</strong>m us<strong>in</strong>g a misspecified configuration <strong>of</strong> dummies.<br />
That<br />
suggests that <strong>the</strong> basic model with no dummies could always be a benchmark specification <strong>in</strong><br />
empirical applications.<br />
18
= − T 2 log |Ω|−1 2<br />
iteration, <strong>the</strong> maximum likelihood estimates ̂ϕ j <strong>of</strong> ϕ =(α, β, Γ1, ..., Γ k−1,β0 ,µ 0 , Ω) can be found<br />
<strong>the</strong> estimated polynomial  (L). Secondly, we f<strong>in</strong>d <strong>the</strong> maximum likelihood estimates<br />
construct<br />
<strong>of</strong> θ conditional on ̂ϕ j from <strong>the</strong> estimated residuals, ê t = Â (L) Y t − ̂α̂β′ 0 t − ̂µ0, which under<br />
̂θj<br />
(Ĥ1t : Ĥ2t : ... : Ĥ nt ) to rewrite <strong>the</strong> equation for <strong>the</strong> estimated residuals as<br />
= − 1 2<br />
)′<br />
Ĥ t vec(θ)<br />
[(êt ( ê t − Ĥ t vec (θ))]<br />
,<br />
− ̂Ω−1<br />
t̂Ω<br />
) )<br />
t , (12)<br />
ê −1 (Ĥ′<br />
16 The switch<strong>in</strong>g algorithm has been compared with direct maximization us<strong>in</strong>g <strong>the</strong> BFGS algorithm (with<br />
Appendix: A Switch<strong>in</strong>g Algorithm for <strong>the</strong> Additive Model<br />
The log likelihood function <strong>of</strong> <strong>the</strong> additive model (6) subject to <strong>the</strong> non-l<strong>in</strong>ear restrictions (7)<br />
and (8) is (apart from a constant) given by<br />
log L (α, β, Γ1, ..., Γ k−1,β0 ,µ 0 , Ω,θ)<br />
T∑<br />
[(<br />
− t ) − αβ ′ 0 t (L)(Yt µ ) ′<br />
0 Ω<br />
−1 ( A (L)(Y t − θD t ) − αβ ′ 0 t − µ 0)]<br />
,<br />
θD − A<br />
t=1<br />
and that can be maximized by switch<strong>in</strong>g between two conditional maximum likelihood estimations.<br />
Consider iteration j. First, conditional on <strong>the</strong> estimate ̂θj−1 <strong>of</strong> θ from <strong>the</strong> previous<br />
from RRR <strong>of</strong> <strong>the</strong> co<strong>in</strong>tegrated VAR for <strong>the</strong> corrected data X t = Y t −̂θj−1D t . This enables us to<br />
<strong>the</strong> model (4) and (5) are given by<br />
ê t = Â (L) θD t + ɛ t .<br />
For each dummy, D it , i =1, 2, ..., n, we can def<strong>in</strong>e Ĥ it ≡ Â (L) D it and use <strong>the</strong> matrix Ĥ t =<br />
ê t = Ĥ t vec (θ)+ɛ t ,<br />
where vec (θ)stacks<strong>the</strong>columns<strong>of</strong>θ. The vary<strong>in</strong>g part <strong>of</strong> <strong>the</strong> conditional log likelihood function<br />
is now given by<br />
log L<br />
(<br />
T∑<br />
∣<br />
∣̂α, ̂β,̂Γ1,...,̂Γk−1, ̂β0 ,̂µ 0 , ̂Ω<br />
θ<br />
∣<br />
)<br />
t=1<br />
which is maximized over θ by <strong>the</strong> GLS type estimator<br />
)<br />
( T∑<br />
vec =<br />
(̂θj<br />
i=1<br />
t̂Ω<br />
) ) −1 ( T∑ (Ĥ′ t Ĥ −1 i=1<br />
see also Tsay, Peña, and Pankratz (2000) and Saikkonen and Lütkepohl (2000) for an application<br />
<strong>of</strong> a similar two step strategy. The ML estimates are obta<strong>in</strong>ed by iterat<strong>in</strong>g between <strong>the</strong> two<br />
steps until convergence.<br />
For <strong>the</strong> case <strong>of</strong> dummy variables <strong>in</strong>volv<strong>in</strong>g few observations <strong>the</strong> switch<strong>in</strong>g algorithm normally<br />
converges very fast and we can use ̂θ0 = 0 as a start<strong>in</strong>g value.<br />
In more complicated<br />
situations an <strong>in</strong>itial estimate <strong>of</strong> θ ignor<strong>in</strong>g <strong>the</strong> non-l<strong>in</strong>ear restrictions (7) and (8) can be used.<br />
A comparison between <strong>the</strong> switch<strong>in</strong>g algorithm and <strong>the</strong> direct maximization <strong>in</strong>dicates that <strong>the</strong><br />
switch<strong>in</strong>g algorithm is normally faster and more reliable 16 and <strong>the</strong> closed form solution to <strong>the</strong><br />
maximization <strong>in</strong> each step makes <strong>the</strong> procedure easy to implement.<br />
numerical derivatives) <strong>in</strong> Ox 3.0, see Doornik (2001). More <strong>in</strong>formation on <strong>the</strong> comparison is available from <strong>the</strong><br />
author on request.<br />
19
It is straightforward to impose restrictions on θ <strong>in</strong> <strong>the</strong> GLS step (12). S<strong>in</strong>ce θ enters vectorized,<br />
restrictions <strong>of</strong> <strong>the</strong> form<br />
vec (θ) =Mκ<br />
can be considered allow<strong>in</strong>g cross-equation restrictions. Here M is a pn × f dimensional design<br />
matrix, and κ conta<strong>in</strong>s <strong>the</strong> f free parameters. Often it is <strong>of</strong> <strong>in</strong>terest to test if additive outliers are<br />
present <strong>in</strong> a subset <strong>of</strong> <strong>the</strong> variables only, imply<strong>in</strong>g zero restrictions on θ. Ano<strong>the</strong>rhypo<strong>the</strong>sis<strong>of</strong><br />
<strong>in</strong>terest could be if <strong>the</strong> outliers cancel <strong>in</strong> <strong>the</strong> stationary relations, correspond<strong>in</strong>g to M = I n ⊗β⊥,<br />
with β replaced by <strong>the</strong> estimate<br />
̂βj <strong>in</strong> each iteration. Without complications, restrictions can<br />
also be imposed on <strong>the</strong> RRR part <strong>of</strong> <strong>the</strong> algorithm.<br />
20
C., and L.-M. Liu (1993): “Jo<strong>in</strong>t Estimation <strong>of</strong> Model Parameters and Outlier Effects<br />
Chen,<br />
Time Series,” Journal <strong>of</strong> <strong>the</strong> American Statistical Association, 88(841), 284—297.<br />
<strong>in</strong><br />
J. A. (1998): “Approximations to <strong>the</strong> Asymptotic Distribution <strong>of</strong> <strong>Co<strong>in</strong>tegration</strong><br />
Doornik,<br />
Journal <strong>of</strong> Economic Surveys, 12(5), 573—593.<br />
Tests,”<br />
J. A., D. F. Hendry, and B. Nielsen (1998): “Inference <strong>in</strong> Co<strong>in</strong>tegrat<strong>in</strong>g Models:<br />
Doornik,<br />
M1 Revisited,” Journal <strong>of</strong> Economic Surveys, 12(5), 533—572.<br />
UK<br />
A. (1972): “<strong>Outliers</strong> <strong>in</strong> Time Series,” Journal <strong>of</strong> <strong>the</strong> Royal Statistical Society, Series B,<br />
Fox,<br />
350—363.<br />
34(3),<br />
and N. Haldrup (1994): “The Effect <strong>of</strong> Additive <strong>Outliers</strong> on Tests for Unit<br />
Franses,P.H.,<br />
and <strong>Co<strong>in</strong>tegration</strong>,” Journal <strong>of</strong> Bus<strong>in</strong>ess and Economic Statistics, 12(4), 471—478.<br />
Roots<br />
and D. Peña (1999): “Miss<strong>in</strong>g observations <strong>in</strong> ARIMA models:<br />
Gomez,V.,A.Maravall,<br />
approach versus additive outlier approach,” Journal <strong>of</strong> Econometrics, 88, 341—363.<br />
Skipp<strong>in</strong>g<br />
and J. A. Doornik (1994): “Modell<strong>in</strong>g L<strong>in</strong>ear Dynamic Econometric Models,”<br />
Hendry,D.F.,<br />
Scottish Journal <strong>of</strong> Political Economy, 41(1), 1—33.<br />
D. F., and K. Juselius (2001): “Expla<strong>in</strong><strong>in</strong>g <strong>Co<strong>in</strong>tegration</strong> <strong>Analysis</strong>: Part II,” Energy<br />
Hendry,<br />
22(1), 75—120.<br />
Journal,<br />
D. F., and G. Mizon (1993): “Evaluat<strong>in</strong>g Dynamic Econometric Models by Encompass<strong>in</strong>g<br />
Hendry,<br />
<strong>the</strong> VAR,” <strong>in</strong> Models, Methods and Applications <strong>of</strong> Econometrics, ed. by P. Phillips,<br />
S. (1996): Likelihood-based Inference <strong>in</strong> Co<strong>in</strong>tegrated Autoregressive Models.Oxford<br />
Johansen,<br />
Press, Oxford, 2nd edn.<br />
University<br />
S., R. Mosconi, and B. Nielsen (2000): “<strong>Co<strong>in</strong>tegration</strong> <strong>in</strong> <strong>the</strong> presence <strong>of</strong> structural<br />
Johansen,<br />
breaks <strong>in</strong> <strong>the</strong> determ<strong>in</strong>istic trend,” Econometrics Journal, 1(3), 216—249.<br />
Villani (2001): “A distance measure between co<strong>in</strong>tegration spaces,”<br />
M.<br />
Letters, 70, 21—27.<br />
Economics<br />
C. (1986): “Dist<strong>in</strong>guish<strong>in</strong>g Outlier Types <strong>in</strong> Time Series,” Journal <strong>of</strong> <strong>the</strong> Royal<br />
Muirhead,<br />
Society, Series B, 48(1), 39—47.<br />
Statistical<br />
References<br />
Davidson, J. (2001): Econometric Theory. Blackwell, Oxford.<br />
(2001): Object-Oriented Matrix Programm<strong>in</strong>g Us<strong>in</strong>g Ox. Timberlake Consultants Press,<br />
London, 4rd edn.<br />
pp. 272—300. Blackwell, Oxford.<br />
K. (2002): The Co<strong>in</strong>tegrated VAR model: Econometric Methodology and Macroeconomic<br />
Juselius,<br />
Applications. Lecture notes, Institute <strong>of</strong> Economics, University <strong>of</strong> Copenhagen.<br />
Larsson, R., and<br />
21
R. A., and T. J. Wales (1991): “The likelihood dom<strong>in</strong>ance criterion A new approach<br />
Pollak,<br />
model selection,” Journal <strong>of</strong> Econometrics, 47, 227—242.<br />
to<br />
Lütkepohl (2000): “Trend Adjustment Prior to Test<strong>in</strong>g for <strong>the</strong><br />
H.<br />
Rank <strong>of</strong> a VAR Process,” Journal <strong>of</strong> Time Series <strong>Analysis</strong>, 21(4), 435—456.<br />
<strong>Co<strong>in</strong>tegration</strong><br />
D. W., S. Sarkar, and J. H. Lee (1996): “Unit root tests for time series with outliers,”<br />
Sh<strong>in</strong>,<br />
& Probability Letters, 30, 189—197.<br />
Statistics<br />
R. S., D. Peña, and A. E. Pankratz (2000): “<strong>Outliers</strong> <strong>in</strong> multivariate time series,”<br />
Tsay,<br />
87(4), 789—804.<br />
Biometrika,<br />
T. J. (1999): “Two simple procedures for test<strong>in</strong>g for a unit root when <strong>the</strong>re are<br />
Vogelsang,<br />
outliers,” Journal <strong>of</strong> Time Series <strong>Analysis</strong>, 20(2), 237—252.<br />
additive<br />
B., and A. Rahbek (2000): “Similarity Issues <strong>in</strong> <strong>Co<strong>in</strong>tegration</strong> <strong>Analysis</strong>,” Oxford<br />
Nielsen,<br />
<strong>of</strong> Economics and Statistics, 62(1), 5—22.<br />
Bullet<strong>in</strong><br />
Saikkonen, P., and<br />
Tsay,R.S.(1986): “Time Series Model Specification <strong>in</strong> <strong>the</strong> <strong>Presence</strong> <strong>of</strong> <strong>Outliers</strong>,” Journal <strong>of</strong><br />
<strong>the</strong> American Statistical Association, 81(393), 132—141.<br />
22