View 2010 Fact Book - Union Pacific
View 2010 Fact Book - Union Pacific
View 2010 Fact Book - Union Pacific

Create successful ePaper yourself
Turn your PDF publications into a flip-book with our unique Google optimized e-Paper software.
Table of Contents<br />
Overview<br />
Financials<br />
Company Overview.. . . . . . . . . . . . . . . . . . . . . . . . . . . . . . . . . 2<br />
Key Metrics and <strong>Fact</strong>s. . . . . . . . . . . . . . . . . . . . . . . . . . . . . . . 3<br />
Financial Results . . . . . . . . . . . . . . . . . . . . . . . . . . . . . . . . . . . 4<br />
Manifest Network. . . . . . . . . . . . . . . . . . . . . . . . . . . . . . . . . . . 5<br />
Bulk Network . . . . . . . . . . . . . . . . . . . . . . . . . . . . . . . . . . . . . . 6<br />
Premium Network.. . . . . . . . . . . . . . . . . . . . . . . . . . . . . . . . . . 7<br />
Operations Review .. . . . . . . . . . . . . . . . . . . . . . . . . . . . . . . . . 8<br />
Marketing Review.. . . . . . . . . . . . . . . . . . . . . . . . . . . . . . . . . 11<br />
Capital Investments. . . . . . . . . . . . . . . . . . . . . . . . . . . . . . . . 13<br />
Capacity and Commercial Projects .. . . . . . . . . . . . . . . . . . . 14<br />
Track and Terminal Density. . . . . . . . . . . . . . . . . . . . . . . . . . 15<br />
Selected Financial Data .. . . . . . . . . . . . . . . . . . . . . . . . . . . . 34<br />
Consolidated Statements of Income . . . . . . . . . . . . . . . . . . . 35<br />
Consolidated Statements of Financial Position. . . . . . . . . . . 36<br />
Consolidated Statements of Cash Flow.. . . . . . . . . . . . . . . . 37<br />
Financial and Operating Statistics. . . . . . . . . . . . . . . . . . . . . 38<br />
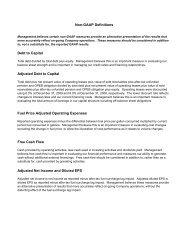
Non-GAAP Definitions. . . . . . . . . . . . . . . . . . . . . . . . . . . . . . 39<br />
Non-GAAP Reconciliations<br />
Free Cash Flow .. . . . . . . . . . . . . . . . . . . . . . . . . . . . . . . . 40<br />
Return on Invested Capital (ROIC). . . . . . . . . . . . . . . . . . 41<br />
Debt to Capital/Adjusted Debt to Capital . . . . . . . . . . . . . 41<br />
Cautionary Information .. . . . . . . . . . . . . . . . . . . . . . . . . . . . . 42<br />
Markets<br />
Agricultural . . . . . . . . . . . . . . . . . . . . . . . . . . . . . . . . . . . . . . 16<br />
Automotive. . . . . . . . . . . . . . . . . . . . . . . . . . . . . . . . . . . . . . . 19<br />
Chemicals.. . . . . . . . . . . . . . . . . . . . . . . . . . . . . . . . . . . . . . . 22<br />
Energy . . . . . . . . . . . . . . . . . . . . . . . . . . . . . . . . . . . . . . . . . . 24<br />
Industrial Products. . . . . . . . . . . . . . . . . . . . . . . . . . . . . . . . . 27<br />
Intermodal.. . . . . . . . . . . . . . . . . . . . . . . . . . . . . . . . . . . . . . . 29<br />
Mexico . . . . . . . . . . . . . . . . . . . . . . . . . . . . . . . . . . . . . . . . . . 32<br />
Investor Inquiries<br />
<strong>Union</strong> <strong>Pacific</strong>’s investor relations are coordinated through<br />
the Corporate Treasurer. Requests for interviews, investor<br />
packages and general information should be directed to:<br />
(402) 544-4227 or (877) 547-7261 or investor.relations@up.com<br />
Website Information<br />
For immediate receipt of new information as it becomes<br />
available, we invite you to regularly visit www.up.com. In the<br />
Investors section, you can view on-line or download a variety<br />
of informative documents, including SEC filings, annual reports,<br />
proxy statements, quarterly earnings, press releases, company<br />
presentations and corporate governance information. For<br />
automatic updates, please subscribe to the Company’s RSS<br />
(Really Simple Syndication) feed which provides links to new<br />
headlines and summaries through your news reader.<br />
1
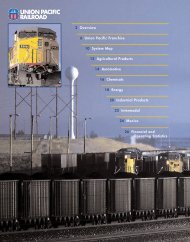
Company Overview<br />
<strong>Union</strong> <strong>Pacific</strong> Railroad Company is the principal operating<br />
subsidiary of <strong>Union</strong> <strong>Pacific</strong> Corporation and one of America’s<br />
leading transportation companies (Company, UP or Railroad).<br />
The Railroad’s network covers 23 states in the western<br />
two-thirds of the country and serves many of the fastestgrowing<br />
U.S. population centers, providing a fuel-efficient,<br />
environmentally responsible and safe mode of freight<br />
transportation. The Company’s diversified business mix<br />
includes Agricultural Products, Automotive, Chemicals, Energy,<br />
Industrial Products and Intermodal. The Company connects with<br />
other rail carriers to move freight all across North America and<br />
Mexico. UP serves eastern markets through major gateways<br />
in Chicago, St. Louis, Memphis and New Orleans. In addition,<br />
UP is the only railroad serving all six major Mexican gateways,<br />
and operates key north/south corridors for interchange traffic<br />
with the Canadian and Mexican rail systems. UP accesses<br />
markets in Canada through both the Eastport gateway in Idaho<br />
and exchange points in Minnesota, Wisconsin and Illinois. This<br />
network, combined with the well-balanced and diverse traffic<br />
mix, makes UP the premier rail franchise in North America. UP<br />
generated freight revenue of $16.1 billion in <strong>2010</strong>.<br />
The strength of UP’s diverse franchise, efficient asset utilization,<br />
strong pricing opportunities and solid network infrastructure<br />
enable it to provide customers with consistent, reliable service<br />
and shareholders with higher returns.<br />
VISION<br />
Building America<br />
Our vision symbolizes the <strong>Union</strong> <strong>Pacific</strong> experience for all<br />
the people whose lives we touch. It connects the importance<br />
of UP’s rail transportation to America’s economy, honors<br />
the generations that preceded us and is the promise for the<br />
generations that will follow us.<br />
MISSION<br />
The Men and Women of <strong>Union</strong> <strong>Pacific</strong> Are Dedicated to<br />
Serve.<br />
<strong>Union</strong> <strong>Pacific</strong> works for the good of our customers, our<br />
shareholders and one another. Our commitment defines us and<br />
drives the economic strength of our company and our country.<br />
2
Key Metrics and <strong>Fact</strong>s<br />
Key Financial and Operating Metrics <strong>2010</strong> 2009 2008<br />
Operating Revenues (millions) $16,965 $14,143 $17,970<br />
Operating Income (millions) $4,981 $3,379 $4,070<br />
Operating Ratio 70.6% 76.1% 77.4%<br />
Operating Margin 29.4% 23.9% 22.6%<br />
Employees (average) 42,884 43,531 48,242<br />
Average Fuel Price Per Gallon Consumed $2.29 $1.75 $3.15<br />
Cash Capital Expenditures (millions) $2,482 $2,354 $2,754<br />
Long-Term Leases (millions) (a) $ - $100 $353<br />
Revenue Carloads (thousands) 8,815 7,786 9,261<br />
Revenue Ton-Miles (billions) 520 479 563<br />
Gross Ton-Miles (billions) 931 846 1,020<br />
Average Train Speed (miles per hour) (b) 26.2 27.3 23.5<br />
Average System Dwell (hours) (b) 25.4 24.8 24.9<br />
Average Rail Car Inventory (b) 274,450 283,102 300,679<br />
Fuel Consumed (millions of gallons) 1,051 979 1,229<br />
GTMs per Employee (millions) 21.72 19.44 21.15<br />
(a) Represents the net present value of long-term operating and/or capital leases for new equipment.<br />
(b) As reported to the Association of American Railroads (AAR).<br />
<strong>2010</strong> <strong>Fact</strong>s (As of 12/31/10)<br />
Track Miles<br />
Route Miles 31,953<br />
Other Main Line 6,596<br />
Passing Lines and Turnouts 3,118<br />
Switching and Classification Yard Lines 9,006<br />
Total Track Miles 50,673<br />
Track Miles of Rail Installed and Replaced *<br />
New 594<br />
Used 201<br />
Total 795<br />
Track Miles of Continuous Welded Rail 28,254<br />
Track Miles Under Centralized Traffic Control 21,501<br />
Track Miles Ballasted 10,883<br />
Ties Installed and Replaced (thousands) * 4,559<br />
Rail Equipment<br />
Average<br />
Locomotives Owned Leased Total Age (yrs.)<br />
Multiple Purpose 4,935 2,628 7,563 15.9<br />
Switching 431 26 457 31.5<br />
Other 95 59 154 25.0<br />
Total Locomotives 5,461 2,713 8,174 N/A<br />
Average<br />
Freight Cars Owned Leased Total Age (yrs.)<br />
Covered Hoppers 12,123 18,252 30,375 28.7<br />
Open Hoppers 11,854 4,351 16,205 31.2<br />
Gondolas 6,500 6,190 12,690 28.1<br />
Boxcars 5,702 1,857 7,559 28.0<br />
Refrigerated Cars 2,584 4,331 6,915 22.6<br />
Flat Cars 2,885 664 3,549 33.3<br />
Other 104 456 560 N/A<br />
Total Freight Cars 41,752 36,101 77,853 N/A<br />
Average<br />
Highway Revenue Equipment Owned Leased Total Age (yrs.)<br />
Containers 9,401 39,234 48,635 5.2<br />
Chassis 2,669 23,210 25,879 7.3<br />
Total Highway Revenue Equipment 12,070 62,444 74,514 N/A<br />
* Represent “all-in” numbers, which include engineering replacement programs,<br />
commercial facility and capacity work, and other miscellaneous rail and tie projects.<br />
3
Financial Results<br />
<strong>Union</strong> <strong>Pacific</strong> reported operating revenue of nearly $17 billion<br />
in <strong>2010</strong>, a 20 percent increase from the prior year. Volume<br />
growth of 13 percent, combined with core pricing gains and<br />
increased fuel surcharges drove the improvement. Net income<br />
jumped 47 percent to a record $2.8 billion. In May of <strong>2010</strong>,<br />
the Company resumed its share repurchase program, making<br />
opportunistic purchases based on market prices, reducing the<br />
outstanding share balance 1 percent during the year. Earnings<br />
per share grew 48 percent year-over-year to $5.53. Record net<br />
income drove return on invested capital up 2.6 points to a bestever<br />
10.8 percent.<br />
Better economic conditions increased demand for rail services<br />
across nearly all of <strong>Union</strong> <strong>Pacific</strong>’s markets in <strong>2010</strong>. Each of<br />
UP’s six business teams saw volume growth, with particular<br />
strength in automotive, intermodal and industrial products.<br />
The Railroad efficiently leveraged the returning traffic, utilizing<br />
existing assets to minimize year-over-year operational cost<br />
increases. As a result, the Company reported a record<br />
operating ratio of 70.6 percent for the year, outpacing the<br />
previous record of 76.1 percent set in 2009.<br />
Operating expenses grew 11 percent, with higher yearover-year<br />
diesel fuel prices contributing nearly half of the<br />
increase. Fuel prices generally increased throughout <strong>2010</strong><br />
as the economy improved, driving <strong>Union</strong> <strong>Pacific</strong>’s average<br />
diesel fuel price per gallon up nearly 20 percent from January<br />
to December. UP’s average diesel fuel price for <strong>2010</strong> was<br />
$2.29 per gallon, up 31 percent from $1.75 per gallon in<br />
2009. The Railroad’s fuel consumption improved 3 percent<br />
in <strong>2010</strong>, partially offsetting the higher fuel prices and saving<br />
approximately 27 million gallons of fuel.<br />
Volume improvement, efficient operations and pricing gains<br />
generated strong incremental margins throughout <strong>2010</strong>.<br />
Volumes are a critical component to this achievement, as<br />
quarterly incremental margins of approximately 60 percent<br />
corresponded with double-digit volume growth.<br />
27%<br />
-5%<br />
4Q09<br />
Return on Invested Capital<br />
(Percent)<br />
10.8<br />
10.2<br />
8.8<br />
8.2<br />
2007 2008<br />
79.3<br />
2007 2008 2009 <strong>2010</strong><br />
$0.27<br />
Incremental Margins<br />
60% 60%<br />
58%<br />
13%<br />
1Q10<br />
Operating Ratio<br />
(Percent)<br />
77.4<br />
18%<br />
2Q10<br />
76.1<br />
14%<br />
3Q10<br />
Year-over-year volume growth<br />
$0.33<br />
2009 <strong>2010</strong><br />
70.6<br />
Declared Dividends Per Share<br />
(<strong>2010</strong>)<br />
+41%<br />
$0.38<br />
$0.33<br />
48%<br />
9%<br />
4Q10<br />
The Company’s free cash flow more than doubled in <strong>2010</strong> to<br />
$1.4 billion, supporting two quarterly dividend increases during<br />
the year. Quarterly dividends grew from $0.27 to $0.33 and<br />
then to $0.38 per share, for a total increase of 41 percent.<br />
1Q<br />
2Q<br />
3Q<br />
4Q<br />
4
Manifest Network<br />
Freight Traffic - <strong>2010</strong> Carloads<br />
Premium<br />
44%<br />
Bulk<br />
32%<br />
Manifest<br />
24%<br />
Manifest traffic includes individual carload or less-than-trainload<br />
business, involving commodities such as lumber, steel, paper,<br />
food and chemicals, all transported from thousands of locations<br />
across <strong>Union</strong> <strong>Pacific</strong>’s network. The Railroad’s extensive<br />
manifest infrastructure includes terminal locations throughout<br />
its system and storage-in-transit facilities in the Gulf Coast<br />
region, which allow our chemical customers to store their<br />
products at our facilities prior to final delivery. This unique<br />
aspect of UP’s franchise serves customers in virtually every<br />
segment of the economy. Through rail industry partnerships,<br />
UP can access approximately 90 percent of the North American<br />
population. In <strong>2010</strong>, manifest traffic represented 24 percent of<br />
the Company’s volume and 41 percent of freight revenue.<br />
5
Bulk Network<br />
Freight Traffic - <strong>2010</strong> Carloads<br />
Premium<br />
44%<br />
Manifest<br />
24%<br />
Bulk<br />
32%<br />
Bulk traffic primarily consists of coal, grain, soda ash and rock<br />
shipped in unit trains – trains transporting a single commodity<br />
from one origin to one destination. Most of UP’s coal traffic<br />
originates from the Southern Powder River Basin (SPRB) of<br />
northeastern Wyoming and the Uinta Basin of Colorado and<br />
Utah. Grain and grain products move out of the Midwest to<br />
serve domestic markets, Mexico and export ports in the Gulf<br />
Coast and <strong>Pacific</strong> Northwest (PNW). Producers mine soda ash<br />
near Green River, Wyoming destined for export ports in the<br />
Gulf Coast and PNW. Rock trains move primarily in and around<br />
Texas. The Railroad designed its bulk network to handle high<br />
volume, efficient, point-to-point moves. Operating this network<br />
represents a core competency and franchise strength for UP.<br />
In <strong>2010</strong>, bulk traffic represented 32 percent of the Company’s<br />
volume and freight revenue.<br />
6
Premium Network<br />
Freight Traffic - <strong>2010</strong> Carloads<br />
Premium<br />
44%<br />
Manifest<br />
24%<br />
Bulk<br />
32%<br />
<strong>Union</strong> <strong>Pacific</strong>’s premium business includes the transportation<br />
of finished vehicles, auto parts, intermodal containers and<br />
truck trailers. UP is the largest automotive carrier west of the<br />
Mississippi River. The Railroad’s extensive franchise serves<br />
vehicle assembly plants and connects to West Coast ports<br />
and the Port of Houston to accommodate import and export<br />
shipments. UP’s network directly accesses all six U.S./Mexico<br />
rail gateways, providing expedited handling of the growing<br />
cross-border automotive traffic. Intermodal and automotive<br />
import traffic profits from excellent service in competitive longhaul<br />
routes connecting the West Coast ports and eastern<br />
gateways, particularly along the Sunset Corridor from Los<br />
Angeles to El Paso. Additionally, time-sensitive domestic<br />
intermodal shippers benefit from the ramp-to-ramp and door-todoor<br />
service UP provides across its network. In <strong>2010</strong>, premium<br />
traffic represented 44 percent of the Company’s volume and 27<br />
percent of freight revenue.<br />
7
Operations Review<br />
<strong>Union</strong> <strong>Pacific</strong> continues to improve customer satisfaction and<br />
drive efficiency in all aspects of its operations. Building upon<br />
recent success, the network is continuously evaluated for<br />
additional improvement opportunities. By simplifying operations<br />
and removing variability, the Company creates a streamlined<br />
network with greater asset utilization, leading to better customer<br />
service and shareholder value.<br />
Service - Volume Equation<br />
(Monthly Data)<br />
System velocity, as reported to the AAR, declined 4 percent<br />
compared to a best-ever performance in 2009. Maintenance<br />
activities and weather disruptions, combined with higher volume<br />
levels, drove the decrease. Despite this slight reduction in<br />
year-over-year train speed, the Company’s ongoing efforts to<br />
enhance operations through process improvement, advanced<br />
technology and capacity investment again translated into better<br />
customer service. In fact, customer satisfaction improved in<br />
<strong>2010</strong>, surpassing a record established in 2009.<br />
Lower volumes in 2009 required the Company to idle a<br />
significant number of assets, with approximately 26 percent of<br />
UP’s road locomotives and 18 percent of freight car inventory<br />
in storage at year-end. As traffic levels improved during <strong>2010</strong>,<br />
a portion of these assets returned to active service. At the end<br />
of <strong>2010</strong>, idle assets accounted for approximately 17 percent<br />
of the road locomotive fleet and 14 percent of freight car<br />
Service Excellence<br />
inventory, reflecting UP’s ability to effectively leverage assets<br />
as volumes return to the network. <strong>Union</strong> <strong>Pacific</strong> closed or<br />
significantly reduced operations at 30 of its 114 principal rail<br />
yards in 2009, routing traffic to larger, more efficient yards. The<br />
Railroad re-opened seven yards during <strong>2010</strong> as traffic returned<br />
to the network. The remaining 23 terminals represent available<br />
capacity to handle future carload growth. Additionally, roughly<br />
1,500 employees remained on furlough status at year-end<br />
<strong>2010</strong>, significantly less than the peak of 5,300. Most of the<br />
furloughed employees have been out of service more than two<br />
(000)<br />
200<br />
190<br />
180<br />
170<br />
160<br />
150<br />
140<br />
<strong>2010</strong> Average<br />
Velocity*<br />
(MPH)<br />
28<br />
26<br />
24<br />
22<br />
20<br />
years, so only a portion is expected to return to work. Those<br />
furloughed employees who do return require less training than<br />
newly hired individuals and enter active service more quickly.<br />
130<br />
120<br />
110<br />
18<br />
16<br />
<strong>Union</strong> <strong>Pacific</strong>’s Unified Plan creates operational efficiencies<br />
by generating capacity through better utilization of resources<br />
and reducing network variability. In <strong>2010</strong>, carloads increased<br />
13 percent and gross ton-miles grew 10 percent, but through<br />
efficiencies created by the Unified Plan total first crew starts<br />
100<br />
Q1 Q2 Q3 Q4 Q1 Q2 Q3 Q4 Q1 Q2 Q3 Q4<br />
2008 2009 <strong>2010</strong><br />
7-Day Carloads Velocity*<br />
* as reported to the AAR<br />
14<br />
increased only 5 percent. A 1 percent decline in average<br />
8
Operations Review<br />
employees drove a 12 percent year-over-year improvement in<br />
gross ton-miles per employee. Freight car utilization improved<br />
during the year, with cycle time decreasing to an all-time best of<br />
8.6 days. In addition, train size increased year-over-year for all<br />
train categories. Better resource utilization enables the Railroad<br />
to efficiently transport more freight with fewer assets.<br />
Employee Safety<br />
(Reportable Personal Injury Incidents Per 200,000 Man-Hours)<br />
1.73<br />
1.59<br />
1.45<br />
Good<br />
1.37<br />
Safety<br />
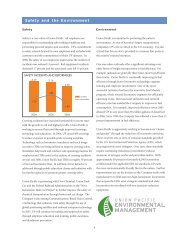
Good safety performance benefits all facets of <strong>Union</strong> <strong>Pacific</strong>’s<br />
business, from employees, customers and communities to<br />
velocity, productivity and service. UP’s focus on safety creates<br />
a culture that is immersed in safe practices and behaviors,<br />
resulting in year-over-year improvement during <strong>2010</strong>.<br />
2007 2008 2009 <strong>2010</strong>*<br />
* Best-ever safety performance<br />
Reportable employee injury incident rates fell 6 percent versus<br />
2009 to a new record low level, as Total Safety Culture (TSC)<br />
continues to be implemented throughout the Company. TSC<br />
promotes safety among employees, and empowers them to<br />
support safe behavior individually and among their peers, and<br />
implement best practices.<br />
The Company’s reportable equipment incident rate declined 6<br />
percent, driven by a multi-faceted approach to identifying and<br />
mitigating risk, including the use of advanced technology such<br />
as lasers, ultrasound and acoustic vibration monitoring, as well<br />
as visual inspection from dedicated track safety experts.<br />
Economic improvement increased rail and highway traffic in<br />
<strong>2010</strong>, contributing to a higher number of crossing accidents.<br />
The Railroad closed 286 grade crossings during the year to<br />
reduce exposure to grade crossing incidents. Video cameras<br />
continue to be installed on UP’s locomotive fleet to assist in<br />
reviewing grade crossing incidents. More than 97 percent of<br />
UP’s through-freight trains have camera-equipped locomotives<br />
in the lead position. In addition, the Company continues to<br />
engage in public education efforts such as Operation Lifesaver<br />
and UP CARES to improve safety.<br />
Fuel Efficiency<br />
Customer Safety<br />
(Reportable Incidents Per Million Train Miles)<br />
3.61<br />
3.68<br />
3.17<br />
2007 2008 2009 <strong>2010</strong>*<br />
* Best-ever safety performance<br />
Good<br />
2.98<br />
Public Safety<br />
(Crossing Accidents Per Million Train Miles)<br />
2.72<br />
Good<br />
2.37 2.32<br />
2.11<br />
Improvements in the Railroad’s operating practices save<br />
fuel and reduce emissions. The implementation of automatic<br />
locomotive shutdown technology, locomotive assignment<br />
to trains on a tons per axle basis and distributed power<br />
2007 2008 2009 <strong>2010</strong><br />
9
Operations Review<br />
locomotives (DPU), all contribute to this effort. Additionally,<br />
UP’s ongoing employee-driven Fuel Masters Unlimited program<br />
Intermodal Train Size<br />
(Boxes)<br />
rewards the fuel-saving efforts of locomotive engineers.<br />
Good<br />
166<br />
The use of newer, more fuel efficient locomotives also helps<br />
save fuel. <strong>Union</strong> <strong>Pacific</strong> operates the cleanest and most modern<br />
fleet in North America. Since 2000, UP has spent approximately<br />
$6 billion to purchase more than 3,400 locomotives that meet<br />
158<br />
154<br />
153<br />
EPA Tier 0, Tier 1 or Tier 2 guidelines.<br />
Reduced fuel consumption is also expected from emerging<br />
technologies, such as wheel/rail lubrication and aerodynamic<br />
enhancements.<br />
2007 2008 2009 <strong>2010</strong><br />
Technology<br />
Technology enables the Company to continually focus on<br />
improving all aspects of its operations. DPU implementation<br />
Manifest Train Size<br />
(Cars)<br />
leads to fuel savings and improves the efficiency of locomotive<br />
and crew resources by increasing train length without<br />
jeopardizing performance. The use of DPU continues to be<br />
Good<br />
86<br />
expanded across UP’s network, moving over 8 percent more<br />
GTMs in <strong>2010</strong> than in 2009. DPU helped drive record train sizes<br />
in <strong>2010</strong>.<br />
79<br />
81<br />
82<br />
Advancements in technology also facilitate better defect<br />
detection. <strong>Union</strong> <strong>Pacific</strong> built the first device to ultrasonically<br />
test wheel sets for internal cracking. The Company’s ultrasonic<br />
wheel testing facility in North Platte, NE is the first of its kind in<br />
the world, and tests every wheel on a train as it passes through<br />
the facility. As a result, no coal trains derailed from internal<br />
wheel defects during the past two years.<br />
2007 2008 2009 <strong>2010</strong><br />
Current wayside detection technologies measure characteristics<br />
such as wheel and bearing temperature and wheel geometry<br />
SPRB Coal Train Size<br />
(Cars)<br />
as trains pass, to help identify defects before derailments<br />
occur. <strong>Union</strong> <strong>Pacific</strong> is in the early stages of implementing<br />
Good<br />
a new photographic imaging detection system to provide<br />
132<br />
132<br />
comprehensive monitoring of axles, wheels, brakes, couplers,<br />
springs and other components at a single location while trains<br />
131<br />
pass.<br />
130<br />
2007 2008 2009 <strong>2010</strong><br />
10
Marketing Review<br />
An improving economy and <strong>Union</strong> <strong>Pacific</strong>’s strong value<br />
proposition increased volume and revenue in <strong>2010</strong>, even as<br />
some markets struggled to show signs of a sustained recovery.<br />
The strength of the Railroad’s unique franchise, targeted capital<br />
investments that improved network fluidity and asset utilization,<br />
and strong service levels came together to create value for<br />
customers in <strong>2010</strong>. Customer satisfaction levels reflect this<br />
value, as UP set new records for the fourth consecutive year.<br />
The Company’s continued focus on strengthening relationships<br />
with customers, targeting new business opportunities on the<br />
UP network and beyond with door-to-door service offerings and<br />
creating a competitive advantage that earns a higher price in<br />
the market improved overall returns.<br />
Business Mix - <strong>2010</strong> Freight Revenue<br />
Industrial<br />
Products<br />
16%<br />
Energy<br />
22%<br />
Intermodal<br />
20%<br />
Agricultural<br />
19%<br />
Chemicals<br />
15%<br />
Automotive<br />
8%<br />
Each of the Company’s six business teams benefited from a<br />
stronger economy in <strong>2010</strong>, with overall volume growing 13<br />
percent. Agricultural volume grew 6 percent, boosted by strong<br />
export demand for U.S. wheat, corn and soybeans. Demand<br />
for ethanol and DDGS (dried distillers grain with solubles, a<br />
co-product of ethanol production that is used for animal feeding)<br />
drove growth in the grain products segment. <strong>Union</strong> <strong>Pacific</strong>’s<br />
automotive traffic climbed 31 percent versus the prior year, as<br />
a result of stronger industry sales. Several factors contributed<br />
to an 11 percent increase in chemicals traffic. Strong potash<br />
exports led to improved fertilizer volume, and growth in the<br />
crude oil market contributed to strong demand for petroleum<br />
products. Improving industrial production and a return to more<br />
normal inventory levels led to increased industrial chemical<br />
shipments. Energy volume increased 2 percent year-over-year,<br />
driven by a stronger economy and unusually warm weather<br />
during the summer. Industrial Products shipments grew 19<br />
percent, as stronger industrial production and increased<br />
energy-related drilling activity spurred demand for steel, scrap<br />
and non-metallic minerals. Hazardous waste shipments more<br />
than doubled in <strong>2010</strong> – largely driven by the short-haul uranium<br />
tailings move in Utah for the Department of Energy. While<br />
volumes related to commercial construction-related markets,<br />
such as cement, declined in <strong>2010</strong>, drilling-related construction<br />
led to an increase in rock shipments. Intermodal traffic grew<br />
19 percent, with continued inventory restocking and higher<br />
consumer demand driving international volumes up 20 percent.<br />
Domestic business increased 18 percent from 2009 levels,<br />
6.0%<br />
Customer Satisfaction Index<br />
80<br />
83<br />
2007 2008<br />
Annual Pricing Trend<br />
6.0%<br />
88 89<br />
2009 <strong>2010</strong><br />
4.5%<br />
5.0%<br />
5.5% 5.0% 5.5% 4.5%<br />
2007 2008 2009 <strong>2010</strong><br />
Price Excluding RCAF Fuel Impact<br />
Reported Core Price (Including RCAF Fuel Impact)<br />
11
Marketing Review<br />
driven by service improvement and new product offerings that<br />
continued to attract highway conversions. The Streamline<br />
subsidiary’s door-to-door product jumped more than 60 percent,<br />
with nearly half of the growth coming from converted highway<br />
business.<br />
Volume growth, core price improvement of 5 percent and higher<br />
fuel surcharge revenue combined to drive a 20 percent increase<br />
in freight revenue to $16.1 billion. UP’s competitive service<br />
offerings and strong value proposition enable us to enter new<br />
markets and attract more business at higher returns, supporting<br />
future revenue growth. From 2007 to <strong>2010</strong>, UP’s core price<br />
improvements ranged between 4.5 and 6 percent. Legacy<br />
contracts comprised 12 percent of the Company’s revenue<br />
portfolio at the beginning of 2011, and present significant<br />
opportunities for further yield improvement as UP competes for<br />
and re-prices this business.<br />
<strong>2010</strong> Revenue Composition<br />
Domestic<br />
69%<br />
International<br />
31%<br />
Export -<br />
Other<br />
29%<br />
Export -<br />
Mexico<br />
16%<br />
Import -<br />
Mexico<br />
14%<br />
Import -<br />
Other<br />
41%<br />
Annual Summary by Quarter<br />
<strong>2010</strong> 2009 2008<br />
1st 2nd 3rd 4th Total 1st 2nd 3rd 4th Total 1st 2nd 3rd 4th Total<br />
Freight Revenue (millions of dollars)<br />
3,755 3,956 4,187 4,171 16,069 3,240 3,121 3,471 3,541 13,373 4,059 4,349 4,630 4,080 17,118<br />
Revenue Ton-Miles (millions)<br />
126,803 126,314 134,509 132,774 520,400 118,420 113,234 124,007 123,527 479,188 140,707 140,939 145,787 135,198 562,631<br />
Revenue Carloads (thousands)<br />
2,082 2,180 2,316 2,237 8,815 1,847 1,852 2,035 2,052 7,786 2,335 2,371 2,398 2,157 9,261<br />
Average Revenue Per Car (dollars)<br />
1,804 1,815 1,807 1,865 1,823 1,755 1,685 1,706 1,726 1,718 1,738 1,835 1,931 1,891 1,848<br />
12
Capital Investments<br />
Capital investments in <strong>Union</strong> <strong>Pacific</strong>’s network improve safety,<br />
service and network efficiency, while also expanding capacity to<br />
meet the transportation needs of current and future customers.<br />
Investments include the replacement, improvement and<br />
expansion of track and facilities, as well as the acquisition of<br />
new locomotives, freight cars and intermodal containers.<br />
The Company’s capital can be broadly classified into three<br />
categories: replacement, growth and productivity, and positive<br />
train control (PTC). Replacement capital improves safety and<br />
efficiency by replacing current infrastructure, such as track,<br />
facilities and equipment. Growth and productivity capital<br />
targets the future needs of the Company and its customers,<br />
supporting both volume expansion and efficiency. Equipment<br />
acquisitions can be categorized as either replacement or growth<br />
and productivity, as new equipment can add capacity to our<br />
network or replace older, less efficient assets. Capital for PTC<br />
addresses the legislative mandate contained within the Rail<br />
Safety Improvement Act of 2008 that requires railroad carriers<br />
to implement PTC by the end of 2015.<br />
<strong>2010</strong> Summary: $2.5 billion<br />
<strong>Union</strong> <strong>Pacific</strong> spent $1.8 billion on replacement capital.<br />
Approximately $1.6 billion went to the engineering replacement<br />
program, and included installing more than 4.3 million ties<br />
and 795 track miles of rail to improve track infrastructure<br />
and reduce slow orders, providing safe, fluid operations and<br />
greater network efficiency. The remaining replacement capital<br />
consisted of locomotive fleet overhauls, upgrades and fuel<br />
conservation projects, as well as improvements to freight cars<br />
and information technology assets.<br />
Spending on growth and productivity initiatives totaled more<br />
than $600 million. The Company completed construction of the<br />
Joliet Intermodal Terminal, which officially opened in August<br />
<strong>2010</strong>. The new terminal increases the Railroad’s international<br />
and domestic container capacity while improving rail traffic<br />
efficiencies throughout the Chicago region. UP acquired new<br />
equipment to meet growing demand for rail transportation,<br />
including 775 covered hoppers, 9,200 intermodal containers<br />
and nearly 3,000 chassis. Spending during the year also<br />
included work on the Sunset Corridor and yard and bridge<br />
capacity expansion projects to improve network efficiency.<br />
2011 Outlook: Approximately $3.2 billion<br />
Replacement capital is expected to total more than $1.8<br />
billion. The engineering replacement program is forecast to<br />
be approximately $1.7 billion, and includes the installation of<br />
about 4.3 million ties and roughly 1,000 track miles of rail. The<br />
remaining replacement capital is for locomotive fleet overhauls,<br />
upgrades and servicing facilities, as well as other equipment<br />
needs.<br />
<strong>Union</strong> <strong>Pacific</strong> anticipates spending around $1.1 billion for<br />
growth and productivity initiatives. Projects such as doubletracking<br />
the Sunset Corridor and the Blair Subdivision will<br />
improve network capacity to efficiently handle volume growth<br />
along the Railroad’s two primary east/west routes.<br />
UP plans to acquire 100 new road locomotives, which will<br />
improve fleet reliability and fuel efficiency, reduce emissions<br />
and expand distributed power capability. In addition, they<br />
provide flexibility in advance of developing technology to meet<br />
Tier 4 emissions standards set by the EPA (effective 2015).<br />
Planned acquisitions of new equipment include 650 freight<br />
cars, 4,800 containers and 4,800 chassis, helping provide the<br />
capacity to efficiently handle current and future demand growth.<br />
Spending on PTC is expected to be about $250 million in<br />
2011. The Company currently estimates that PTC will cost<br />
approximately $1.4 billion to implement by the end of 2015. This<br />
includes costs for installing the new system along the Railroad’s<br />
tracks, upgrading locomotives to work with the new system and<br />
adding digital data communication equipment so all parts of the<br />
system can communicate with each other.<br />
Positive Train<br />
Control<br />
$84<br />
<strong>2010</strong> Capital Investments<br />
(In Millions)<br />
Engineering<br />
Replacement<br />
$1,625<br />
<strong>Union</strong> <strong>Pacific</strong> spent about $85 million on PTC development<br />
in <strong>2010</strong>. Spending on this developing collision avoidance<br />
technology focused on signal work and related communication<br />
infrastructure.<br />
Capacity/<br />
Commercial<br />
Facilities<br />
$349<br />
Technology<br />
& Other<br />
$94<br />
Locomotives<br />
& Equipment<br />
$330<br />
Replacement Growth and Productivity Positive Train Control<br />
13
Capacity and Commercial Projects<br />
<strong>2010</strong> Capacity/Commercial Projects<br />
3.1<br />
Capital Spending<br />
($ In Billions)<br />
3.2<br />
8%<br />
2.5<br />
2.5<br />
1% 3%<br />
Existing and Proposed Corridor/Terminal Projects<br />
2008 2009 <strong>2010</strong> 2011E<br />
Base<br />
Positive Train Control<br />
* Includes cash capital, leases and other non-cash capital<br />
14
Track and Terminal Density<br />
Lane density based on carloadings<br />
Line thickness depicts traffic density<br />
<strong>2010</strong> Terminal Volumes<br />
Major Classification Yards Average Daily Volume/Cars<br />
North Platte, Nebraska 2,100<br />
North Little Rock, Arkansas 1,500<br />
Englewood (Houston), Texas 1,400<br />
Proviso (Chicago), Illinois 1,300<br />
Fort Worth, Texas 1,200<br />
Livonia, Louisiana 1,200<br />
Roseville, California 1,100<br />
West Colton, California 1,100<br />
Pine Bluff, Arkansas 1,100<br />
Neff (Kansas City), Missouri 900<br />
Major Intermodal Terminals<br />
Annual Lifts<br />
ICTF (Los Angeles), California 450,000<br />
East Los Angeles, California 429,000<br />
Global II (Chicago), Illinois 342,000<br />
Global I (Chicago), Illinois 317,000<br />
Marion (Memphis), Tennessee 292,000<br />
Dallas, Texas 280,000<br />
Lathrop (Stockton), California 247,000<br />
Yard Center (Chicago), Illinois 241,000<br />
City of Industry (Los Angeles), California 233,000<br />
LATC (Los Angeles), California 224,000<br />
Traffic Classification - <strong>2010</strong> Carloads<br />
UP<br />
Destination<br />
15%<br />
Forwarded<br />
20%<br />
Bridged 3%<br />
Local<br />
62%<br />
Local = UP Origin + UP Destination<br />
Forwarded = UP Origin + Other Destination<br />
UP Destination = Other Origin + UP Destination<br />
Bridged = Other Origin + UP Intermediate + Other Destination<br />
15
Agricultural<br />
Transportation of whole grains, commodities produced from<br />
these grains, and food and beverage products generated 19<br />
percent of the Railroad’s <strong>2010</strong> freight revenue. <strong>Union</strong> <strong>Pacific</strong><br />
accesses most major grain markets, linking the Midwest and<br />
western producing areas to export terminals in the PNW and<br />
Gulf Coast ports, as well as Mexico. Unit shuttle trains, which<br />
transport a single commodity efficiently between producers<br />
and export terminals or domestic markets, represent nearly 35<br />
percent of Agricultural shipments. UP also serves significant<br />
domestic markets, including grain processors, animal feeders<br />
and ethanol producers in the Midwest, West, South and Rocky<br />
Mountain states.<br />
Food &<br />
Refrigerated<br />
23%<br />
Grain<br />
Products<br />
33%<br />
Whole<br />
Grains<br />
44%<br />
<strong>2010</strong> Carloads<br />
Mexico - 13%<br />
International - 17%<br />
Domestic - 70%<br />
<strong>Union</strong> <strong>Pacific</strong>’s unique franchise, coupled with ownership of<br />
the largest refrigerated boxcar fleet in the industry, creates a<br />
competitive advantage in the shipment of perishables. <strong>Union</strong><br />
<strong>Pacific</strong> offers two premium services for these products. Produce<br />
Railexpress carries fresh produce from the West Coast to New<br />
York. Express Lane moves dairy products, canned goods, wine,<br />
frozen foods and some fresh produce from the West Coast to<br />
destinations in the East and Southeast. These two services<br />
directly access California and Washington, which produce<br />
over 60 percent of the nation’s fresh fruits and vegetables.<br />
The Railroad also transports frozen meat and poultry from the<br />
Midwest and Mid-South to the West Coast for export.<br />
UP considers Canada and Mexico important extensions of<br />
its domestic markets through alliances with other railroads.<br />
Roughly two-thirds of Agricultural shipments to and from Mexico<br />
consist of southbound commodities such as corn, soybeans,<br />
wheat and soybean meal. Shipments of beer account for most<br />
of the northbound traffic from Mexico.<br />
Agricultural Line Density Map<br />
Whole Grains 44%<br />
Domestic Feed Grains 21%<br />
Wheat & Food Grains 12%<br />
Export Feed Grains 11%<br />
Grain Products 33%<br />
Meals & Oils 13%<br />
Feed Ingredients 10%<br />
Corn Refining & Ethanol 10%<br />
Food & Refrigerated 23%<br />
Food & Beverage 12%<br />
Refrigerated Products 5%<br />
Flour & Rice* 6%<br />
*Flour & Rice moved from Grain Products to Food & Refrigerated<br />
Agricultural revenue grew 13 percent in <strong>2010</strong>, driven by a<br />
6 percent rise in carloads, higher fuel surcharges and price<br />
improvements. Corn and feed grain shipments increased<br />
from 2009, reflecting more export volume to the PNW and<br />
heightened demand in Mexico, as well as higher volumes<br />
into ethanol plants in California and Idaho. In 2009, some<br />
forward ethanol plants (production facilities located closer to<br />
consumers) temporarily ceased operations due to lower ethanol<br />
margins, contributing to a favorable year-over-year comparison.<br />
In addition, strong export demand via the Gulf ports drove up<br />
shipments of wheat and food grains.<br />
The U.S. government’s ethanol production mandate within the<br />
Energy Independence and Security Act of 2007 increased from<br />
10.5 to 12 billion gallons per year in <strong>2010</strong>. As a result, ethanol<br />
traffic grew 15 percent and revenue rose 25 percent year-overyear.<br />
The shipment of perishables is a highly truck-competitive<br />
market, as customers require fast, reliable transit times.<br />
Improvement of the Railroad’s network performance creates<br />
opportunities to capture market share from trucks. In <strong>2010</strong>,<br />
<strong>Union</strong> <strong>Pacific</strong>’s Produce Railexpress moved 20 percent more<br />
refrigerated boxcars, carrying produce from the West Coast to<br />
the East Coast.<br />
Lane density based on carloadings. Line thickness depicts traffic density.<br />
16
Agricultural<br />
More than half of UP’s agricultural business moves on the<br />
Railroad’s manifest network. This network allows shippers of<br />
all sizes to benefit from access to efficient, value-added rail<br />
service, and enables the Railroad to effectively compete for<br />
food and grain products business.<br />
Paul Hammes,<br />
VP & GM Agricultural<br />
2011 Market Drivers<br />
Strong export demand for grain and soybeans is expected to<br />
continue through the first half of 2011. Wheat exports should<br />
remain strong, as U.S. exports continue to benefit from grain<br />
production problems in Eastern Europe and Russia. Strong<br />
protein demand in China occurred throughout the first quarter<br />
of 2011, which translated into continued growth in soybean<br />
exports. Some weakness in corn exports is expected, however,<br />
as a result of lower overall corn yield. While the potential exists<br />
for a strong second half, actual results will depend on crop<br />
growing conditions in the United States and throughout the<br />
world.<br />
Inclement weather late in the <strong>2010</strong> growing season negatively<br />
impacted crop yields, primarily corn. The USDA projects a 4<br />
percent decline in corn and soybean production compared<br />
to record production in the prior crop year, which could<br />
affect carload volumes. While animal feeding is expected to<br />
grow slightly during the current crop year, it is expected to<br />
remain below the five year average. Soybean crush volume,<br />
the leading indicator for soybean meal and oil production,<br />
is forecast to decline from the prior crop year due to lower<br />
soybean production and increased soybean exports.<br />
Ethanol should deliver modest volume growth in 2011. Current<br />
corn-based production can meet the government’s mandate,<br />
which increases from 12 to 12.6 billion gallons per year in 2011.<br />
Texas and California are viewed as the largest growth areas for<br />
this product within <strong>Union</strong> <strong>Pacific</strong>’s network, and new terminals<br />
that opened in these states during <strong>2010</strong> are expected to support<br />
ongoing efficient distribution. Corn shipments to forward ethanol<br />
plants are also forecast to grow in 2011.<br />
How is your business group positioned to generate<br />
“economy plus” volume growth between 2011 and 2015?<br />
Growth in many Agricultural markets depends on grain production<br />
in the United States and throughout the world. As demand<br />
increases, grain production needs to grow as well. The majority of<br />
crop production growth is expected to come from three sources:<br />
shifting crop acres, acreage growth and higher crop yields. We are<br />
currently seeing a modest acreage shift from wheat to corn, which<br />
has a higher yield per acre. Also, some acreage may be taken<br />
out of the USDA’s Conservation Reserve Program over the next<br />
five years, adding to the total acreage available for production.<br />
Corn yield is expected to exceed 170 bushels per acre by 2015,<br />
representing an increase of more than 10 percent above current<br />
levels.<br />
While domestic demand should remain fairly constant, export<br />
markets present significant opportunities for <strong>Union</strong> <strong>Pacific</strong>.<br />
Population growth in Asian countries coupled with standard of<br />
living improvements are expected to drive strong demand for<br />
grain, soybeans, soybean meal, soybean oil and DDGS.<br />
While these opportunities will vary with world production, we<br />
expect to capitalize on this growth. <strong>Union</strong> <strong>Pacific</strong>’s network in<br />
Iowa, Nebraska and Minnesota is closely aligned with production<br />
areas that should have corn yields higher than the national<br />
average. Also, to enhance the efficiency of our grain service,<br />
<strong>Union</strong> <strong>Pacific</strong> acquired (via purchase and operating lease) 1,100<br />
new high-capacity large covered hoppers in <strong>2010</strong>. Another 500<br />
grain cars are part of the Company’s 2011 capital budget of $3.2<br />
billion.<br />
We expect volume growth in the food and refrigerated markets<br />
to be driven by increased population and further penetration in<br />
the historically truck-served perishables market. Our premium<br />
perishable services, Produce Railexpress and Express Lane,<br />
provided more than 95 percent on-time or early service reliability<br />
over the past year. Additionally, we offer door-to-door service in<br />
cooperation with <strong>Union</strong> <strong>Pacific</strong> Distribution Services, allowing<br />
greater reach into the refrigerated truck markets. We expect<br />
demand to grow and are well-positioned to handle it with the<br />
largest, most modern refrigerated boxcar fleet in the United<br />
States.<br />
Both of UP’s premium perishable service offerings are expected<br />
to see volume growth in 2011, driven by continued improvement<br />
in transit time performance.<br />
17
Export Grain Flows<br />
Annual Summary by Quarter - Agricultural<br />
<strong>2010</strong> 2009 2008<br />
1st 2nd 3rd 4th Total 1st 2nd 3rd 4th Total 1st 2nd 3rd 4th Total<br />
Freight Revenue (millions of dollars)<br />
730 698 750 840 3,018 661 618 649 738 2,666 756 778 848 792 3,174<br />
Revenue Ton-Miles (millions)<br />
22,052 20,147 22,062 23,976 88,237 20,067 18,854 19,563 22,723 81,207 22,485 22,111 22,431 21,560 88,588<br />
Revenue Carloads (thousands)<br />
228 213 229 248 918 212 203 215 235 865 240 236 243 228 947<br />
Average Revenue Per Car (dollars)<br />
3,202 3,277 3,271 3,386 3,286 3,116 3,045 3,026 3,129 3,080 3,151 3,301 3,486 3,472 3,352<br />
18
Automotive<br />
<strong>Union</strong> <strong>Pacific</strong> is the largest automotive carrier west of the<br />
<strong>2010</strong> Carloads<br />
Mississippi River and operates or accesses 43 distribution<br />
centers. The Railroad’s extensive franchise serves vehicle<br />
assembly plants and connects to West Coast ports and the<br />
Port of Houston to accommodate both import and export<br />
shipments. In addition to transporting finished vehicles, UP<br />
provides expedited handling of automotive parts in both boxcars<br />
and intermodal containers destined for Mexico, the U.S. and<br />
Canada. The Automotive group generated 8 percent of <strong>Union</strong><br />
<strong>Pacific</strong>’s <strong>2010</strong> freight revenue. Finished vehicles accounted for<br />
77 percent of this revenue, with 23 percent coming from the<br />
movement of automotive parts and materials.<br />
Automotive<br />
Materials<br />
41%<br />
Assembled<br />
Autos<br />
59%<br />
International - 12%<br />
Domestic - 36%<br />
Mexico - 52%<br />
An improving economy led to stronger demand in <strong>2010</strong>,<br />
driving increased vehicle sales and production. New light<br />
vehicle sales in the U.S. increased to 11.5 million vehicles in<br />
<strong>2010</strong>, up 11 percent from relatively weak 2009 levels. North<br />
American light vehicle production improved 39 percent for the<br />
year, to 11.9 million units. Volume growth, core pricing gains<br />
and fuel surcharges drove a 49 percent improvement in <strong>Union</strong><br />
<strong>Pacific</strong>’s automotive freight revenue. Revenue from finished<br />
vehicle shipments climbed 54 percent, as carloads rose nearly<br />
37 percent. Revenue from auto parts and materials grew 33<br />
percent, with volumes up 24 percent.<br />
In each of the past four years, <strong>Union</strong> <strong>Pacific</strong>’s automotive traffic<br />
represented more than 75 percent of the total western U.S.<br />
automotive carload business. Going forward, finished vehicle<br />
Automotive Line Density Map<br />
shipments likely will reflect changing dynamics among industry<br />
manufacturers as they work to keep or gain market share.<br />
Market share for the Detroit Three remained constant from<br />
2009, at approximately 45 percent of new light vehicle sales<br />
in the U.S. Other manufacturers have domestic manufacturing<br />
capabilities and import a significant number of vehicles via<br />
West Coast and Gulf ports. <strong>Union</strong> <strong>Pacific</strong> faces competition<br />
from trucks for the finished vehicles imported through the West<br />
Coast ports and destined to U.S. and Canadian automotive<br />
dealerships.<br />
In <strong>2010</strong>, approximately 52 percent of UP’s automotive<br />
shipments moved to or from Mexico, including finished vehicles<br />
as well as parts and materials moving in intermodal or boxcar/<br />
flatcar service. Consistent with the overall automotive industry<br />
improvement, Mexico parts and materials shipments increased<br />
43 percent and finished vehicle moves grew 41 percent.<br />
Supported by a more than 20 percent service improvement over<br />
the past five years, UP moves 100 percent of Mexico intermodal<br />
automotive production parts.<br />
2011 Market Drivers<br />
Among <strong>Union</strong> <strong>Pacific</strong>’s six business teams, Automotive will<br />
likely experience the most significant impact from the disaster<br />
in Japan. Although the extent to which this disaster will affect<br />
the automotive industry and its supply chain remains uncertain,<br />
it is anticipated that most of the impact should be limited to the<br />
second quarter. However, further improvement in economic<br />
Lane density based on carloadings. Line thickness depicts traffic density.<br />
19
Automotive<br />
conditions should generate a 12 percent increase in U.S. light<br />
vehicle sales and a 9 percent increase in North American light<br />
vehicle production for 2011. Traffic to and from Mexico is also<br />
expected to improve, driven by the global economic recovery<br />
as well as additional production capacity in Mexico. <strong>Union</strong><br />
<strong>Pacific</strong> serves a broad customer base that includes import and<br />
transplant manufacturers. This diverse business mix helps<br />
the Company mitigate the effects of production and consumer<br />
preference changes in the automotive industry.<br />
<strong>Union</strong> <strong>Pacific</strong> expects to begin production of the AutoFlex© rail<br />
car in the middle of 2011. The AutoFlex©, designed by <strong>Union</strong><br />
<strong>Pacific</strong>, is a convertible multi-level rail car that can be adjusted<br />
to accommodate bi-level (large vehicles) or tri-level (small<br />
vehicles) transport with the same rack structure. The AutoFlex©<br />
improves safety, service and security, and demonstrates UP’s<br />
leadership in and commitment to the automotive industry.<br />
<strong>Union</strong> <strong>Pacific</strong>’s ability to address market changes is critical<br />
to maintaining superior customer service. UP is preparing to<br />
handle electric vehicle shipments by installing charging stations<br />
at most auto ramps in 2011. The AutoFlex© car and innovative<br />
facility planning will help manage the potential impact of the<br />
Corporate Average Fuel Economy standards on the automotive<br />
industry. Implementation of these standards is scheduled for<br />
2016, and could potentially create production shifts between<br />
cars and trucks as well as expand the electric and micro vehicle<br />
markets.<br />
Growth opportunities exist with the Railroad subsidiaries: Insight<br />
Network Logistics (INL), ShipCarsNow (SCN) and <strong>Union</strong> <strong>Pacific</strong><br />
Distribution Services (UPDS). These companies offer supply<br />
chain logistic services for major automotive manufacturers.<br />
SCN is making inroads into the used car remarketing area by<br />
providing management and coordination services for vehicle<br />
auction companies and rental car firms both domestically and<br />
internationally. Marketed jointly with UP’s rail services, these<br />
subsidiaries can assist manufacturers in meeting customers’<br />
changing inventory needs and provide continued growth<br />
opportunities. Extending UP’s reach beyond the Railroad’s<br />
physical boundaries to customers that are not rail-served<br />
promotes vertical integration and new market development.<br />
Linda Brandl,<br />
VP & GM Automotive<br />
How is your business group positioned to generate<br />
“economy plus” volume growth between 2011 and 2015?<br />
The Automotive team is taking an increasingly proactive approach<br />
to anticipating customer needs by developing and delivering<br />
innovative products. Extending our vehicle and parts networks<br />
creates opportunities for vertical integration in a customer’s supply<br />
chains. Examples include vehicle visibility tools offered through<br />
partnerships with our subsidiaries; Shipment Vision with UPDS<br />
and VinVision with INL. Opportunities exist to capitalize on UP’s<br />
co-load capability by providing online quotes for both domestic and<br />
international automotive shipping. In addition, co-load capability<br />
can be leveraged through collaboration with SCN and vehicle<br />
manufacturers to expand our reach into the used car market. UP<br />
is also preparing to handle electric vehicles by installing charging<br />
stations at automotive facilities across our network in 2011.<br />
Making the appropriate capital investments in facilities, track<br />
infrastructure and the multi-level fleet is key to efficiently handling<br />
anticipated volume growth. In addition, we are focusing on further<br />
development of UP’s capacity at West Coast port locations to<br />
facilitate growth from our existing customer base and support new<br />
vehicle production from China and India.<br />
Global production trends have the potential to alter transportation<br />
flows, due primarily to increased production in China, Mexico<br />
and Europe. The Company has an established sales office in<br />
Shanghai, China to further cultivate relationships with Chinese<br />
automotive original equipment manufacturers and suppliers in<br />
anticipation of increasing import parts and vehicle volume. The<br />
Railroad is also focusing on Europe to support those potential<br />
international opportunities. UP’s focus on developing early ties<br />
with the industry beyond the U.S. should help us deliver better<br />
service to our customers.<br />
In addition, strategic infrastructure improvements across the<br />
network enhance current operations and ensure the Company<br />
efficiently handles profitable traffic as volumes continue to return.<br />
Improvements that support the automotive business in California,<br />
Texas and the Chicago area create operational efficiencies<br />
and position UP for future growth opportunities. For example,<br />
the acquisition of property at Fremont, CA in <strong>2010</strong> provides the<br />
Railroad with a potential automotive ramp location to support<br />
future growth. This location could also serve as a processing<br />
center for import volumes in the Northern California market.<br />
20
Automotive Facilities and Assembly Centers<br />
Annual Summary by Quarter - Automotive<br />
<strong>2010</strong> 2009 2008<br />
1st 2nd 3rd 4th Total 1st 2nd 3rd 4th Total 1st 2nd 3rd 4th Total<br />
Freight Revenue (millions of dollars)<br />
305 334 309 323 1,271 162 163 227 302 854 363 352 324 305 1,344<br />
Revenue Ton-Miles (millions)<br />
3,186 3,271 2,984 3,101 12,542 1,952 1,995 2,619 3,174 9,740 3,890 3,646 3,278 3,169 13,983<br />
Revenue Carloads (thousands)<br />
151 159 146 155 611 97 93 124 151 465 188 176 153 150 667<br />
Average Revenue Per Car (dollars)<br />
2,022 2,094 2,114 2,100 2,082 1,675 1,755 1,827 2,004 1,838 1,930 2,005 2,114 2,040 2,017<br />
21
Chemicals<br />
Transporting chemicals generated 15 percent of <strong>Union</strong> <strong>Pacific</strong>’s<br />
freight revenue in <strong>2010</strong>. The Railroad’s unique franchise<br />
serves the chemical producing areas along the Gulf Coast,<br />
where roughly two-thirds of the Company’s chemical business<br />
originates, terminates or travels. UP’s chemical franchise also<br />
accesses chemical producers in the Rocky Mountains and on<br />
the West Coast. The Company’s chemical shipments can be<br />
classified into three broad categories: Petrochemicals, Fertilizer<br />
and Soda Ash.<br />
Petrochemicals constitutes 67 percent of UP’s chemical<br />
business and includes industrial chemicals, plastics, petroleum<br />
products and liquid petroleum gases. These products move<br />
primarily to and from the Gulf Coast region. Barges, pipelines,<br />
and to a lesser extent trucks, provide transportation alternatives<br />
for some of these commodities.<br />
The industrial chemicals market consists of several dozen<br />
segments of basic, intermediate and specialty chemicals<br />
produced by, and shipped to, both large and small customers.<br />
Strong demand from industrial manufacturers drives this<br />
market. Plastics shipments support the automotive, housing,<br />
and durable and disposable consumer goods markets. UP is an<br />
important link in the plastics supply chain through its ownership<br />
and operation of storage-in-transit (SIT) facilities. Plastics<br />
customers utilize railroad SIT yards for intermediate storage of<br />
plastic resins, and UP’s SIT capacity is more than double that of<br />
any other railroad.<br />
Strengthening industrial production, availability of low cost<br />
natural gas feedstock and a return to more normal inventory<br />
Chemicals Line Density Map<br />
Petroleum<br />
& Other<br />
17%<br />
Soda<br />
Ash<br />
13%<br />
Fertilizer<br />
20%<br />
Plastics<br />
25%<br />
Industrial<br />
Chemicals<br />
25%<br />
<strong>2010</strong> Carloads<br />
Mexico - 5%<br />
International - 23%<br />
Domestic - 72%<br />
levels helped spur an 8 percent growth in UP’s petrochemical<br />
business in <strong>2010</strong>. New shipments of crude oil destined to<br />
blending facilities at St James, LA also contributed to the<br />
increase. Volume growth combined with higher average<br />
revenue per car to push revenue up 16 percent year-over-year.<br />
Average revenue per car increased 7 percent, driven by product<br />
mix changes, price improvements and higher fuel surcharges.<br />
Fertilizer movements originate in the Gulf Coast region, the<br />
western part of the U.S. and Canada for delivery to major<br />
agricultural users in the Midwest, western U.S. and abroad.<br />
The combination of fertilizer and other related materials<br />
(phosphate rock and sulfur) represented 20 percent of the<br />
Railroad’s chemical business in <strong>2010</strong>. Reduced inventories,<br />
strong global demand related to delayed 2009 purchases,<br />
and higher commodity prices drove a 20 percent increase in<br />
shipments. Average revenue per car declined 3 percent as price<br />
improvements and increased fuel surcharges were mitigated by<br />
product mix changes, notably growth in unit train shipments of<br />
potash for export.<br />
Soda ash accounted for 13 percent of UP’s chemical business<br />
in <strong>2010</strong>. This product originates in southwestern Wyoming<br />
and California, destined for chemical and glass producing<br />
markets in North America and abroad. UP directly serves the<br />
world’s largest natural soda ash reserve and production region<br />
at Green River, Wyoming. During <strong>2010</strong>, soda ash revenue<br />
increased 13 percent, driven by a 12 percent increase in<br />
volume and higher fuel surcharges. Volume growth resulted<br />
from stronger exports related to the price competitiveness<br />
of U.S. producers and increased global demand. Domestic<br />
demand remained relatively flat year-over-year.<br />
Lane density based on carloadings. Line thickness depicts traffic density.<br />
22
Chemicals<br />
2011 Market Drivers<br />
Global demand for chemicals is expected to be stronger in 2011<br />
than the prior two years, as a result of an improving worldwide<br />
economy and robust growth projections for developing countries<br />
such as China, India and Brazil. The availability of low cost<br />
natural gas feedstock and efficiencies gained from industry<br />
restructuring are strengthening the competitive position of North<br />
American chemical production. Strength in segments of the<br />
U.S. economy such as automotive and consumer products is<br />
expected to have a significant impact on the overall demand for<br />
soda ash, plastics and industrial chemical products.<br />
Shipments of crude oil from the Bakken formation in North<br />
Dakota to terminal facilities in St James, LA move primarily<br />
in unit trains. This business is expected to total over 16,000<br />
carloads in 2011, more than triple the <strong>2010</strong> level. Increasing<br />
crude oil prices coupled with an efficient rail-based supply chain<br />
support ongoing viability of this business. Additionally, market<br />
development of crude oil reserves in both the Niobrara region of<br />
Wyoming and Colorado, and the Eagle Ford shale formation in<br />
South Texas is expected to contribute to the growth.<br />
Diane Duren,<br />
VP & GM Chemicals<br />
How is your business group positioned to generate<br />
“economy plus” volume growth between 2011 and 2015?<br />
The strength of <strong>Union</strong> <strong>Pacific</strong>’s chemical franchise is created<br />
by our ability to efficiently serve a diverse product base across<br />
our network. We are well-positioned to capitalize on market<br />
opportunities brought about by global economic expansion and<br />
a changing business environment. Whether serving domestic<br />
or export markets, our strategy for achieving business growth<br />
remains the same – build strong partnerships with customers by<br />
providing consistent, reliable service, and support their long-term<br />
global competitiveness through supply chain efficiencies. We<br />
expect U.S. chemical production to remain competitive in the<br />
global marketplace due to an abundant supply of low cost natural<br />
gas and other raw materials, such as soda ash and potash.<br />
Investments in <strong>Union</strong> <strong>Pacific</strong>’s chemical franchise and a continued<br />
focus on service excellence and innovation position the Company<br />
to capitalize on existing business opportunities and address the<br />
needs of emerging markets.<br />
Fertilizer demand is expected to remain strong in 2011, due to<br />
increasing prices for commodities and tight supply.<br />
Annual Summary by Quarter - Chemicals<br />
<strong>2010</strong> 2009 2008<br />
1st 2nd 3rd 4th Total 1st 2nd 3rd 4th Total 1st 2nd 3rd 4th Total<br />
Freight Revenue (millions of dollars)<br />
587 592 629 617 2,425 513 499 551 539 2,102 603 654 659 578 2,494<br />
Revenue Ton-Miles (millions)<br />
13,333 13,325 13,956 13,619 54,233 11,999 11,481 12,544 12,031 48,055 13,939 14,559 13,668 12,641 54,807<br />
Revenue Carloads (thousands)<br />
203 209 221 211 844 180 188 202 191 761 225 241 224 195 885<br />
Average Revenue Per Car (dollars)<br />
2,893 2,826 2,858 2,923 2,874 2,843 2,659 2,730 2,815 2,761 2,676 2,714 2,951 2,957 2,818<br />
23
Energy<br />
For the fourth consecutive year, coal and petroleum coke<br />
transportation accounted for the largest share of <strong>Union</strong> <strong>Pacific</strong>’s<br />
freight revenue, representing 22 percent in <strong>2010</strong>. The Railroad’s<br />
network supports the transportation of coal and petroleum coke<br />
to utilities and industrial facilities throughout the U.S. Through<br />
interchange gateways and ports, UP’s reach extends to eastern<br />
U.S. utilities, Mexico, Europe and Asia. Water terminals allow<br />
the Railroad to move western U.S. coal east via the Mississippi<br />
and Ohio Rivers, as well as the Great Lakes. Export coal moves<br />
through West Coast ports to Asia and through Mississippi River<br />
terminals to Europe.<br />
Colorado/<br />
Utah<br />
13%<br />
Other<br />
12%<br />
Southern<br />
Powder River<br />
Basin<br />
75%<br />
<strong>2010</strong> Carloads<br />
Industrial - 5%<br />
West - 8%<br />
East - 18%<br />
North - 29%<br />
South - 40%<br />
Coal traffic originating in the Southern Powder River Basin<br />
(SPRB) area of Wyoming is the largest segment of UP’s energy<br />
business, comprising 75 percent in <strong>2010</strong>. This reliable, lowcost,<br />
low-sulfur coal is attractive to utilities in the competitive<br />
electricity generation market. Coal produced in the Uinta Basin<br />
region of Colorado and Utah is the second largest source of<br />
UP coal volume, representing 13 percent in <strong>2010</strong>. This mostly<br />
sub-surface coal is relatively high in BTUs (British Thermal<br />
Unit) and is low in sulfur content. The remaining energy traffic<br />
consists of petroleum coke from oil refineries, coal shipments<br />
from southern Wyoming’s Hanna Basin and mines in southern<br />
Illinois, and coal forwarded to UP from other carriers.<br />
A recovering economy and the fourth hottest summer on record<br />
helped drive total coal volumes up 2 percent in <strong>2010</strong>. Stronger<br />
coal demand and more efficient deliveries reduced utilities’<br />
average coal inventories by 14 days (19 percent) to near normal<br />
Energy Line Density Map<br />
levels, and drove SPRB carloads up 60,000 units. Volume also<br />
increased as a result of a Midwestern utility’s decision to use<br />
<strong>Union</strong> <strong>Pacific</strong> as the single line carrier, whereas UP previously<br />
did not originate the move.<br />
SPRB train size reached a new record in <strong>2010</strong>, with tons<br />
per train increasing to 15,736. A record 132.5 cars per train,<br />
combined with an all-time high 118.8 tons per car, drove the<br />
increase. Operational improvements at North Platte, including<br />
the in-train wheel repair process and continued emphasis<br />
on maintaining inbound train length, enabled the Railroad to<br />
achieve these results.<br />
Colorado and Utah shipments decreased 8 percent year-overyear.<br />
Delays associated with equipment relocations impacted<br />
mine production. Despite the improving economy, the Uinta<br />
Basin coal struggled to compete with other low cost fuel options<br />
(eastern coal and natural gas). Lower industrial and utility<br />
demand also negatively affected volumes. Train size declined<br />
slightly to 11,046 tons per train, as a dip in train length to 98.7<br />
cars per train offset record tons per car of 112.0.<br />
Petroleum coke is a residual of the oil refining process. It is a<br />
source of high sulfur fuel for electricity generation and is used<br />
by industrial customers in the production of aluminum, steel<br />
and cement. This traffic originates mainly on the Gulf Coast,<br />
as well as in Oklahoma, Kansas, Wyoming and California. The<br />
primary destination is Texas; however, shipments also move to<br />
Lane density based on carloadings. Line thickness depicts traffic density.<br />
24
Energy<br />
the Midwest, California and Louisiana. In <strong>2010</strong>, the recovering<br />
economy created modest demand growth, driving petroleum<br />
coke shipments up 4 percent year-over-year.<br />
The remaining energy traffic declined 1 percent in <strong>2010</strong> as a<br />
result of several factors. A Midwestern utility’s SPRB traffic<br />
previously received from another carrier was converted to a<br />
UP-originating move. In addition, Hanna Basin traffic declined<br />
10 percent as Colorado and Utah coal availability improved,<br />
reducing the need for substitute coal from Hanna mines. Growth<br />
in coal loadings from Southern Illinois as well as increased<br />
volume of Central Appalachian coal received at Chicago<br />
partially offset the declines.<br />
2011 Market Drivers<br />
Several factors are expected to contribute to growth of<br />
SPRB volumes, including nine million tons of new business<br />
to Wisconsin customers, a new unit at a Texas utility that<br />
began receiving coal in May of <strong>2010</strong> and a new utility in Texas<br />
scheduled to open mid-year 2011. Colorado and Utah carloads<br />
should also increase, with one Colorado mine anticipating the<br />
completion of its equipment relocation to new reserves and<br />
resumption of full production in the second quarter. Additional<br />
traffic out of a Wyoming refinery should drive higher petroleum<br />
coke volume, and more eastern coal received at Chicago<br />
for delivery to a Wisconsin utility should boost the remaining<br />
energy traffic.<br />
SPRB Coal Tonnage<br />
(In Millions)<br />
204.6<br />
Doug Glass,<br />
VP & GM Energy<br />
How is your business group positioned to generate<br />
“economy plus” volume growth between 2011 and 2015?<br />
The coal industry likely will face regulatory and associated cost<br />
challenges in the years ahead. The EPA issued its draft rules in<br />
March of this year, but there is still much uncertainty surrounding<br />
the new emissions regulations. Potential costs of adhering<br />
to such regulations can impact a utility’s decisions regarding<br />
the replacement of older coal-fired units. Whereas older units<br />
were typically replaced with new, more efficient coal-fired units,<br />
alternative fuel sources, such as natural gas, could receive<br />
additional consideration due to more stringent regulations.<br />
While the challenges are real, <strong>Union</strong> <strong>Pacific</strong> continues to<br />
improve service, provide value to customers and develop new<br />
opportunities for coal transportation. We are working with utilities<br />
that have new facilities under construction and are assisting<br />
in the development of new, cutting-edge, low carbon emission<br />
power plants. In addition, we are actively engaged with western<br />
U.S. mine operators to extend the reach of western bituminous<br />
coal to locations in Mexico, Asia, Europe and South America.<br />
Expansion of existing West Coast, Mississippi River and Gulf port<br />
operations is critical to ensure available capacity for future growth<br />
opportunities. UP shipped 1.5 million tons of export coal in <strong>2010</strong>,<br />
and we believe that several million tons is a real possibility over<br />
the next five years.<br />
New facilities should come online between 2011 and 2015 in<br />
Arkansas, Missouri, Texas and Wisconsin, generating more than<br />
20 million incremental tons. A utility plans to break ground on a<br />
new coal-fired plant in western Texas during the fourth quarter<br />
of 2011, with completion scheduled for 2014. The plant will<br />
utilize carbon capture and sequestration technology, allowing<br />
it to capture more than 90 percent of CO2 emissions for use in<br />
secondary oil recovery or sequestration in safe, underground<br />
caverns.<br />
As these developments unfold, we will continue to focus on<br />
meeting and exceeding customer expectations through improving<br />
service, ongoing productivity initiatives and expanded use of<br />
technology.<br />
194.0<br />
194.8<br />
179.0<br />
176.9<br />
184.5<br />
2005 2006 2007 2008<br />
2009 <strong>2010</strong><br />
25
New Coal-Fired Units<br />
Annual Summary by Quarter - Energy<br />
<strong>2010</strong> 2009 2008<br />
1st 2nd 3rd 4th Total 1st 2nd 3rd 4th Total 1st 2nd 3rd 4th Total<br />
Freight Revenue (millions of dollars)<br />
844 836 922 887 3,489 807 715 831 765 3,118 857 919 1,051 983 3,810<br />
Revenue Ton-Miles (millions)<br />
55,578 53,437 59,331 57,237 225,583 56,003 50,740 57,391 54,093 218,227 63,334 61,748 67,887 65,393 258,362<br />
Revenue Carloads (thousands)<br />
516 486 535 519 2,056 521 470 531 499 2,021 582 561 615 590 2,348<br />
Average Revenue Per Car (dollars)<br />
1,636 1,722 1,721 1,709 1,697 1,550 1,520 1,564 1,536 1,543 1,473 1,639 1,709 1,664 1,622<br />
26
Industrial Products<br />
<strong>Union</strong> <strong>Pacific</strong>’s extensive network facilitates the movement<br />
of numerous commodities between thousands of origin and<br />
destination points throughout North America. The Industrial<br />
Products group consists of several product categories, including<br />
construction products, metals, minerals, paper, consumer<br />
goods, lumber and other miscellaneous products. In <strong>2010</strong>,<br />
this group generated 16 percent of <strong>Union</strong> <strong>Pacific</strong>’s total freight<br />
revenue.<br />
Commercial and highway construction drives shipments of<br />
steel and construction products, consisting of rock, cement<br />
and roofing materials. Industrial manufacturing plants receive<br />
nonferrous metals and industrial minerals. Paper and consumer<br />
goods, including furniture and appliances, move to major<br />
metropolitan areas for consumers. Lumber shipments originate<br />
primarily in the PNW and Canada and move throughout<br />
the U.S. for use in new home construction and repair and<br />
remodeling. In addition, the Railroad provides safe and efficient<br />
transportation for government entities and waste companies.<br />
Macro-economic factors such as industrial production and<br />
housing starts drive demand for the Industrial Products group.<br />
In <strong>2010</strong>, U.S. industrial production grew 5.3 percent and<br />
housing starts rose 7 percent, contributing to a 19 percent<br />
increase in carloads. Core pricing improvement and higher fuel<br />
surcharges drove average revenue per car up 3 percent versus<br />
2009. Total freight revenue climbed 23 percent in <strong>2010</strong> due to<br />
higher volume and average revenue per car.<br />
Industrial Products Line Density Map<br />
Lumber<br />
8%<br />
Paper<br />
10%<br />
Other<br />
15%<br />
Construction<br />
32%<br />
Minerals/<br />
Consumer<br />
16%<br />
<strong>2010</strong> Carloads<br />
Metals<br />
19%<br />
Mexico - 8%<br />
International - 14%<br />
Domestic - 78%<br />
Home buyer tax incentives offered during the first half of<br />
<strong>2010</strong> drove the increase in housing starts. As a result, lumber<br />
carloads grew 6 percent and revenue rose 12 percent yearover-year.<br />
Growth in oil and natural gas drilling activity contributed to<br />
volume and revenue increases across several Industrial<br />
Products categories. Expanded road construction to access<br />
drilling sites drove greater demand for stone, sand and gravel,<br />
which more than offset weakness in commercial construction<br />
activity. As a result, volume increased 15 percent and revenue<br />
rose 15 percent. Increased demand for drilling pipe, as well as<br />
overall improving economic conditions, resulted in steel and<br />
scrap steel carloads growing 46 percent and revenue jumping<br />
56 percent. In addition, the use of frac sand, bentonite and<br />
barites in the drilling process gave a boost to minerals, pushing<br />
volume up 38 percent and revenue up 49 percent.<br />
The ongoing federal government remediation program involving<br />
removal of uranium mill tailings from a site near Moab, Utah<br />
drove a 132 percent increase in hazardous waste shipments<br />
for <strong>2010</strong>. However, this short-haul business earns a very<br />
low average revenue per car, and revenue for this category<br />
increased only 21 percent over 2009.<br />
Lane density based on carloadings. Line thickness depicts traffic density.<br />
27
Industrial Products<br />
2011 Market Drivers<br />
As economic conditions improve, demand for products such<br />
as lumber, rock, cement, steel and minerals should increase.<br />
Current projections call for housing starts to increase 5 percent<br />
and industrial production to grow 5.5 percent year-over-year.<br />
Domestic drilling activity, which drives demand for frac sand and<br />
contributes to growth in steel shipments and rock, also should<br />
improve. An indicator of greater demand is the 20 percent yearover-year<br />
increase in the number of land-based drilling rigs in<br />
the U.S. at the end of <strong>2010</strong>.<br />
With the expiration of government funding in 2011 associated<br />
with the movement of uranium mill tailings, volumes for this<br />
business will likely decline versus <strong>2010</strong>.<br />
Eric Butler,<br />
VP & GM Industrial Products<br />
How is your business group positioned to generate<br />
“economy plus” volume growth between 2011 and 2015?<br />
The economic recession significantly reduced Industrial Products<br />
volumes. Compared to the peak year, lumber and panel carloads<br />
in <strong>2010</strong> were down approximately 60 percent and construction<br />
products volumes were off 25 percent. While these depressed<br />
volume levels are evidence of a challenging environment, they<br />
also indicate significant opportunities.<br />
Annual housing starts in <strong>2010</strong> of approximately 0.6 million are<br />
much lower than historically sustainable levels of around 1.5 - 1.7<br />
million. Current estimates show housing starts growing at a 24<br />
percent compound annual growth rate over the next 5 years. In<br />
addition, considerable upside exists for the stone, cement, rebar<br />
and structural steel markets as we return to normal levels of<br />
activity for highway, commercial and residential construction.<br />
Much of our recent growth is due to domestic oil and natural gas<br />
drilling activity, which generates growth in frac sand, barites,<br />
pipe products and stone. We expect this trend to continue with<br />
the development of new shale operations, including Eagle Ford<br />
and Niobrara. The increasing number of drilling rigs provides<br />
substantial growth opportunities, especially when considering that<br />
a well can require more than 100 carloads of frac sand.<br />
Finally, our business development efforts should continue to bring<br />
new business to the Railroad. Through improved global supply<br />
chain solutions, flexibility and agility in emerging markets, and new<br />
relationships, new markets and new services, we expect to drive<br />
growth across all commodity areas.<br />
Annual Summary by Quarter - Industrial Products<br />
<strong>2010</strong> 2009 2008<br />
1st 2nd 3rd 4th Total 1st 2nd 3rd 4th Total 1st 2nd 3rd 4th Total<br />
Freight Revenue (millions of dollars)<br />
598 692 697 652 2,639 546 531 557 513 2,147 773 877 906 717 3,273<br />
Revenue Ton-Miles (millions)<br />
13,863 15,957 15,687 14,840 60,347 13,123 12,842 13,479 12,429 51,873 17,507 19,138 18,648 15,421 70,714<br />
Revenue Carloads (thousands)<br />
242 286 282 263 1,073 222 229 235 213 899 304 346 329 270 1,249<br />
Average Revenue Per Car (dollars)<br />
2,474 2,420 2,470 2,483 2,461 2,459 2,319 2,367 2,412 2,388 2,540 2,537 2,747 2,662 2,620<br />
28
Intermodal<br />
<strong>Union</strong> <strong>Pacific</strong>’s Intermodal business is divided into two shipment<br />
categories: international and domestic. International business<br />
consists of imported and exported container traffic that mainly<br />
passes through West Coast ports served by UP’s extensive<br />
terminal network. Domestic business includes container and<br />
trailer traffic picked up and delivered within North America for<br />
intermodal marketing companies (primarily shipper agents and<br />
logistics companies), as well as truckload carriers. Less-thantruckload<br />
and package carriers with time-sensitive business<br />
requirements are also an important part of domestic shipments.<br />
Together, international and domestic business generated 20<br />
percent of UP’s <strong>2010</strong> freight revenue.<br />
Domestic<br />
44%<br />
<strong>2010</strong> Units<br />
International<br />
56%<br />
International traffic moves in 20, 40 or 45 foot shipping<br />
containers through ports on the West Coast. The majority of<br />
domestic shipments move in 48 or 53 foot containers or trailers<br />
to and from points within the U.S., Canada and Mexico.<br />
<strong>Union</strong> <strong>Pacific</strong>’s network includes several key intermodal lanes.<br />
The Railroad’s east/west lanes run between the West Coast<br />
and Chicago, Texas and interchange connections to the eastern<br />
U.S. The north/south intermodal lanes operate between Los<br />
Angeles and the <strong>Pacific</strong> Northwest, as well as Chicago and<br />
the upper Midwest and locations south in Texas and Mexico.<br />
UP also directly accesses all six Mexican gateways and<br />
serves most of the major metropolitan areas in the western<br />
two-thirds of the U.S. Virtually all routes are competitive with<br />
other railroads and are comparable to shipping distances on<br />
highways.<br />
Intermodal Line Density Map<br />
Total intermodal volumes increased 19 percent year-over-year<br />
due to the recovering economy and service-driven growth<br />
from truckload conversions. Strong volumes, higher fuel<br />
surcharges and pricing gains resulted in a 30 percent increase<br />
in total revenue. International revenue grew 25 percent, as<br />
strong imports drove a 20 percent volume increase. Domestic<br />
intermodal revenue jumped 35 percent on an 18 percent<br />
increase in volume, driven by continued truckload conversions,<br />
transloading growth and the conversion of traffic from Hub<br />
Group.<br />
2011 Market Drivers<br />
Prospects for a sustained recovery in 2011 are hopeful.<br />
International volumes are expected to improve year-over-year,<br />
driven by growth in import traffic. Domestic traffic also should<br />
increase, as UP’s value proposition and competitive service<br />
drive more shippers to convert traffic from truck to intermodal<br />
rail. In addition, continued pricing opportunities are anticipated<br />
in both markets.<br />
<strong>Union</strong> <strong>Pacific</strong> offers consistent, reliable service for domestic<br />
intermodal customers. New truck-competitive services began in<br />
several lanes during <strong>2010</strong>, which are expected to yield volume<br />
growth as customers convert from truck to rail. To support<br />
current volumes and provide for future growth, UP continues<br />
to invest in its intermodal network and equipment. Domestic<br />
container capacity is a key component of this investment. In<br />
<strong>2010</strong>, UP acquired 9,200 containers and nearly 3,000 chassis<br />
Lane density based on carloadings. Line thickness depicts traffic density.<br />
29
Intermodal<br />
to meet growing demand in the domestic intermodal market,<br />
with the acquisition of an additional 4,800 containers and 4,800<br />
chassis planned for 2011.<br />
John Kaiser,<br />
VP & GM Intermodal<br />
How is your business group positioned to generate<br />
“economy plus” volume growth between 2011 and 2015?<br />
<strong>Union</strong> <strong>Pacific</strong>’s Intermodal group is committed to delivering<br />
best-ever service that is responsive, consistent and reliable. Our<br />
comprehensive network provides international customers superior<br />
market coverage and the best value for access to most major U.S.<br />
population centers. Investments in our intermodal network should<br />
favorably position <strong>Union</strong> <strong>Pacific</strong> to capture “economy plus” growth<br />
in the years ahead. Our new Joliet, IL intermodal terminal, which<br />
opened in the third quarter of <strong>2010</strong>, helps enable UP to efficiently<br />
handle current volumes as well as expected future growth. For<br />
our domestic customers, <strong>Union</strong> <strong>Pacific</strong> continues to add and<br />
expand service offerings that provide reliable, truck-competitive<br />
and environmentally friendly service. This improved service should<br />
accommodate additional growth through truckload conversions,<br />
as anticipated driver shortages and increased operating costs<br />
constrain truck capacity. To remain competitive, shippers seek<br />
to reduce costs, and converting from truck to intermodal helps<br />
accomplish this objective.<br />
Our service has never been better. In <strong>2010</strong>, we created and<br />
improved service in 86 lanes. We enhanced train schedules to<br />
reduce transit times from 2009 levels, and provided new truckcompetitive<br />
services between Los Angeles and Chicago, the<br />
Northeast, the Ohio Valley and El Paso, as well as between the<br />
PNW and Chicago. As demonstrated by record satisfaction levels,<br />
our customers are pleased with what we have accomplished. With<br />
the tremendous opportunities for growth, train productivity and<br />
price improvement ahead, there should certainly be more to come.<br />
Joliet Intermodal Terminal<br />
30
Intermodal Terminals and Traffic Flows<br />
Annual Summary by Quarter - Intermodal<br />
<strong>2010</strong> 2009 2008<br />
1st 2nd 3rd 4th Total 1st 2nd 3rd 4th Total 1st 2nd 3rd 4th Total<br />
Freight Revenue (millions of dollars)<br />
691 804 880 852 3,227 551 595 656 684 2,486 707 769 842 705 3,023<br />
Revenue Ton-Miles (millions)<br />
18,791 20,177 20,489 20,001 79,458 15,276 17,322 18,411 19,077 70,086 19,552 19,737 19,875 17,014 76,178<br />
Revenue Carloads (thousands)<br />
742 827 903 841 3,313 615 669 728 763 2,775 796 811 834 724 3,165<br />
Average Revenue Per Car (dollars)<br />
930 974 974 1,012 974 897 889 901 896 896 889 947 1,010 974 955<br />
31
Mexico<br />
<strong>Union</strong> <strong>Pacific</strong> provides customers the most efficient rail route<br />
between markets in Mexico, the U.S. and Canada. The<br />
Railroad’s unique franchise serves all six major gateways to<br />
Mexico, connecting directly to the two largest Mexican railroads.<br />
In <strong>2010</strong>, approximately 54 percent of UP shipments to and from<br />
Mexico interchanged with Ferrocarril Mexicano (Ferromex or<br />
FXE). The remaining 46 percent interchanged with Kansas City<br />
Southern de Mexico (KCSM). <strong>Union</strong> <strong>Pacific</strong> retains a 26 percent<br />
ownership interest in Ferromex.<br />
Cooperation with FXE and KCSM allows UP to capture<br />
opportunities created by the North American Free Trade<br />
Agreement (NAFTA) and by Mexico’s competitive position in<br />
today’s global economic landscape. The Railroad also works<br />
with Ferrocarril del Sureste (Ferrosur or FSRR) and other<br />
smaller railroads to explore new businesses. The Mexican<br />
railroads continue investing in equipment, facilities and track to<br />
improve service and performance, which should yield market<br />
share gains from trucks and create new business opportunities.<br />
In addition, <strong>Union</strong> <strong>Pacific</strong>’s sales and marketing presence in<br />
Mexico enables direct communication with Mexican customers<br />
and shippers.<br />
Traffic to and from Mexico includes a diversified mix of<br />
commodities within each of <strong>Union</strong> <strong>Pacific</strong>’s six business teams.<br />
Approximately 57 percent of UP’s Mexico traffic consists of<br />
southbound shipments. Corn, dry feed ingredients, autos and<br />
auto parts, intermodal, meals and oils, steel, plastics, minerals,<br />
coal, soda ash, wheat and newsprint shipments make up<br />
Mexico Line Density Map<br />
Agricultural<br />
16%<br />
<strong>2010</strong> Carloads<br />
Chemicals<br />
6% Energy<br />
1%<br />
Industrial<br />
Products<br />
11%<br />
Intermodal<br />
24%<br />
Automotive<br />
42%<br />
about 80 percent of southbound revenue, with the remainder<br />
spread across the Company’s six business teams. Northbound<br />
shipments grew during the past five years with increased<br />
Mexican manufacturing, and now comprise nearly 45 percent<br />
of revenue from Mexico operations. Autos and auto parts, beer<br />
and food products, steel products and manufactured goods<br />
represent almost 85 percent of northbound revenue.<br />
The recovering economy drove an increase in volume and<br />
revenue for all six business teams in <strong>2010</strong>. Mexico shipments<br />
increased 25 percent and revenue grew 30 percent to $1.6<br />
billion. The Energy group reported 15 percent revenue growth<br />
and 9 percent volume growth. Agricultural revenue increased 11<br />
percent and volume increased 9 percent. Food and beverage<br />
revenue increased 16 percent with volume growing 8 percent,<br />
and corn and feed grains revenue increased 20 percent on<br />
20 percent volume growth. Revenue for Industrial Products<br />
increased 29 percent, as steel volumes climbed 54 percent.<br />
Automotive represents the largest share of Mexico revenue and<br />
volume. Lower traffic levels due to economic conditions in 2009,<br />
additional Mexico production capacity and market share gains<br />
in auto parts moving in intermodal containers drove revenue<br />
up 63 percent and volumes up 42 percent. Revenue from<br />
chemicals rose 18 percent, primarily from soda ash, petroleum<br />
products and plastics, and volume increased 12 percent.<br />
Intermodal revenue increased 25 percent with volume up 18<br />
percent.<br />
Lane density based on carloadings. Line thickness depicts traffic density.<br />
32
Mexico<br />
2011 Market Drivers<br />
<strong>Union</strong> <strong>Pacific</strong> expects Mexico traffic growth to continue in 2011,<br />
but at more moderate levels versus <strong>2010</strong>. The combination<br />
of additional Mexico automotive production capacity coming<br />
online and a projected 12 percent increase in U.S. auto sales<br />
should drive growth in vehicle and parts volumes. Mexican<br />
population growth and insufficient local crop production should<br />
drive continued demand for imported U.S. grain, benefiting UP’s<br />
southbound shipments of corn, soybeans, DDGS and wheat.<br />
Sugar production in Mexico is forecast to increase 7 percent,<br />
which should yield growth in northbound carloads of sugar.<br />
Volume growth in northbound beer is also expected in 2011,<br />
driven by increased U.S. consumption.<br />
Mexican government infrastructure programs, private sector<br />
construction projects and higher commodity prices, combined<br />
with a more stable peso exchange rate are expected to<br />
benefit southbound shipments of scrap, steel, plastics, soda<br />
ash, paper, minerals, construction materials, sand, cardboard<br />
and other products and northbound shipments of household<br />
appliances and steel. In addition, Mexico’s proximity to<br />
U.S. markets should create additional opportunities, as<br />
manufacturing firms seek to shorten supply chains and keep<br />
production costs low. At the same time, persistently high U.S.<br />
unemployment rates may restrain consumer spending, which is<br />
a critical factor for Mexico business.<br />
<strong>Union</strong> <strong>Pacific</strong>’s current strategies focus on maintaining excellent<br />
service, developing new business and improving core price,<br />
and support an expectation of retaining current business and<br />
potentially generating growth. Foreign investment in Mexico is<br />
forecast to increase around 4 percent, and the current outlook<br />
suggests that markets such as the “maquiladora” industry, food,<br />
steel, coal/coke and mining minerals should grow in 2011.<br />
Bernardo Ayala,<br />
VP Mexico Markets<br />
How is your business group positioned to generate<br />
“economy plus” volume growth between 2011 and 2015?<br />
UP’s unique franchise directly accesses all six major U.S./Mexico<br />
rail gateways, connecting to Mexico’s fastest growing regions as<br />
well as more mature markets. Our business model focuses on<br />
excellent service and direct interaction with customers. We have<br />
extensive coverage of the Mexican market with sales offices in<br />
Mexico City, Monterrey, El Paso, Laredo and Houston. Building<br />
upon our franchise strengths, customer relationships and record<br />
service, we recently created a sales team dedicated exclusively<br />
to developing new business with customers that do not currently<br />
ship via rail. With sales offices in Guadalajara and Irapuato, this<br />
group targets the fast growing Bajio region northwest of Mexico<br />
City (the states of Jalisco, Queretaro, Guanajuato, Michoacan and<br />
Aguascalientes).<br />
The development of new transportation products and services<br />
provides direct, competitive rail offerings to the Mexico market.<br />
Through these efforts we are well-positioned to effectively handle<br />
existing business as well as expected volume growth. <strong>Union</strong><br />
<strong>Pacific</strong>’s International Customer Service Center helps make<br />
international business seamless for our customers. As worldwide<br />
economic trends continue to improve and Mexico’s competitive<br />
position strengthens, our commitment to meeting customer needs<br />
should enable us to generate “economy plus” volume growth in<br />
the coming years.<br />
Percent of Carloads at Border Crossings<br />
Brownsville<br />
9%<br />
Laredo<br />
37%<br />
Calexico<br />
1%<br />
Nogales<br />
12%<br />
El Paso<br />
9%<br />
Eagle Pass<br />
32%<br />
Rail operations across the border remain fluid. Increased hours<br />
of operation at the Eagle Pass gateway and targeted capital<br />
spending should improve cross border operations at all six<br />
UP-served gateways in 2011, further enhancing the Railroad’s<br />
ability to efficiently handle anticipated traffic growth.<br />
33
SELECTED FINANCIAL DATA<br />
<strong>Union</strong> <strong>Pacific</strong> Corporation and Subsidiary Companies<br />
Millions, except per share amounts, carloads, employee statistics and ratios<br />
For the year ended December 31, <strong>2010</strong> 2009 2008 2007 2006<br />
Operating revenues [a] $16,965 $14,143 $17,970 $16,283 $15,578<br />
Operating income 4,981 3,379 4,070 3,364 2,871<br />
Net income 2,780 1,890 2,335 1,848 1,598<br />
Earnings per share - basic [b] 5.58 3.76 4.57 3.47 2.97<br />
Earnings per share - diluted [b] 5.53 3.74 4.53 3.44 2.94<br />
Dividends declared per share [b] 1.31 1.08 0.98 0.745 0.60<br />
Cash provided by operating activities 4,105 3,204 4,044 3,248 2,853<br />
Cash used in investing activities (2,488) (2,145) (2,738) (2,397) (2,015)<br />
Cash used for capital investments (2,482) (2,354) (2,754) (2,467) (2,215)<br />
Cash used in financing activities (2,381) (458) (935) (800) (784)<br />
Cash used for common share repurchases (1,249) - (1,609) (1,375) -<br />
At December 31<br />
Total assets $43,088 $42,184 $39,509 $37,825 $36,318<br />
Long-term obligations 22,373 22,701 21,314 19,328 17,589<br />
Debt due after one year 9,003 9,636 8,607 7,543 6,000<br />
Common shareholders’ equity 17,763 16,801 15,315 15,456 15,190<br />
Equity per common share [c] 36.14 33.27 30.43 29.62 28.11<br />
Additonal Data<br />
Freight revenues [a] $16,069 $13,373 $17,118 $15,486 $14,791<br />
Revenue carloads (units) (000) 8,815 7,786 9,261 9,733 9,852<br />
Operating margin (%) [d] 29.4 23.9 22.6 20.7 18.4<br />
Operating ratio (%) [d] 70.6 76.1 77.4 79.3 81.6<br />
Average employees (000) 42.9 43.5 48.2 50.1 50.7<br />
Operating revenues per employee (000) $395.5 $325.1 $372.8 $325.0 $307.2<br />
Financial Ratios (%)<br />
Debt to capital [e] 34.2 37.0 36.8 33.2 30.9<br />
Return on average common shareholders’ equity [f] 16.1 11.8 15.2 12.1 11.1<br />
[a] Includes fuel surcharge revenue which partially offsets increased operating expenses for fuel. Fuel surcharge revenue is not comparable from year to year due to<br />
implementation of new mileage-based fuel surcharge programs in each respective year. See <strong>2010</strong> SEC Form 10-K for more information.<br />
[b] Earnings per share and dividends have been restated to reflect the May 28, 2008 stock split.<br />
[c] Equity per common share is calculated as follows: common shareholders’ equity divided by common shares issued less treasury shares outstanding. Shares have been<br />
adjusted to reflect the May 28, 2008 stock split.<br />
[d] Operating margin is defined as operating income divided by operating revenues. Operating ratio is defined as operating expenses divided by operating revenues.<br />
[e] Debt to capital is determined as follows: total debt divided by total debt plus equity.<br />
[f] Return on average common shareholders’ equity is determined as follows: Net income divided by average common shareholders’ equity.<br />
34
CONSOLIDATED STATEMENTS OF INCOME (unaudited)<br />
<strong>Union</strong> <strong>Pacific</strong> Corporation and Subsidiary Companies<br />
<strong>2010</strong><br />
Millions, except per share amounts and percentages 1st Qtr 2nd Qtr 3rd Qtr 4th Qtr Full Year<br />
Operating Revenues<br />
Freight revenues $3,755 $3,956 $4,187 $4,171 $16,069<br />
Other revenues 210 226 221 239 896<br />
Total operating revenues $3,965 $4,182 $4,408 $4,410 $16,965<br />
Operating Expenses<br />
Compensation and benefits 1,059 1,051 1,092 1,112 4,314<br />
Fuel 583 608 608 687 2,486<br />
Purchased services and materials 432 472 465 467 1,836<br />
Depreciation 367 368 372 380 1,487<br />
Equipment and other rents 290 282 292 278 1,142<br />
Other 246 122 178 173 719<br />
Total operating expenses 2,977 2,903 3,007 3,097 11,984<br />
Operating Income 988 1,279 1,401 1,313 4,981<br />
Other income 1 19 25 9 54<br />
Interest expense (155) (152) (153) (142) (602)<br />
Income before income taxes 834 1,146 1,273 1,180 4,433<br />
Income taxes (318) (435) (495) (405) (1,653)<br />
Net Income $516 $711 $778 $775 $2,780<br />
Share and Per Share<br />
Earnings per share - basic $1.02 $1.42 $1.58 $1.58 $5.58<br />
Earnings per share - diluted $1.01 $1.40 $1.56 $1.56 $5.53<br />
Weighted average number of shares - basic 504.5 501.8 493.0 491.3 498.2<br />
Weighted average number of shares - diluted 508.7 506.5 497.7 496.3 502.9<br />
Dividends declared per share $0.27 $0.33 $0.33 $0.38 $1.31<br />
Operating Ratio 75.1% 69.4% 68.2% 70.2% 70.6%<br />
Effective Tax Rate 38.1% 38.0% 38.9% 34.3% 37.3%<br />
2009<br />
Millions, except per share amounts and percentages 1st Qtr 2nd Qtr 3rd Qtr 4th Qtr Full Year<br />
Operating Revenues<br />
Freight revenues $3,240 $3,121 $3,471 $3,541 $13,373<br />
Other revenues 175 182 200 213 770<br />
Total operating revenues $3,415 $3,303 $3,671 $3,754 $14,143<br />
Operating Expenses<br />
Compensation and benefits 1,070 976 999 1,018 4,063<br />
Fuel 386 370 466 541 1,763<br />
Purchased services and materials 404 399 413 428 1,644<br />
Depreciation 341 350 363 373 1,427<br />
Equipment and other rents 317 307 290 266 1,180<br />
Other 226 153 179 129 687<br />
Total operating expenses 2,744 2,555 2,710 2,755 10,764<br />
Operating Income 671 748 961 999 3,379<br />
Other income 23 135 14 23 195<br />
Interest expense (141) (150) (156) (153) (600)<br />
Income before income taxes 553 733 819 869 2,974<br />
Income taxes (191) (268) (305) (320) (1,084)<br />
Net Income $362 $465 $514 $549 $1,890<br />
Share and Per Share<br />
Earnings per share - basic $0.72 $0.92 $1.02 $1.09 $3.76<br />
Earnings per share - diluted $0.72 $0.92 $1.01 $1.08 $3.74<br />
Weighted average number of shares - basic 502.7 502.9 503.1 503.5 503.0<br />
Weighted average number of shares - diluted 504.6 505.3 507.0 507.8 505.8<br />
Dividends declared per share $0.27 $0.27 $0.27 $0.27 $1.08<br />
Operating Ratio 80.4% 77.4% 73.8% 73.4% 76.1%<br />
Effective Tax Rate 34.5% 36.6% 37.2% 36.8% 36.4%<br />
Refer to the <strong>Union</strong> <strong>Pacific</strong> Corporation <strong>2010</strong> SEC Form 10-K for additional information, including audited financial statements and related footnotes.<br />
35
CONSOLIDATED STATEMENTS OF FINANCIAL POSITION<br />
<strong>Union</strong> <strong>Pacific</strong> Corporation and Subsidiary Companies<br />
Millions, as of December 31, <strong>2010</strong> 2009<br />
Assets<br />
Current assets:<br />
Cash and cash equivalents $1,086 $1,850<br />
Accounts receivable, net 1,184 666<br />
Materials and supplies 534 475<br />
Current deferred income taxes 261 339<br />
Other current assets 367 350<br />
Total current assets 3,432 3,680<br />
Investments 1,137 1,036<br />
Properties:<br />
Land 4,984 4,891<br />
Road 37,268 35,667<br />
Equipment 8,327 8,209<br />
Other 1,329 1,443<br />
Accumulated depreciation (13,655) (13,008)<br />
Total net properties 38,253 37,202<br />
Other assets 266 266<br />
Total assets $43,088 $42,184<br />
Liabilities and Common Shareholders’ Equity<br />
Current liabilities:<br />
Accounts payable $677 $612<br />
Dividends and interest 383 347<br />
Accrued wages and vacation 357 339<br />
Income and other taxes 337 224<br />
Accrued casualty costs 325 379<br />
Equipment rents payable 86 89<br />
Other 548 480<br />
Debt due within one year 239 212<br />
Total current liabilities 2,952 2,682<br />
Debt due after one year 9,003 9,636<br />
Deferred income taxes 11,557 11,044<br />
Other long-term liabilities 1,813 2,021<br />
Total liabilities 25,325 25,383<br />
Common shareholders’ equity:<br />
Common shares, $2.50 par value, 800,000,000 authorized; 553,931,181 and<br />
553,497,981 issued; 491,565,880 and 505,039,952 outstanding, respectively 1,385 1,384<br />
Paid-in-surplus 3,985 3,968<br />
Retained earnings 17,154 15,027<br />
Treasury stock (4,027) (2,924)<br />
Accumulated other comprehensive loss (734) (654)<br />
Total common shareholders’ equity 17,763 16,801<br />
Total liabilities and common shareholders’ equity $43,088 $42,184<br />
Refer to the <strong>2010</strong> <strong>Union</strong> <strong>Pacific</strong> Corporation SEC Form 10-K for additional information.<br />
36
CONSOLIDATED STATEMENTS OF CASH FLOW<br />
<strong>Union</strong> <strong>Pacific</strong> Corporation and Subsidiary Companies<br />
Millions, for the years ended December 31, <strong>2010</strong> 2009 2008<br />
Operating Activities<br />
Net income $2,780 $1,890 $2,335<br />
Adjustments to reconcile net income to cash provided by operating activities:<br />
Depreciation 1,487 1,427 1,366<br />
Deferred income taxes and unrecognized tax benefits 672 718 545<br />
Net gain on non-operating asset disposition (25) (162) (41)<br />
Other operating activities, net (458) (376) 89<br />
Changes in current assets and liabilities:<br />
Accounts receivable, net (518) (72) 38<br />
Materials and supplies (59) (25) 3<br />
Other current assets (17) (106) 51<br />
Accounts payable and other current liabilities 243 (90) (342)<br />
Cash provided by operating activities 4,105 3,204 4,044<br />
Investing Activities<br />
Capital investments (2,482) (2,354) (2,754)<br />
Proceeds from asset sales 67 187 93<br />
Acquisition of equipment pending financing - (100) (388)<br />
Proceeds from sale of assets financed - 100 388<br />
Other investing activities, net (73) 22 (77)<br />
Cash used in investing activities (2,488) (2,145) (2,738)<br />
Financing Activities<br />
Debt issued 894 843 2,257<br />
Common share repurchases (1,249) - (1,609)<br />
Debt repaid (1,412) (871) (1,208)<br />
Dividends paid (602) (544) (481)<br />
Other financing activities, net (12) 114 106<br />
Cash used in financing activities (2,381) (458) (935)<br />
Net change in cash and cash equivalents (764) 601 371<br />
Cash and cash equivalents at beginning of year 1,850 1,249 878<br />
Cash and cash equivalents at end of year $1,086 $1,850 $1,249<br />
Supplemental Cash Flow Information<br />
Non-cash investing and financing activities:<br />
Capital lease financings $ - $842 $175<br />
Cash dividends declared but not yet paid 183 132 132<br />
Capital investments accrued but not yet paid 125 96 93<br />
Settlement of current liabilities for debt - 14 -<br />
Cash paid during the year for:<br />
Interest, net of amounts capitalized $(614) $(578) $(500)<br />
Income taxes, net of refunds (936) (452) (699)<br />
Refer to the <strong>Union</strong> <strong>Pacific</strong> Corporation <strong>2010</strong> SEC Form 10-K for more information.<br />
37
FINANCIAL AND OPERATING STATISTICS (unaudited)<br />
<strong>Union</strong> <strong>Pacific</strong> Corporation and Subsidiary Companies<br />
For periods ended December 31, <strong>2010</strong> 2009<br />
1st 2nd 3rd 4th Full 1st 2nd 3rd 4th Full<br />
Financial and Revenue Statistics Qtr Qtr Qtr Qtr Year Qtr Qtr Qtr Qtr Year<br />
Operating revenues (millions) $3,965 $4,182 $4,408 $4,410 $16,965 $3,415 $3,303 $3,671 $3,754 $14,143<br />
Operating expenses (millions) $2,977 $2,903 $3,007 $3,097 $11,984 $2,744 $2,555 $2,710 $2,755 $10,764<br />
Operating ratio (%) 75.1 69.4 68.2 70.2 70.6 80.4 77.4 73.8 73.4 76.1<br />
Operating margin (%) 24.9 30.6 31.8 29.8 29.4 19.6 22.6 26.2 26.6 23.9<br />
Compensation and<br />
benefits (millions) $1,059 $1,051 $1,092 $1,112 $4,314 $1,070 $976 $999 $1,018 $4,063<br />
Compensation and benefits/<br />
Operating revenue (%) 26.7 25.1 24.8 25.2 25.4 31.3 29.5 27.2 27.1 28.7<br />
Freight revenue/<br />
Average employees (000) $89.1 $92.9 $96.5 $96.0 $374.7 $72.0 $71.4 $80.3 $84.0 $307.2<br />
Fuel expense (millions) $583 $608 $608 $687 $2,486 $386 $370 $466 $541 $1,763<br />
Average fuel price<br />
per gallon consumed [a] $2.16 $2.29 $2.24 $2.46 $2.29 $1.51 $1.57 $1.87 $2.05 $1.75<br />
Freight revenues (millions) $3,755 $3,956 $4,187 $4,171 $16,069 $3,240 $3,121 $3,471 $3,541 $13,373<br />
Average revenue per car $1,804 $1,815 $1,807 $1,865 $1,823 $1,755 $1,685 $1,706 $1,726 $1,718<br />
Freight revenue/<br />
Revenue ton-mile (cents) 2.96 3.14 3.12 3.14 3.09 2.75 2.76 2.80 2.86 2.79<br />
Effective tax rate (%) 38.1 38.0 38.9 34.3 37.3 34.5 36.6 37.2 36.8 36.4<br />
Debt to capital (%) [b] 34.2 37.0<br />
Adjusted debt to capital (%) [c] 42.5 46.1<br />
Operating Statistics<br />
Revenue carloads (thousands) 2,082 2,180 2,316 2,237 8,815 1,847 1,852 2,035 2,052 7,786<br />
Revenue ton-miles (billions) 127 126 134 133 520 118 113 124 124 479<br />
Gross ton-miles (billions) 224 228 239 240 931 207 201 219 220 847<br />
Average train speed (miles per hour) [d] 26.2 26.4 25.7 26.5 26.2 27.2 27.4 27.4 27.0 27.3<br />
Average system dwell (hours) [d] 26.1 24.7 25.0 25.8 25.4 24.3 24.5 24.5 25.8 24.8<br />
Average rail car inventory [d] 277,549 275,239 274,371 270,642 274,450 286,398 281,780 281,455 282,773 283,102<br />
Fuel consumed (millions of gallons) 263 257 261 270 1,051 252 229 242 256 979<br />
Employees (average) 42,130 42,571 43,375 43,462 42,884 44,997 43,721 43,248 42,157 43,531<br />
GTMs per employee (millions) 5.31 5.36 5.52 5.52 21.72 4.59 4.59 5.06 5.22 19.44<br />
[a] Including taxes and transportation costs.<br />
[b] Debt to capital is computed as follows: total debt divided by total debt plus equity.<br />
[c] Adjusted debt to capital is determined as follows: total debt plus net present value of operating leases plus sale of receivables plus unfunded pension and OPEB divided<br />
by total debt plus equity plus net present value of operating leases plus sale of receivables.<br />
[d] As reported to the Association of American Railroads.<br />
38
NON-GAAP DEFINITIONS<br />
Management believes certain non-GAAP measures provide an alternative presentation of the results that more accurately reflect<br />
ongoing Company operations. These measures should be considered in addition to, not a substitute for, the reported GAAP<br />
results.<br />
Free Cash Flow<br />
Cash provided by operating activities (adjusted for the reclassification of our receivables securitization facility), less cash used in<br />
investing activities and dividends paid. Management believes this is an important measure in evaluating our financial performance<br />
and measures our ability to generate cash without additional external financings.<br />
Return on Invested Capital<br />
Net income plus interest expense, plus interest on present value of operating leases, plus receivable securitization fees, less taxes<br />
on interest and fees divided by average equity plus average debt, plus average value of sold receivables, plus average present<br />
value of operating leases. Management believes this is an important measure for evaluating the efficiency and effectiveness of<br />
the Corporation’s long-term capital investments, and we currently use ROIC as a performance criteria in determining certain<br />
elements of compensation for our executive officers and senior management.<br />
Debt to Capital<br />
Total debt divided by total debt plus equity. Management believes this is an important measure in evaluating our balance sheet<br />
strength and is important in managing our credit ratios and financing relationships.<br />
Adjusted Debt to Capital<br />
Total debt plus value of sold receivables, plus net present value of operating leases, plus after-tax unfunded pension and OPEB<br />
obligation divided by total debt plus net present value of operating leases, plus value of sold receivables, plus after-tax unfunded<br />
pension and OPEB obligation, plus equity. Operating leases were discounted using 6.2% at December 31, <strong>2010</strong>, 6.3% at December<br />
31, 2009 and 8.0% at December 31, 2008. The lower discount rate reflects changes to interest rates and our current financing costs.<br />
Management believes this is an important measure in evaluating the total amount of leverage in our capital structure including<br />
off-balance sheet lease obligations.<br />
39
FREE CASH FLOW AND CONSOLIDATED STATEMENT OF CASH FLOWS<br />
Reconciliation to GAAP<br />
Millions<br />
FREE CASH FLOW - RECONCILIATION TO GAAP<br />
<strong>2010</strong> 2009 2008<br />
Cash provided by operating activities $4,105 $3,204 $4,044<br />
Receivables securitization facility* 400 184 16<br />
Cash provided by operating activities 4,505 3,388 4,060<br />
adjusted for the receivables securitization facility<br />
Cash used in investing activities (2,488) (2,145) (2,738)<br />
Dividends paid (602) (544) (481)<br />
Free cash flow $1,415 $699 $841<br />
* Effective January 1, <strong>2010</strong>, a new accounting standard required us to account for receivables transferred under our receivables securitization facility as<br />
secured borrowings in our Consolidated Statements of Financial Position and as financing activities in our Consolidated Statements of Cash Flows. The<br />
receivables securitization facility is included in our free cash flow calculation to adjust cash provided by operating activities as though our receivables<br />
securitization facility had been accounted for under the new accounting standard for all periods presented.<br />
CONSOLIDATED STATEMENTS OF CASH FLOWS<br />
<strong>2010</strong> 2009 2008<br />
Operating Activities:<br />
Net income $2,780 $1,890 $2,335<br />
Depreciation 1,487 1,427 1,366<br />
Deferred income taxes 672 718 545<br />
Other operating activities - net (834) (831) (202)<br />
Cash Provided by Operating Activities 4,105 3,204 4,044<br />
Investing Activities:<br />
Capital investments (2,482) (2,354) (2,754)<br />
Other investing activities - net (6) 209 16<br />
Cash Used in Investing Activities (2,488) (2,145) (2,738)<br />
Financing Activities:<br />
Debt issued 894 843 2,257<br />
Common shares repurchased (1,249) - (1,609)<br />
Debt repaid (1,412) (871) (1,208)<br />
Dividends paid (602) (544) (481)<br />
Other financing activities - net (12) 114 106<br />
Cash Used in Financing Activities (2,381) (458) (935)<br />
Net Change in Cash and Cash Equivalents $(764) $601 $371<br />
40
RETURN ON INVESTED CAPITAL (ROIC)<br />
Reconciliation to GAAP<br />
Millions, except percentages<br />
<strong>2010</strong> 2009 2008<br />
Net income $2,780 $1,890 $2,335<br />
Add: Interest expense 602 600 511<br />
Add: Interest on present value of operating leases 222 232 299<br />
Add: Receivable securitization fees - 9 23<br />
Less: Taxes on interest and fees (307) (306) (300)<br />
Net operating profit after taxes as adjusted (a) $3,297 $2,425 $2,868<br />
Average equity $17,282 $16,058 $15,386<br />
Add: Average debt 9,545 9,388 8,305<br />
Add: Average value of sold receivables 200 492 592<br />
Add: Average present value of operating leases 3,574 3,681 3,737<br />
Average invested capital as adjusted (b) $30,601 $29,619 $28,020<br />
Return on invested capital as adjusted (a/b) 10.8% 8.2% 10.2%<br />
DEBT TO CAPITAL/ADJUSTED DEBT TO CAPITAL<br />
<strong>2010</strong> 2009 2008<br />
Debt (a) $9,242 $9,848 $8,927<br />
Equity 17,763 16,801 15,315<br />
Capital (b) $27,005 $26,649 $24,242<br />
Debt to capital (a/b) 34.2% 37.0% 36.8%<br />
<strong>2010</strong> 2009 2008<br />
Debt $9,242 $9,848 $8,927<br />
Value of sold receivables - 400 584<br />
Debt including value of sold receivables 9,242 10,248 9,511<br />
Net present value of operating leases 3,476 3,672 3,690<br />
Unfunded pension and OPEB 421 456 734<br />
Adjusted debt (a) $13,139 $14,376 $13,935<br />
Equity 17,763 16,801 15,315<br />
Adjusted capital (b) $30,902 $31,177 $29,250<br />
Adjusted debt to capital (a/b) 42.5% 46.1% 47.6%<br />
41
Cautionary Information<br />
The <strong>2010</strong> Analyst “<strong>Fact</strong> <strong>Book</strong>” provides additional explanatory<br />
information regarding <strong>Union</strong> <strong>Pacific</strong> that may not be<br />
available, included or directly derived from information in<br />
the Company’s Annual Report. The information provided<br />
is supplemental in nature and is not, and should not be<br />
considered or deemed to be better than that available in the<br />
Company’s publicly available reports filed with the SEC.<br />
Additionally, some of the information in the <strong>Fact</strong> <strong>Book</strong> is<br />
derived from the Company’s audited financial statements, but<br />
the <strong>Fact</strong> <strong>Book</strong> and its contents have not been, and should not<br />
be considered, audited.<br />
This <strong>Fact</strong> <strong>Book</strong> includes statements and information regarding<br />
future expectations or results of the Company that are not<br />
historical facts. These statements and information are, or will<br />
be, forward looking as defined by the federal securities laws.<br />
Forward looking statements and information can be identified<br />
by use of forward looking terminology (and derivations<br />
thereof), such as “believes”, “expects”, “may”, “should”, “will”,<br />
“would”, “intends”, “plans”, “estimates”, “anticipates”, “projects”<br />
and other words or phrases of similar intent. Forward looking<br />
statements and information generally include statements<br />
and information included under sections of this <strong>Fact</strong> <strong>Book</strong><br />
entitled “2011 Market Drivers” and information regarding<br />
business opportunities over the next five years, and specifically<br />
include statements and information regarding: the Company’s<br />
expectations or forecasts with respect to general economic<br />
conditions in the U.S. and the world; the Company’s financial<br />
and operational performance; increases of the Company’s<br />
earnings; demand for the Company’s rail service; the<br />
continued ability of the Company to increase prices; improving<br />
customer service; enhancing profitability; volume and revenue<br />
growth; efficiency improvements and increasing returns;<br />
improving asset utilization; the effectiveness or growth of<br />
new and newer services; management of network volumes;<br />
increasing shareholder value; plans for and total amount of<br />
capital investments; completion and effectiveness of capacity<br />
expansion and other capital investments, and other investments<br />
in upgrading or adding signals and facilities; returns on capital<br />
investments; improvements regarding safety of our operations<br />
and equipment; and effectiveness of plans, programs and<br />
initiatives to reduce costs, improve the Company’s Operating<br />
Ratio and other efficiency improvements.<br />
Forward-looking statements and information should not be<br />
read as a guarantee of future performance or results, and will<br />
not necessarily be accurate indications of the times that, or by<br />
which, such performance or results will be achieved. Forwardlooking<br />
statements and information are subject to risks and<br />
uncertainties that could cause actual performance or results to<br />
differ materially from those expressed in the statements.<br />
Forward-looking statements and information reflect the good<br />
faith consideration by management of currently available<br />
information, and may be based on underlying assumptions<br />
believed to be reasonable under the circumstances. However,<br />
such information and assumptions (and, therefore, such<br />
forward-looking statements and information) are or may<br />
be subject to variables or unknown or unforeseeable events<br />
or circumstances over which management has little or no<br />
influence or control. The Risk <strong>Fact</strong>ors in Item 1A of the<br />
Company’s Annual Report on Form 10-K, filed on February<br />
4, 2011, could affect our future results and could cause those<br />
results or other outcomes to differ materially from those<br />
expressed or implied in the forward-looking statements and<br />
information. This <strong>Fact</strong> <strong>Book</strong> should be read in consideration<br />
of these Risk <strong>Fact</strong>ors. To the extent circumstances require or<br />
the Company deems it otherwise necessary, the Company will<br />
update or amend these Risk <strong>Fact</strong>ors in subsequent Annual<br />
Reports, periodic reports on Form 10-Q or current reports on<br />
Form 8-K.<br />
Forward-looking statements speak only as of the date the<br />
statement was made. We assume no obligation to update<br />
forward-looking information to reflect actual results, changes<br />
in assumptions or changes in other factors affecting forwardlooking<br />
information. If we do update one or more forwardlooking<br />
statements, no inference should be drawn that we will<br />
make additional updates with respect thereto or with respect to<br />
other forward-looking statements.<br />
The Company’s financial statements are included solely as<br />
a convenience. The financial statements should be read in<br />
conjunction with the notes to the Financial Statements and<br />
Supplementary Data in Item 8 of the Company’s <strong>2010</strong> Annual<br />
Report on Form 10-K.<br />
42