Traffic Congestion in Mumbai: Will public authorities take the ...
Traffic Congestion in Mumbai: Will public authorities take the ...
Traffic Congestion in Mumbai: Will public authorities take the ...

You also want an ePaper? Increase the reach of your titles
YUMPU automatically turns print PDFs into web optimized ePapers that Google loves.
TRANSPORT | 402<br />
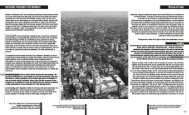
<strong>Traffic</strong> congestion <strong>in</strong> <strong>Mumbai</strong><br />
When one th<strong>in</strong>ks of <strong>Mumbai</strong>, what <strong>in</strong>evitably<br />
comes to m<strong>in</strong>d are images of overcrowded<br />
tra<strong>in</strong>s or queues of cars and yellow-black taxis,<br />
bumper to bumper, constantly honk<strong>in</strong>g. A s<strong>in</strong>gle<br />
word to characterise <strong>the</strong> situation is saturation.<br />
If 60% of <strong>the</strong> 20.8 million <strong>in</strong>habitants of <strong>Mumbai</strong><br />
Metropolitan Region (MMR) walk, <strong>the</strong>n half<br />
of <strong>the</strong> people us<strong>in</strong>g motorised modes <strong>take</strong><br />
<strong>the</strong> tra<strong>in</strong> (MMRDA, 20081). S<strong>in</strong>ce <strong>the</strong> 1970s,<br />
<strong>the</strong> population has tripled but <strong>the</strong> railway<br />
network has rema<strong>in</strong>ed more or less <strong>the</strong> same.<br />
Thanks to <strong>the</strong> <strong>Mumbai</strong> Urban Transport Project<br />
(MUTP), directed by <strong>the</strong> <strong>Mumbai</strong> Metropolitan<br />
Region Development Authority (MMRDA) with<br />
World Bank assistance, <strong>the</strong> network has been<br />
recently upgraded with new carriages and<br />
new tracks but <strong>the</strong> situation is still worsen<strong>in</strong>g.<br />
In peak hours, commuter density is up to 16<br />
persons per square meter (MMRDA, 2008).<br />
Travel growth is ma<strong>in</strong>ly concentrated <strong>in</strong> road<br />
trips. The 140% <strong>in</strong>crease <strong>in</strong> cars, plus a 300%<br />
<strong>in</strong>crease <strong>in</strong> two-wheelers, a 420% <strong>in</strong>crease <strong>in</strong><br />
auto-rickshaws & a 130% <strong>in</strong>crease <strong>in</strong> taxis dur<strong>in</strong>g<br />
1991-2005 has <strong>in</strong>creased traffic congestion<br />
(MMRDA, 2008). Never<strong>the</strong>less, with 5,30,000<br />
cars among <strong>the</strong> 1.7 million motorised vehicles<br />
<strong>in</strong> Greater <strong>Mumbai</strong> 2 , car density is still low (33<br />
cars per <strong>in</strong>habitants). 7% of motorised trips<br />
are made by car, 7% also by two-wheelers<br />
and 9% by taxi & auto-rickshaws (MMRDA,<br />
2008). Car use <strong>in</strong>creases with <strong>in</strong>come but tra<strong>in</strong>s<br />
still compete with cars & two-wheelers for<br />
longer distances. Baker (2005) noticed that<br />
<strong>in</strong> Greater <strong>Mumbai</strong>, 24% of commuters with<br />
a household <strong>in</strong>come higher than 20,000 Rs<br />
per month use a car (3% <strong>in</strong> general) & 20% a<br />
two-wheeler; 21% still <strong>take</strong> <strong>the</strong> tra<strong>in</strong>. MMRDA<br />
(2008) reported that <strong>in</strong> MMR, 18% of commuters<br />
with a household <strong>in</strong>come higher than Rs<br />
30,000 per month use a car (2% <strong>in</strong> general)<br />
&10% a two-wheeler; 36% still <strong>take</strong> <strong>the</strong> tra<strong>in</strong>.<br />
Table 1 General socio-economic data for MMR<br />
Data MMR<br />
Population (millions of <strong>in</strong>habitants) 20.8<br />
Area (km 2 ) 4.353<br />
Mobility (trips/<strong>in</strong>habitant) 1.65<br />
Mobility (motorised trips/<strong>in</strong>habitant) 0.65<br />
Trips/day/modes (million) 34.3<br />
Traveled distance per day (million - km) 250<br />
<strong>Traffic</strong> congestion<br />
<strong>Traffic</strong> congestion occurs when supply<br />
cannot satisfy demand. It is characterised<br />
by low average travel speed dur<strong>in</strong>g peak<br />
periods. S<strong>in</strong>ce 1962, <strong>the</strong> m<strong>in</strong>imum average<br />
speed has been decreas<strong>in</strong>g a lot: From 18<br />
kmph to 8 kmph <strong>in</strong> Island city and from 30<br />
to 5 kmph <strong>in</strong> <strong>the</strong> suburbs. This higher speed<br />
range between m<strong>in</strong>imum speeds at peak<br />
periods and maximum speeds at off-peak<br />
periods results <strong>in</strong> an <strong>in</strong>crease of travel time<br />
variability. More and more <strong>Mumbai</strong>kars have<br />
<strong>the</strong> feel<strong>in</strong>g that <strong>the</strong>y cannot time <strong>the</strong>mselves.<br />
Table 2 Travel speeds (kmph) <strong>in</strong> MMR<br />
Wilbur Smith<br />
Associates,<br />
1962<br />
Central Road<br />
Research<br />
Institute,1983<br />
LEA<br />
International<br />
Ldt, 2008<br />
Island city 18 to 25 18 to 25 8 to 30<br />
Suburbs 30 to 40 30 to 40 5to 45<br />
MMR 30 to 50 35 to 45 25 to 55<br />
Passenger car unit (PCU) is used to measure<br />
heterogeneous traffic volume and variation.<br />
One car is converted <strong>in</strong>to 1 PCU; 1 taxi <strong>in</strong>to 1<br />
PCU, 1 rickshaw <strong>in</strong>to 0.8 PCU, 1 two-wheeler<br />
<strong>in</strong>to 0.5 PCU and 1 bus <strong>in</strong>to 3 PCU. <strong>Traffic</strong> is<br />
dense dur<strong>in</strong>g almost <strong>the</strong> whole day with a slight<br />
off-peak period around lunch time (figure 1).<br />
Figure 1 <strong>Traffic</strong> variation (total <strong>in</strong> PCUs),<br />
MMRDA, 2008.<br />
<strong>Traffic</strong> congestion ma<strong>in</strong>ly occurs dur<strong>in</strong>g<br />
peak hours, southbound <strong>in</strong> <strong>the</strong> morn<strong>in</strong>g and<br />
northbound <strong>in</strong> <strong>the</strong> even<strong>in</strong>g. People go to work <strong>in</strong><br />
<strong>the</strong> Island city and go back home <strong>in</strong> <strong>the</strong> suburbs.<br />
With <strong>the</strong> development of new bus<strong>in</strong>ess centres<br />
such as Bandra-Kurla-Complex or Andheri-Kurla<br />
Road, <strong>the</strong> suburbs have begun to offer more<br />
jobs. The MMR urban structure is chang<strong>in</strong>g:<br />
Figure 1<br />
If <strong>the</strong> population has rema<strong>in</strong>ed <strong>the</strong> same <strong>in</strong><br />
Island city s<strong>in</strong>ce 1971, it has grown a lot <strong>in</strong> <strong>the</strong><br />
suburbs and fur<strong>the</strong>r districts, where hous<strong>in</strong>g<br />
rema<strong>in</strong>s affordable for <strong>the</strong> middle-class (41%<br />
of MMR population lives <strong>in</strong> slums) and job<br />
opportunities are grow<strong>in</strong>g. The centre of<br />
gravity is mov<strong>in</strong>g towards <strong>the</strong> suburbs. Until<br />
<strong>the</strong> beg<strong>in</strong>n<strong>in</strong>g of <strong>the</strong> 2000s, 80% of commute<br />
trips were southbound. Nowadays, <strong>the</strong> figure<br />
has dropped to 60%. Rails still assure <strong>the</strong> major<br />
part of commute trips but local government<br />
has started to build roads (Balakrishnan,<br />
<strong>in</strong>terview 04/09/10). <strong>Traffic</strong> jams are important<br />
<strong>in</strong> westbound and eastbound where rail<br />
transport does not exist. The worst part of <strong>the</strong><br />
MMR <strong>in</strong> terms of traffic jams is <strong>the</strong> western<br />
suburbs where travel speed drops to 5 km/h.<br />
Table 3 Urban growth <strong>in</strong> Greater<br />
<strong>Mumbai</strong>: Hous<strong>in</strong>g and job localization<br />
Employment<br />
<strong>in</strong> <strong>the</strong> formal<br />
sector<br />
(In millions),<br />
Population (In millions) MMRDA<br />
2008<br />
Census<br />
1971<br />
Census<br />
2001<br />
Growth<br />
%<br />
2005<br />
Island city 3.07 3.34 109 % 2.20<br />
Western suburbs 1.71 5.13 300 % 2.18<br />
Eastern suburbs 1.20 3.51 290 % 1.00<br />
Total Greater<br />
<strong>Mumbai</strong><br />
5.98 11.98 200 % 5.38<br />
<strong>Traffic</strong> congestion is ma<strong>in</strong>ly due to <strong>the</strong> rapid<br />
growth <strong>in</strong> motorisation, while <strong>the</strong> road network<br />
has not changed much <strong>in</strong> 4 decades. This rapid<br />
growth <strong>in</strong> motorisation can be expla<strong>in</strong>ed by<br />
<strong>the</strong> extreme saturation <strong>in</strong> <strong>public</strong> transport, <strong>the</strong><br />
lack of efficient <strong>public</strong> transport <strong>in</strong> <strong>the</strong> eastwest<br />
l<strong>in</strong>ks and by <strong>in</strong>come growth, especially<br />
s<strong>in</strong>ce <strong>the</strong> 1991 economic liberalisation.<br />
Cars are becom<strong>in</strong>g cheaper items compared<br />
to o<strong>the</strong>r goods such as hous<strong>in</strong>g, and central<br />
government encourages its ownership<br />
(Datar, <strong>in</strong>terview 03/16/10). Moreover,<br />
70% of car owners can afford a driver who<br />
relieves <strong>the</strong>m of traffic and park<strong>in</strong>g problems<br />
(data from MESN). At <strong>the</strong> same time, local<br />
government has not managed to control<br />
urban decentralisation, which has given birth<br />
to suburbs without a real urban design.<br />
Consequently, average trip distances have been<br />
<strong>in</strong>creas<strong>in</strong>g, mak<strong>in</strong>g walk<strong>in</strong>g and cycl<strong>in</strong>g less<br />
feasible than before and thus encourag<strong>in</strong>g a<br />
shift from non-motorised to motorised modes.<br />
Comb<strong>in</strong>ed with slower travel speeds, suburban<br />
sprawl has greatly <strong>in</strong>creased average travel time<br />
(Pucher, 2007). This aggressive environment<br />
for pedestrians and cyclists encourages <strong>the</strong>m<br />
to buy a two-wheeler and <strong>the</strong>n a car as soon as<br />
<strong>the</strong>y can afford it (Tiwari, <strong>in</strong>terview 19/03/10).<br />
There are also more specific causes like<br />
encroachments, mixed traffic, lack of traffic<br />
discipl<strong>in</strong>e, lack of network hierarchy, railway level<br />
cross<strong>in</strong>gs, processions and religious events.<br />
How do <strong>public</strong> <strong>authorities</strong><br />
face traffic congestion?<br />
Not <strong>the</strong> ma<strong>in</strong> issue but a major one<br />
Transportation followed water shortages and<br />
<strong>the</strong> high cost of liv<strong>in</strong>g as critical issues for <strong>the</strong><br />
10,000 <strong>Mumbai</strong>kars, <strong>the</strong> H<strong>in</strong>dustan Times –<br />
Ipsos Indica Research surveyed (2010) but<br />
<strong>in</strong>frastructure did emerge as one of <strong>the</strong> top two<br />
issues for <strong>the</strong> city’s future, just beh<strong>in</strong>d education.<br />
The question of <strong>in</strong>frastructure related to traffic<br />
TRANSPORT | 403