OCBC - Under Construction Home - Phillip Securities Pte Ltd
OCBC - Under Construction Home - Phillip Securities Pte Ltd
OCBC - Under Construction Home - Phillip Securities Pte Ltd

Create successful ePaper yourself
Turn your PDF publications into a flip-book with our unique Google optimized e-Paper software.
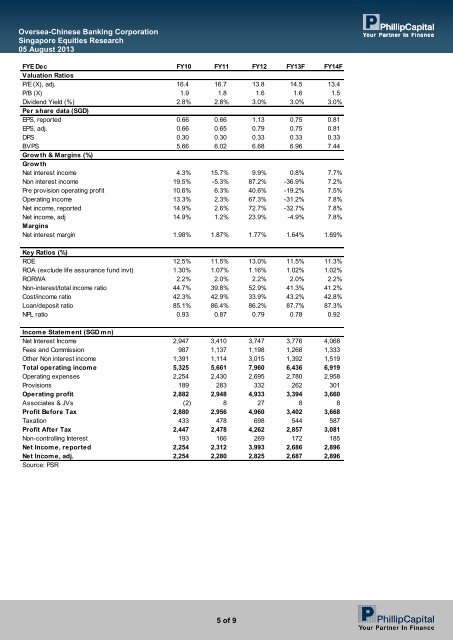
Oversea-Chinese Banking Corporation<br />
Singapore Equities Research<br />
05 August 2013<br />
FYE Dec FY10 FY11 FY12 FY13F FY14F<br />
Valuation Ratios<br />
P/E (X), adj. 16.4 16.7 13.8 14.5 13.4<br />
P/B (X) 1.9 1.8 1.6 1.6 1.5<br />
Dividend Yield (%) 2.8% 2.8% 3.0% 3.0% 3.0%<br />
Per share data (SGD)<br />
EPS, reported 0.66 0.66 1.13 0.75 0.81<br />
EPS, adj. 0.66 0.65 0.79 0.75 0.81<br />
DPS 0.30 0.30 0.33 0.33 0.33<br />
BVPS 5.66 6.02 6.68 6.96 7.44<br />
Grow th & Margins (%)<br />
Grow th<br />
Net interest income 4.3% 15.7% 9.9% 0.8% 7.7%<br />
Non interest income 19.5% -5.3% 87.2% -36.9% 7.2%<br />
Pre provision operating profit 10.6% 6.3% 40.6% -19.2% 7.5%<br />
Operating income 13.3% 2.3% 67.3% -31.2% 7.8%<br />
Net income, reported 14.9% 2.6% 72.7% -32.7% 7.8%<br />
Net income, adj 14.9% 1.2% 23.9% -4.9% 7.8%<br />
Margins<br />
Net interest margin 1.98% 1.87% 1.77% 1.64% 1.69%<br />
Key Ratios (%)<br />
ROE 12.5% 11.5% 13.0% 11.5% 11.3%<br />
ROA (exclude life assurance fund invt) 1.30% 1.07% 1.16% 1.02% 1.02%<br />
RORWA 2.2% 2.0% 2.2% 2.0% 2.2%<br />
Non-interest/total income ratio 44.7% 39.8% 52.9% 41.3% 41.2%<br />
Cost/income ratio 42.3% 42.9% 33.9% 43.2% 42.8%<br />
Loan/deposit ratio 85.1% 86.4% 86.2% 87.7% 87.3%<br />
NPL ratio 0.93 0.87 0.79 0.78 0.92<br />
Income Statement (SGD mn)<br />
Net Interest Income 2,947 3,410 3,747 3,776 4,068<br />
Fees and Commission 987 1,137 1,198 1,268 1,333<br />
Other Non interest income 1,391 1,114 3,015 1,392 1,519<br />
Total operating income 5,325 5,661 7,960 6,436 6,919<br />
Operating expenses 2,254 2,430 2,695 2,780 2,958<br />
Provisions 189 283 332 262 301<br />
Operating profit 2,882 2,948 4,933 3,394 3,660<br />
Associates & JVs (2) 8 27 8 8<br />
Profit Before Tax 2,880 2,956 4,960 3,402 3,668<br />
Taxation 433 478 698 544 587<br />
Profit After Tax 2,447 2,478 4,262 2,857 3,081<br />
Non-controlling Interest 193 166 269 172 185<br />
Net Income, reported 2,254 2,312 3,993 2,686 2,896<br />
Net Income, adj. 2,254 2,280 2,825 2,687 2,896<br />
Source: PSR<br />
5 of 9