read - Securities Lending Times
read - Securities Lending Times
read - Securities Lending Times

Create successful ePaper yourself
Turn your PDF publications into a flip-book with our unique Google optimized e-Paper software.
A light at the end of the tunnel<br />
DataAnalysis<br />
What is driving the recent recovery in share prices? David Lewis of<br />
SunGard Astec Analytics takes a look<br />
Recovery is something everyone is anxiously<br />
looking out for. Markets fluctuate on seemingly<br />
every bit of good and indeed bad news. Share<br />
prices that are dictated by fundamentals seems<br />
to be a thing of the past to some, and as the<br />
financial markets settle into the ‘new normal’,<br />
share price stability and normalisation seem to<br />
be the stuff of myths. So as several world indices<br />
push towards record highs, are we seeing<br />
signs of recovery, or a bubble of optimism that<br />
will be cruelly burst by the next wave of poor<br />
economic news?<br />
The middle of March has seen the S&P 500 index<br />
within a hair’s b<strong>read</strong>th of breaking its own<br />
record level including several constituents of<br />
the index approaching or breaching their own<br />
share price records, yet growth remains stubbornly<br />
flat in the US market. The UK and the US<br />
share another conundrum that is challenging investors<br />
and analysts alike—growth is stagnant,<br />
yet unemployment continues to fall. In fact, the<br />
US jobless rate is lower than at any time since<br />
2008 (four week moving average), suggesting<br />
that the labour market continues to improve.<br />
American Express and IBM are among 73<br />
members of the S&P 500 that reached record<br />
price levels in the middle of March. At the prior<br />
S&P peak in 2007, there were only 60 companies<br />
recording all-time high valuations according<br />
to research published by Birinyi Associates.<br />
Combine these statistics with the assumption<br />
that share prices are dictated much more by<br />
future expectation than to reward historical performance<br />
(beware: your investments may go<br />
down in value and you may not get back what<br />
you invested) and you would certainly think that<br />
good times are around the corner. Does everyone<br />
agree? What does the short interest tell us<br />
about some of these stocks?<br />
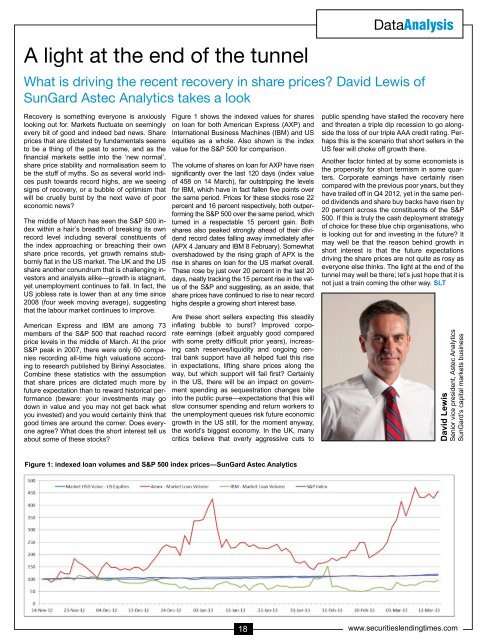
Figure 1 shows the indexed values for shares<br />
on loan for both American Express (AXP) and<br />
International Business Machines (IBM) and US<br />
equities as a whole. Also shown is the index<br />
value for the S&P 500 for comparison.<br />
The volume of shares on loan for AXP have risen<br />
significantly over the last 120 days (index value<br />
of 458 on 14 March), far outstripping the levels<br />
for IBM, which have in fact fallen five points over<br />
the same period. Prices for these stocks rose 22<br />
percent and 16 percent respectively, both outperforming<br />
the S&P 500 over the same period, which<br />
turned in a respectable 15 percent gain. Both<br />
shares also peaked strongly ahead of their dividend<br />
record dates falling away immediately after<br />
(APX 4 January and IBM 8 February). Somewhat<br />
overshadowed by the rising graph of APX is the<br />
rise in shares on loan for the US market overall.<br />
These rose by just over 20 percent in the last 20<br />
days, neatly tracking the 15 percent rise in the value<br />
of the S&P and suggesting, as an aside, that<br />
share prices have continued to rise to near record<br />
highs despite a growing short interest base.<br />
Are these short sellers expecting this steadily<br />
inflating bubble to burst? Improved corporate<br />
earnings (albeit arguably good compared<br />
with some pretty difficult prior years), increasing<br />
cash reserves/liquidity and ongoing central<br />
bank support have all helped fuel this rise<br />
in expectations, lifting share prices along the<br />
way, but which support will fail first? Certainly<br />
in the US, there will be an impact on government<br />
spending as sequestration changes bite<br />
into the public purse—expectations that this will<br />
slow consumer spending and return workers to<br />
the unemployment queues risk future economic<br />
growth in the US still, for the moment anyway,<br />
the world’s biggest economy. In the UK, many<br />
critics believe that overly aggressive cuts to<br />
public spending have stalled the recovery here<br />
and threaten a triple dip recession to go alongside<br />
the loss of our triple AAA credit rating. Perhaps<br />
this is the scenario that short sellers in the<br />
US fear will choke off growth there.<br />
Another factor hinted at by some economists is<br />
the propensity for short termism in some quarters.<br />
Corporate earnings have certainly risen<br />
compared with the previous poor years, but they<br />
have trailed off in Q4 2012, yet in the same period<br />
dividends and share buy backs have risen by<br />
20 percent across the constituents of the S&P<br />
500. If this is truly the cash deployment strategy<br />
of choice for these blue chip organisations, who<br />
is looking out for and investing in the future? It<br />
may well be that the reason behind growth in<br />
short interest is that the future expectations<br />
driving the share prices are not quite as rosy as<br />
everyone else thinks. The light at the end of the<br />
tunnel may well be there; let’s just hope that it is<br />
not just a train coming the other way. SLT<br />
David Lewis<br />
Senior vice president, Astec Analytics<br />
SunGard’s capital markets business<br />
Figure 1: indexed loan volumes and S&P 500 index prices—SunGard Astec Analytics<br />
18 www.securitieslendingtimes.com