Terrestrial Gross Carbon Dioxide Uptake: Global ... - LUCCI
Terrestrial Gross Carbon Dioxide Uptake: Global ... - LUCCI
Terrestrial Gross Carbon Dioxide Uptake: Global ... - LUCCI

You also want an ePaper? Increase the reach of your titles
YUMPU automatically turns print PDFs into web optimized ePapers that Google loves.
variation between biomes and sites (3–5). In the<br />
absence of direct observations, a combined GPP<br />
of all terrestrial ecosystems of 120 Pg C year −1<br />
was obtained (6) by doubling global biomass production<br />
estimates (7) without an empirical basis of<br />
spatially resolved biomass production and its relationship<br />
to GPP. A global terrestrial GPP of 100 to<br />
150PgCyear −1 is consistent with the observed<br />
variation of 18 OCO in the atmosphere (8, 9). However,<br />
the ability of 18 OCO to constrain GPP de-<br />
1<br />
Biogeochemical Model-Data Integration Group, Max Planck<br />
Institute for Biogeochemistry, 07745 Jena, Germany. 2 Laboratoire<br />
des Sciences du Climat et de L’Environnement, Institut<br />
Pierre Simon Laplace, CEA-CNRS-UVSQ, Gif-sur-Yvette, France.<br />
3<br />
Faculdade de Ciências e Tecnologia (FCT), Universidade Nova<br />
de Lisboa, Caparica, Portugal. 4 Biogeochemical Systems, Max<br />
Planck Institute for Biogeochemistry, 07745 Jena, Germany.<br />
5<br />
McMaster Centre for Climate Change, McMaster University,<br />
Hamilton, Ontario, Canada. 6 Department of Environmental Science,<br />
Policy and Management and Berkeley Atmospheric Science Center,<br />
University of California, Berkeley, CA 94720, USA. 7 National Center<br />
forAtmosphericResearch,Boulder,CO80305,USA. 8 Potsdam<br />
Institute for Climate Impact Research (PIK), 14473 Potsdam,<br />
Germany. 9 Climate Change Unit, Institute for Environment and<br />
Sustainability, European Commission, DG Joint Research Centre,<br />
Ispra, Italy. 10 Department of Earth and Ecosystem Science, Lund<br />
University, Sweden. 11 Department of Animal and Plant Sciences,<br />
University of Sheffield, Sheffield S10 2TN, UK. 12 Departement<br />
Biologie, Universiteit Antwerpen, Belgium. 13 Centre d’étude de<br />
la forêt, Faculté de foresterie, de géographie et de géomatique,<br />
Université Laval, Quebec, Canada. 14 Cirad-Persyst, UPR80,<br />
Fonctionnement et Pilotage des Ecosystémes de Plantation,<br />
Montpellier, France. 15 CATIE (Centro Agronómico Tropical de<br />
Investigación y Enseñanza), Turrialba, Costa Rica. 16 Nature<br />
Conservation and Plant Ecology Group, Wageningen University,<br />
Netherlands. 17 Graduate School of Geography, Clark University,<br />
Worcester, MA 01610, USA. 18 Department of Forest Environment<br />
and Resources, University of Tuscia, Viterbo, Italy.<br />
*To whom correspondence should be addressed. E-mail:<br />
christian.beer@bgc-jena.mpg.de<br />
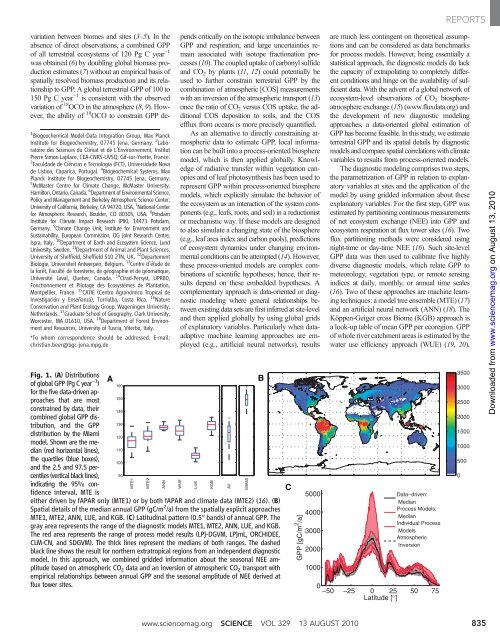
Fig. 1. (A) Distributions<br />
of global GPP (Pg C year −1 )<br />
for the five data-driven approaches<br />
that are most<br />
constrained by data, their<br />
combined global GPP distribution,<br />
and the GPP<br />
distribution by the Miami<br />
model. Shown are the median<br />
(red horizontal lines),<br />
the quartiles (blue boxes),<br />
and the 2.5 and 97.5 percentiles<br />
(vertical black lines),<br />
indicating the 95% con-<br />
fidence interval. MTE is<br />
A<br />
160<br />
150<br />
140<br />
130<br />
120<br />
110<br />
100<br />
90<br />
MTE1<br />
MTE2<br />
pends critically on the isotopic imbalance between<br />
GPP and respiration, and large uncertainties remain<br />
associated with isotope fractionation processes<br />
(10). The coupled uptake of carbonyl sulfide<br />
and CO2 by plants (11, 12) could potentially be<br />
used to further constrain terrestrial GPP by the<br />
combination of atmospheric [COS] measurements<br />
with an inversion of the atmospheric transport (13)<br />
once the ratio of CO2 versus COS uptake, the additional<br />
COS deposition to soils, and the COS<br />
efflux from oceans is more precisely quantified.<br />
As an alternative to directly constraining atmospheric<br />
data to estimate GPP, local information<br />
can be built into a process-oriented biosphere<br />
model, which is then applied globally. Knowledge<br />
of radiative transfer within vegetation canopies<br />
and of leaf photosynthesis has been used to<br />
represent GPP within process-oriented biosphere<br />
models, which explicitly simulate the behavior of<br />
the ecosystem as an interaction of the system components<br />
(e.g., leafs, roots, and soil) in a reductionist<br />
or mechanistic way. If these models are designed<br />
to also simulate a changing state of the biosphere<br />
(e.g., leaf area index and carbon pools), predictions<br />
of ecosystem dynamics under changing environmental<br />
conditions can be attempted (14). However,<br />
these process-oriented models are complex combinations<br />
of scientific hypotheses; hence, their results<br />
depend on these embedded hypotheses. A<br />
complementary approach is data-oriented or diagnostic<br />
modeling where general relationships between<br />
existing data sets are first inferred at site-level<br />
and then applied globally by using global grids<br />
of explanatory variables. Particularly when dataadaptive<br />
machine learning approaches are employed<br />
(e.g., artificial neural networks), results<br />
either driven by fAPAR only (MTE1) or by both fAPAR and climate data (MTE2) (16). (B)<br />
Spatial details of the median annual GPP (gC/m 2 /a) from the spatially explicit approaches<br />
MTE1, MTE2, ANN, LUE, and KGB. (C) Latitudinal pattern (0.5° bands) of annual GPP. The<br />
gray area represents the range of the diagnostic models MTE1, MTE2, ANN, LUE, and KGB.<br />
The red area represents the range of process model results (LPJ-DGVM, LPJmL, ORCHIDEE,<br />
CLM-CN, and SDGVM). The thick lines represent the medians of both ranges. The dashed<br />
blacklineshowstheresultfornorthernextratropical regions from an independent diagnostic<br />
model. In this approach, we combined gridded information about the seasonal NEE amplitude<br />
based on atmospheric CO2 data and an inversion of atmospheric CO2 transport with<br />
empirical relationships between annual GPP and the seasonal amplitude of NEE derived at<br />
flux tower sites.<br />
ANN<br />
WUE<br />
LUE<br />
KGB<br />
All<br />
MIAMI<br />
B<br />
C<br />
GPP [gC/m 2 /a]<br />
5000<br />
4000<br />
3000<br />
2000<br />
1000<br />
are much less contingent on theoretical assumptions<br />
and can be considered as data benchmarks<br />
for process models. However, being essentially a<br />
statistical approach, the diagnostic models do lack<br />
the capacity of extrapolating to completely different<br />
conditions and hinge on the availability of sufficient<br />
data. With the advent of a global network of<br />
ecosystem-level observations of CO 2 biosphereatmosphere<br />
exchange (15) (www.fluxdata.org) and<br />
the development of new diagnostic modeling<br />
approaches, a data-oriented global estimation of<br />
GPP has become feasible. In this study, we estimate<br />
terrestrial GPP and its spatial details by diagnostic<br />
models and compare spatial correlations with climate<br />
variables to results from process-oriented models.<br />
The diagnostic modeling comprises two steps,<br />
the parametrization of GPP in relation to explanatory<br />
variables at sites and the application of the<br />
model by using gridded information about these<br />
explanatory variables. For the first step, GPP was<br />
estimated by partitioning continuous measurements<br />
of net ecosystem exchange (NEE) into GPP and<br />
ecosystem respiration at flux tower sites (16). Two<br />
flux partitioning methods were considered using<br />
night-time or day-time NEE (16). Such site-level<br />
GPP data was then used to calibrate five highly<br />
diverse diagnostic models, which relate GPP to<br />
meteorology, vegetation type, or remote sensing<br />
indices at daily, monthly, or annual time scales<br />
(16). Two of these approaches are machine learning<br />
techniques: a model tree ensemble (MTE) (17)<br />
and an artificial neural network (ANN) (18). The<br />
Köppen-Geiger cross Biome (KGB) approach is<br />
a look-up table of mean GPP per ecoregion. GPP<br />
of whole river catchment areas is estimated by the<br />
water use efficiency approach (WUE) (19, 20),<br />
Data−driven:<br />
Median<br />
Process Models:<br />
Median<br />
Individual Process<br />
Models<br />
Atmospheric<br />
Inversion<br />
0<br />
−50 −25 0 25 50 75<br />
Latitude [°]<br />
REPORTS<br />
www.sciencemag.org SCIENCE VOL 329 13 AUGUST 2010 835<br />
3500<br />
3000<br />
2500<br />
2000<br />
1500<br />
1000<br />
500<br />
0<br />
on August 13, 2010<br />
www.sciencemag.org<br />
Downloaded from