Terrestrial Gross Carbon Dioxide Uptake: Global ... - LUCCI
Terrestrial Gross Carbon Dioxide Uptake: Global ... - LUCCI
Terrestrial Gross Carbon Dioxide Uptake: Global ... - LUCCI

You also want an ePaper? Increase the reach of your titles
YUMPU automatically turns print PDFs into web optimized ePapers that Google loves.
REPORTS<br />
834<br />
thesametime[fig.S5A(19)] are consistent with<br />
extracellular signals.<br />
After a relatively brief (~40-s) period of extracellular<br />
signals, we observed several pronounced<br />
changes in recorded signals (Fig. 4, B and C, II<br />
and III) without application of external force to<br />
the PDMS/cell support. Specifically, the initial<br />
extracellular signals gradually disappeared (Fig.<br />
4, B and C, II, pink stars). There was a concomitant<br />
decrease in baseline potential, and new<br />
peaks emerged that had an opposite sign, similar<br />
frequency, much greater amplitude, and longer<br />
duration (Fig. 4B, II, green stars). These new<br />
peaks, which are coincident with cardiomyocyte<br />
cell beating, rapidly reached a steady state (Fig.<br />
4B, III) with an average calibrated peak amplitude<br />
of ~80 mV and duration of ~200 ms. The<br />
amplitude, sign, and duration are near those reported<br />
for whole-cell patch clamp recordings<br />
from cardiomyocytes (27, 28); thus, we conclude<br />
that these data represent a transition to steadystate<br />
intracellular recording (Fig. 4A, right) with<br />
the 3D nanowire probe.<br />
Detailed analysis of the latter steady-state<br />
peaks (Fig. 4C, III) shows five characteristic phases<br />
of a cardiac intracellular potential (27, 28),<br />
including (a) resting state, (b) rapid depolarization,<br />
(c) plateau, (d) rapid repolarization, and (e) hyperpolarization.<br />
In addition, a sharp transient peak<br />
(blue star) and the notch (orange star) possibly<br />
associated with the inward sodium and outward<br />
potassium currents (28) can be resolved. Optical<br />
images recorded at the same time as these<br />
intracellular peaks (fig. S5B) showed the kinked<br />
nanowire probe tips in a possible intracellular<br />
region of the cell (19). When the PDMS/cell<br />
substrate was mechanically retracted from the 3D<br />
kinked nanowire devices, the intracellular peaks<br />
disappeared, but they reappeared when the cell<br />
substrate was brought back into gentle contact<br />
with the device. This process could be repeated<br />
multiple times without degradation in the recorded<br />
signal. When vertical 3D nanoprobe<br />
devices were bent into a configuration with angle<br />
q < ~50° with respect to the substrate, or when<br />
kinked nanowire devices were fabricated on<br />
planar substrates, we could record only extracellular<br />
signals. These results confirm that electrical<br />
recording arises from the highly localized,<br />
pointlike nanoFET near the probe tip, which (i)<br />
initially records only extracellular potential, (ii)<br />
simultaneously records both extracellular and<br />
intracellular signals as the nanoFET spans the<br />
cell membrane, and (iii) records only intracellular<br />
signals when fully inside the cell.<br />
Additional work remains to develop this new<br />
synthetic nanoprobe as a routine tool like the<br />
patch-clamp micropipette (10, 11), although we<br />
believe that there are already clear advantages:<br />
Electrical recording with kinked nanowire<br />
probes is relatively simple without the need for<br />
resistance or capacitance compensation (9, 11);<br />
the nanoprobes are chemically less invasive than<br />
pipettes, as there is no solution exchange; the<br />
small size and biomimetic coating minimizes me-<br />
chanical invasiveness; and the nanoFETs have high<br />
spatial and temporal resolution for recording.<br />
References and Notes<br />
1. D. A. Giljohann, C. A. Mirkin, Nature 462, 461 (2009).<br />
2. T. Cohen-Karni, B. P. Timko, L. E. Weiss, C. M. Lieber,<br />
Proc. Natl. Acad. Sci. U.S.A. 106, 7309 (2009).<br />
3. J. F. Eschermann et al., Appl. Phys. Lett. 95, 083703<br />
(2009).<br />
4. Q. Qing et al., Proc. Natl. Acad. Sci. U.S.A. 107, 1882<br />
(2010).<br />
5. I. Heller, W. T. T. Smaal, S. G. Lemay, C. Dekker, Small 5,<br />
2528 (2009).<br />
6. W. Lu, C. M. Lieber, Nat. Mater. 6, 841 (2007).<br />
7. A. Grinvald, R. Hildesheim, Nat. Rev. Neurosci. 5, 874<br />
(2004).<br />
8. M. Scanziani, M. Häusser, Nature 461, 930 (2009).<br />
9. R. D. Purves, Microelectrode Methods for Intracellular<br />
Recording and Ionophoresis (Academic Press, London,<br />
1981).<br />
10. B. Sakmann, E. Neher, Annu. Rev. Physiol. 46, 455 (1984).<br />
11. A. Molleman, Patch Clamping: An Introductory Guide to<br />
Patch Clamp Electrophysiology (Wiley, Chichester, UK,<br />
2003).<br />
12. R. M. Wightman, Science 311, 1570 (2006).<br />
13. A. G. Ewing, T. G. Strein, Y. Y. Lau, Acc. Chem. Res. 25,<br />
440 (1992).<br />
14. M. G. Schrlau, N. J. Dun, H. H. Bau, ACS Nano 3, 563<br />
(2009).<br />
15. J. P. Donoghue, Nat. Neurosci. 5 (suppl.), 1085<br />
(2002).<br />
16. M. Ieong, B. Doris, J. Kedzierski, K. Rim, M. Yang,<br />
Science 306, 2057 (2004).<br />
17. M. Ferrari, Nat. Rev. Cancer 5, 161 (2005).<br />
18. B. Z. Tian, P. Xie, T. J. Kempa, D. C. Bell, C. M. Lieber,<br />
Nat. Nanotechnol. 4, 824 (2009).<br />
19. Materials and methods are available as supporting<br />
material on Science Online.<br />
20. C. Conde, A. Cáceres, Nat. Rev. Neurosci. 10, 319 (2009).<br />
21. T. G. Leong et al., Proc. Natl. Acad. Sci. U.S.A. 106, 703 (2009).<br />
22. N. Misra et al., Proc. Natl. Acad. Sci. U.S.A. 106, 13780<br />
(2009).<br />
23. X. J. Zhou, J. M. Moran-Mirabal, H. G. Craighead,<br />
P. L. McEuen, Nat. Nanotechnol. 2, 185 (2007).<br />
24. L. V. Chernomordik, M. M. Kozlov, Nat. Struct. Mol. Biol.<br />
15, 675 (2008).<br />
25. W. C. Claycomb et al., Proc. Natl. Acad. Sci. U.S.A. 95,<br />
2979 (1998).<br />
26. B. D. Almquist, N. A. Melosh, Proc. Natl. Acad. Sci. U.S.A.<br />
107, 5815 (2010).<br />
27. D. M. Bers, Nature 415, 198 (2002).<br />
28. D. P. Zipes, J. Jalife, Cardiac Electrophysiology: From Cell<br />
to Bedside (Saunders, Philadelphia, ed. 2, 2009).<br />
29. WethankG.Yellen,W.C.Claycomb,B.P.Bean,<br />
P. T. Ellinor, G. H. Yu, D. Casanova, B. P. Timko, and<br />
T. Dvir for help with experiments and data analysis.<br />
C.M.L. acknowledges support from a NIH Director’s Pioneer<br />
Award (5DP1OD003900), a National Security Science and<br />
Engineering Faculty Fellow (NSSEFF) award (N00244-09-1-<br />
0078), and the McKnight Foundation Neuroscience award.<br />
Supporting Online Material<br />
www.sciencemag.org/cgi/content/full/329/5993/830/DC1<br />
Materials and Methods<br />
Figs. S1 to S5<br />
References<br />
10 May 2010; accepted 7 July 2010<br />
10.1126/science.1192033<br />
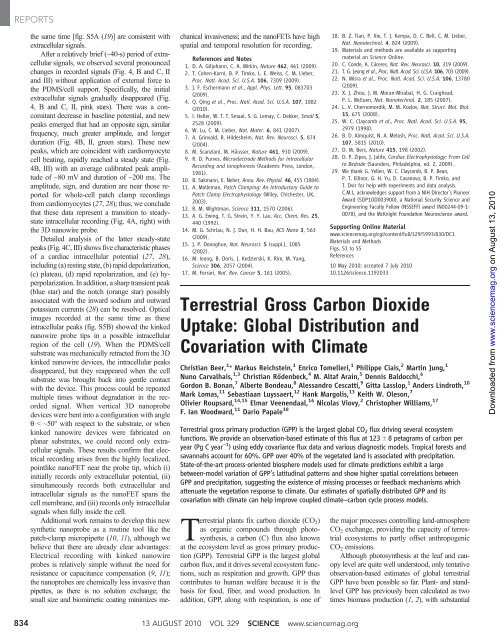
<strong>Terrestrial</strong> <strong>Gross</strong> <strong>Carbon</strong> <strong>Dioxide</strong><br />
<strong>Uptake</strong>: <strong>Global</strong> Distribution and<br />
Covariation with Climate<br />
Christian Beer, 1 * Markus Reichstein, 1 Enrico Tomelleri, 1 Philippe Ciais, 2 Martin Jung, 1<br />
Nuno Carvalhais, 1,3 Christian Rödenbeck, 4 M. Altaf Arain, 5 Dennis Baldocchi, 6<br />
Gordon B. Bonan, 7 Alberte Bondeau, 8 Alessandro Cescatti, 9 Gitta Lasslop, 1 Anders Lindroth, 10<br />
Mark Lomas, 11 Sebastiaan Luyssaert, 12 Hank Margolis, 13 Keith W. Oleson, 7<br />
Olivier Roupsard, 14,15 Elmar Veenendaal, 16 Nicolas Viovy, 2 Christopher Williams, 17<br />
F. Ian Woodward, 11 Dario Papale 18<br />
<strong>Terrestrial</strong> gross primary production (GPP) is the largest global CO2 flux driving several ecosystem<br />
functions. We provide an observation-based estimate of this flux at 123 T 8 petagrams of carbon per<br />
year (Pg C year −1 ) using eddy covariance flux data and various diagnostic models. Tropical forests and<br />
savannahs account for 60%. GPP over 40% of the vegetated land is associated with precipitation.<br />
State-of-the-art process-oriented biosphere models used for climate predictions exhibit a large<br />
between-model variation of GPP’s latitudinal patterns and show higher spatial correlations between<br />
GPP and precipitation, suggesting the existence of missing processes or feedback mechanisms which<br />
attenuate the vegetation response to climate. Our estimates of spatially distributed GPP and its<br />
covariation with climate can help improve coupled climate–carbon cycle process models.<br />
<strong>Terrestrial</strong> plants fix carbon dioxide (CO2)<br />
as organic compounds through photosynthesis,<br />
a carbon (C) flux also known<br />
at the ecosystem level as gross primary production<br />
(GPP). <strong>Terrestrial</strong> GPP is the largest global<br />
carbon flux, and it drives several ecosystem functions,<br />
such as respiration and growth. GPP thus<br />
contributes to human welfare because it is the<br />
basis for food, fiber, and wood production. In<br />
addition, GPP, along with respiration, is one of<br />
13 AUGUST 2010 VOL 329 SCIENCE www.sciencemag.org<br />
the major processes controlling land-atmosphere<br />
CO2 exchange, providing the capacity of terrestrial<br />
ecosystems to partly offset anthropogenic<br />
CO2 emissions.<br />
Although photosynthesis at the leaf and canopy<br />
level are quite well understood, only tentative<br />
observation-based estimates of global terrestrial<br />
GPP have been possible so far. Plant- and standlevel<br />
GPP has previously been calculated as two<br />
times biomass production (1, 2), with substantial<br />
Downloaded from<br />
www.sciencemag.org on August 13, 2010
variation between biomes and sites (3–5). In the<br />
absence of direct observations, a combined GPP<br />
of all terrestrial ecosystems of 120 Pg C year −1<br />
was obtained (6) by doubling global biomass production<br />
estimates (7) without an empirical basis of<br />
spatially resolved biomass production and its relationship<br />
to GPP. A global terrestrial GPP of 100 to<br />
150PgCyear −1 is consistent with the observed<br />
variation of 18 OCO in the atmosphere (8, 9). However,<br />
the ability of 18 OCO to constrain GPP de-<br />
1<br />
Biogeochemical Model-Data Integration Group, Max Planck<br />
Institute for Biogeochemistry, 07745 Jena, Germany. 2 Laboratoire<br />
des Sciences du Climat et de L’Environnement, Institut<br />
Pierre Simon Laplace, CEA-CNRS-UVSQ, Gif-sur-Yvette, France.<br />
3<br />
Faculdade de Ciências e Tecnologia (FCT), Universidade Nova<br />
de Lisboa, Caparica, Portugal. 4 Biogeochemical Systems, Max<br />
Planck Institute for Biogeochemistry, 07745 Jena, Germany.<br />
5<br />
McMaster Centre for Climate Change, McMaster University,<br />
Hamilton, Ontario, Canada. 6 Department of Environmental Science,<br />
Policy and Management and Berkeley Atmospheric Science Center,<br />
University of California, Berkeley, CA 94720, USA. 7 National Center<br />
forAtmosphericResearch,Boulder,CO80305,USA. 8 Potsdam<br />
Institute for Climate Impact Research (PIK), 14473 Potsdam,<br />
Germany. 9 Climate Change Unit, Institute for Environment and<br />
Sustainability, European Commission, DG Joint Research Centre,<br />
Ispra, Italy. 10 Department of Earth and Ecosystem Science, Lund<br />
University, Sweden. 11 Department of Animal and Plant Sciences,<br />
University of Sheffield, Sheffield S10 2TN, UK. 12 Departement<br />
Biologie, Universiteit Antwerpen, Belgium. 13 Centre d’étude de<br />
la forêt, Faculté de foresterie, de géographie et de géomatique,<br />
Université Laval, Quebec, Canada. 14 Cirad-Persyst, UPR80,<br />
Fonctionnement et Pilotage des Ecosystémes de Plantation,<br />
Montpellier, France. 15 CATIE (Centro Agronómico Tropical de<br />
Investigación y Enseñanza), Turrialba, Costa Rica. 16 Nature<br />
Conservation and Plant Ecology Group, Wageningen University,<br />
Netherlands. 17 Graduate School of Geography, Clark University,<br />
Worcester, MA 01610, USA. 18 Department of Forest Environment<br />
and Resources, University of Tuscia, Viterbo, Italy.<br />
*To whom correspondence should be addressed. E-mail:<br />
christian.beer@bgc-jena.mpg.de<br />
Fig. 1. (A) Distributions<br />
of global GPP (Pg C year −1 )<br />
for the five data-driven approaches<br />
that are most<br />
constrained by data, their<br />
combined global GPP distribution,<br />
and the GPP<br />
distribution by the Miami<br />
model. Shown are the median<br />
(red horizontal lines),<br />
the quartiles (blue boxes),<br />
and the 2.5 and 97.5 percentiles<br />
(vertical black lines),<br />
indicating the 95% con-<br />
fidence interval. MTE is<br />
A<br />
160<br />
150<br />
140<br />
130<br />
120<br />
110<br />
100<br />
90<br />
MTE1<br />
MTE2<br />
pends critically on the isotopic imbalance between<br />
GPP and respiration, and large uncertainties remain<br />
associated with isotope fractionation processes<br />
(10). The coupled uptake of carbonyl sulfide<br />
and CO2 by plants (11, 12) could potentially be<br />
used to further constrain terrestrial GPP by the<br />
combination of atmospheric [COS] measurements<br />
with an inversion of the atmospheric transport (13)<br />
once the ratio of CO2 versus COS uptake, the additional<br />
COS deposition to soils, and the COS<br />
efflux from oceans is more precisely quantified.<br />
As an alternative to directly constraining atmospheric<br />
data to estimate GPP, local information<br />
can be built into a process-oriented biosphere<br />
model, which is then applied globally. Knowledge<br />
of radiative transfer within vegetation canopies<br />
and of leaf photosynthesis has been used to<br />
represent GPP within process-oriented biosphere<br />
models, which explicitly simulate the behavior of<br />
the ecosystem as an interaction of the system components<br />
(e.g., leafs, roots, and soil) in a reductionist<br />
or mechanistic way. If these models are designed<br />
to also simulate a changing state of the biosphere<br />
(e.g., leaf area index and carbon pools), predictions<br />
of ecosystem dynamics under changing environmental<br />
conditions can be attempted (14). However,<br />
these process-oriented models are complex combinations<br />
of scientific hypotheses; hence, their results<br />
depend on these embedded hypotheses. A<br />
complementary approach is data-oriented or diagnostic<br />
modeling where general relationships between<br />
existing data sets are first inferred at site-level<br />
and then applied globally by using global grids<br />
of explanatory variables. Particularly when dataadaptive<br />
machine learning approaches are employed<br />
(e.g., artificial neural networks), results<br />
either driven by fAPAR only (MTE1) or by both fAPAR and climate data (MTE2) (16). (B)<br />
Spatial details of the median annual GPP (gC/m 2 /a) from the spatially explicit approaches<br />
MTE1, MTE2, ANN, LUE, and KGB. (C) Latitudinal pattern (0.5° bands) of annual GPP. The<br />
gray area represents the range of the diagnostic models MTE1, MTE2, ANN, LUE, and KGB.<br />
The red area represents the range of process model results (LPJ-DGVM, LPJmL, ORCHIDEE,<br />
CLM-CN, and SDGVM). The thick lines represent the medians of both ranges. The dashed<br />
blacklineshowstheresultfornorthernextratropical regions from an independent diagnostic<br />
model. In this approach, we combined gridded information about the seasonal NEE amplitude<br />
based on atmospheric CO2 data and an inversion of atmospheric CO2 transport with<br />
empirical relationships between annual GPP and the seasonal amplitude of NEE derived at<br />
flux tower sites.<br />
ANN<br />
WUE<br />
LUE<br />
KGB<br />
All<br />
MIAMI<br />
B<br />
C<br />
GPP [gC/m 2 /a]<br />
5000<br />
4000<br />
3000<br />
2000<br />
1000<br />
are much less contingent on theoretical assumptions<br />
and can be considered as data benchmarks<br />
for process models. However, being essentially a<br />
statistical approach, the diagnostic models do lack<br />
the capacity of extrapolating to completely different<br />
conditions and hinge on the availability of sufficient<br />
data. With the advent of a global network of<br />
ecosystem-level observations of CO 2 biosphereatmosphere<br />
exchange (15) (www.fluxdata.org) and<br />
the development of new diagnostic modeling<br />
approaches, a data-oriented global estimation of<br />
GPP has become feasible. In this study, we estimate<br />
terrestrial GPP and its spatial details by diagnostic<br />
models and compare spatial correlations with climate<br />
variables to results from process-oriented models.<br />
The diagnostic modeling comprises two steps,<br />
the parametrization of GPP in relation to explanatory<br />
variables at sites and the application of the<br />
model by using gridded information about these<br />
explanatory variables. For the first step, GPP was<br />
estimated by partitioning continuous measurements<br />
of net ecosystem exchange (NEE) into GPP and<br />
ecosystem respiration at flux tower sites (16). Two<br />
flux partitioning methods were considered using<br />
night-time or day-time NEE (16). Such site-level<br />
GPP data was then used to calibrate five highly<br />
diverse diagnostic models, which relate GPP to<br />
meteorology, vegetation type, or remote sensing<br />
indices at daily, monthly, or annual time scales<br />
(16). Two of these approaches are machine learning<br />
techniques: a model tree ensemble (MTE) (17)<br />
and an artificial neural network (ANN) (18). The<br />
Köppen-Geiger cross Biome (KGB) approach is<br />
a look-up table of mean GPP per ecoregion. GPP<br />
of whole river catchment areas is estimated by the<br />
water use efficiency approach (WUE) (19, 20),<br />
Data−driven:<br />
Median<br />
Process Models:<br />
Median<br />
Individual Process<br />
Models<br />
Atmospheric<br />
Inversion<br />
0<br />
−50 −25 0 25 50 75<br />
Latitude [°]<br />
REPORTS<br />
www.sciencemag.org SCIENCE VOL 329 13 AUGUST 2010 835<br />
3500<br />
3000<br />
2500<br />
2000<br />
1500<br />
1000<br />
500<br />
0<br />
on August 13, 2010<br />
www.sciencemag.org<br />
Downloaded from
REPORTS<br />
836<br />
which combines recently derived global WUE<br />
fields with the long-term averaged evapotranspiration<br />
at the watershed scale. This is an important<br />
constraint at the global scale, but the spatial resolution<br />
is too coarse to use the WUE approach for<br />
estimating the spatial distribution of GPP. The<br />
light-use efficiency approach (LUE) (21, 22) was<br />
applied by combining in situ Bayesian calibration<br />
with an uncertainty propagation per vegetation and<br />
climate class. The Miami model (23) simply exploits<br />
the empirically obtained dependence of<br />
photosynthesis on temperature and precipitation.<br />
The second step, the mapping of flux tower GPP<br />
to the land surface, was performed by applying<br />
these diagnostic models to fields of remote sensing<br />
(24–26) and climatic data (27–29), which are now<br />
available with improved accuracy and high spa-<br />
tial resolution. In so doing, we take into account<br />
several sources of uncertainty, including uncertainty<br />
from model parametrization and from explanatory<br />
variables (16).<br />
By making use of the new data streams and<br />
the ensemble of five diagnostic models, we present<br />
an observation-based estimate of an average<br />
global terrestrial GPP of 123 Pg C year −1 during<br />
the period 1998 to 2005 (Fig. 1A). Uncertainties<br />
and preprocessing of tower CO 2 flux measurements,<br />
tower representativeness, flux partitioning<br />
into GPP, uncertainties of climate and remote<br />
sensing data sets, and structural uncertainties of<br />
the diagnostic models propagate to a global uncertainty<br />
with a 95% confidence range from 102<br />
to135PgCyear −1 or a robust estimate of standard<br />
deviation (30) of 8 Pg C year −1 . Results from the<br />
Table 1. GPP for biomes of the world as defined by Prentice et al.(6). Combining the biome extent (fig.<br />
S17) with the spatially explicit GPP distributions by the approaches MTE1, MTE2, ANN, LUE, WUE, and<br />
KGB led to the respective median GPP per unit area separately for each biome (fig. S4). These medians<br />
were then multiplied by the biome area (6, 7) (fig. S4) to estimate GPP in column 2. The estimated GPP<br />
total of 122 Pg C year −1 does not equal our overall median of 123 Pg C year −1 because the biome area<br />
definedbyfig.S17andby(6) differ slightly. The third column shows GPP as estimated by using NPP<br />
numbers from Saugier et al.(7) under the assumption that NPP/GPP = 0.5 (6).<br />
Biome<br />
GPP<br />
(Pg C year –1 )<br />
GPP = 2 × NPP*<br />
(Pg C year –1 )<br />
Tropical forests 40.8 43.8<br />
Temperate forests 9.9 16.2<br />
Boreal forests 8.3 5.2<br />
Tropical savannahs and grasslands 31.3 29.8<br />
Temperate grasslands and shrublands 8.5 14<br />
Deserts 6.4 7<br />
Tundra 1.6 1<br />
Croplands 14.8 8.2<br />
Total<br />
*Based on integrated numbers for biomes (6, 7)<br />
121.7 125.2<br />
Fig. 2. Partial correlation<br />
in the spatial domain<br />
between GPP from<br />
Fig. 1B and either (A)<br />
A Partial correlation median GPP and precipitation<br />
1<br />
B<br />
CRU precipitation, (B)<br />
CRU air temperature, or<br />
0.5<br />
(C) ECMWFERA-Interim<br />
short-wave radiation after<br />
applying a moving<br />
0<br />
4.5° by 4.5° spatial window<br />
and subsequent<br />
median filtering. Shown<br />
−0.5<br />
are significant correla-<br />
−1<br />
tions (P < 0.01) of which the correlation coefficient is higher/lower than T 0.2.<br />
C<br />
13 AUGUST 2010 VOL 329 SCIENCE www.sciencemag.org<br />
LUE approach were higher when using National<br />
Centers for Environmental Prediction (NCEP) radiation.<br />
However, we do not show NCEP-driven<br />
results because NCEP radiation and precipitation<br />
is known to be biased (31, 32). The Miami model<br />
overestimates GPP compared to other approaches,<br />
particularly in sparsely vegetated areas with strong<br />
seasonality, such as savannahs, shrublands, and tundra<br />
(16) (table S5), because it does not account<br />
for the effect of climate-independent changes in<br />
vegetation structure (e.g., degradation) and vegetation<br />
type on GPP. Indeed, residuals of this model<br />
correlate significantly with mean annual fraction<br />
of absorbed photosynthetically active radiation<br />
(fAPAR) from remote sensing (fig. S14). Hence,<br />
being a classic model, it is shown only for comparison,<br />
but results from the Miami model were<br />
not taken into account in the following analyses.<br />
Tropical forests assimilate 34% of the global<br />
terrestrial GPP (Table 1) and have the highest<br />
GPP per unit area (table S5). Savannahs account<br />
for 26% of the global GPP and are the second<br />
most important biome in terms of global GPP.<br />
The large area of savannahs (about twice the surface<br />
area of tropical forests) explain their high<br />
contribution. Moreover, the results highlight the<br />
importance of taking into account C4 vegetation<br />
in global GPP estimates. Based on the C4<br />
distribution (figs. S6 and S7), more than 20% of<br />
terrestrial GPP is conducted by C4 vegetation.<br />
Given that there were less than 20 site-years of<br />
flux data for C4-dominated ecosystems, our<br />
uncertainty is largest for this type of vegetation.<br />
Therefore, an expansion of observational networks<br />
should focus on tropical C4 ecosystems.<br />
Boreal forests show a clear longitudinal gradient<br />
in GPP in northern Eurasia where GPP in the<br />
boreal zone decreases toward the east, where<br />
Partial correlation median GPP and air temperature<br />
Partial correlation median GPP and short−wave radiation<br />
1<br />
0.5<br />
0<br />
−0.5<br />
−1<br />
1<br />
0.5<br />
0<br />
−0.5<br />
−1<br />
on August 13, 2010<br />
www.sciencemag.org<br />
Downloaded from
photosynthesis is subject to an increasingly<br />
continental climate (Fig. 1B).<br />
The latitudinal pattern derived by the different<br />
diagnostic models falls into a quite narrow range<br />
(Fig. 1C). In contrast, there is a larger range among<br />
an ensemble of five process-oriented biosphere<br />
models (Fig. 1C); in comparison to our data-oriented<br />
range, some consistently overestimate GPP, and<br />
others underestimate tropical GPP while matching<br />
or slightly overestimating GPP in the temperate<br />
zone (fig. S26). A standard global parametrization<br />
of the process-oriented models has been applied in<br />
this study; it was not optimized against flux tower<br />
GPP because we aimed at evaluating the processbased<br />
GPP fields and their correlations to climatic<br />
variables. For comparison, we show results by an<br />
additional, completely different approach of scaling<br />
GPP from flux tower sites to the regional scale<br />
(fig. S16), where a reationship between the seasonal<br />
NEE amplitude and annual GPP is derived<br />
at flux tower sites and applied to the seasonal<br />
NEE amplitude derived through atmospheric inversion<br />
[update of (33)]. This approach leads to<br />
values at the upper end of the range of the diagnostic<br />
bottom-up approaches in northern extratropical<br />
regions but is still at the lower end of the<br />
range estimated by the process-oriented models.<br />
The differences between process-oriented and<br />
data-oriented estimates could lie in human-induced<br />
degradation of GPP by land use (34). However,<br />
other reasons are possible, including insufficient<br />
model parametrization or structural model errors<br />
that lead to an overestimation of GPP.<br />
Partial correlation analyses between GPP and<br />
climatic variables for 4.5° by 4.5° moving windows<br />
show that spatial variation of GPP is associated<br />
with precipitation in 50 to 70% of the<br />
area of nontundra herbaceous ecosystems (Fig.<br />
2A and Table 2). Also, 50% of the crop production<br />
occurs in regions where photosynthesis is<br />
colimited by precipitation, stressing the importance<br />
of water availability for food security. Interestingly,<br />
GPP in the same proportion of temperate<br />
forest areas correlates positively with precipitation<br />
(Table 2). In contrast, the spatial GPP variability<br />
in only 30% of tropical and boreal forests seems<br />
to be associated positively with precipitation, but<br />
GPP of more than half of the boreal forests<br />
correlates positively with air temperature (Table<br />
2). Therefore, the GPP of these biomes seems to<br />
be robust against a moderate climate variation in<br />
the order of magnitude of the current spatial variability<br />
of climate, given the very low probability<br />
of a decrease in air temperature in the boreal zone.<br />
We find negative correlations of productivity<br />
with incoming short-wave radiation, in particular<br />
in savannahs, the Mediterranean, and Central<br />
Asian grasslands (Fig. 2C and tables S6 to S8).<br />
Table 2. Percentage of biome area for which GPP is climatically controlled, indicated by a median partial<br />
correlation coefficient higher than 0.2 (or 0.5 in brackets). Several climate grids (CRU, ECMWF ERA-<br />
Interim, and GPCP precipitation) were used to perform a partial correlation between the median GPP map<br />
(Fig. 1B) and climate variables for 4.5° by 4.5° moving windows (16). Then, the fractional area with<br />
significant (P < 0.01) partial correlation higher than 0.2 (0.5) was calculated.<br />
Biome P* controlled T† controlled R‡ controlled<br />
Tropical forests 29 (12) 39 (26) 4 (1)<br />
Temperate forests 50 (26) 41 (23) 6 (2)<br />
Boreal forests 20 (5) 55 (31) 21 (7)<br />
Tropical savannahs and grasslands 55 (31) 16 (5) 3 (0)<br />
Temperate grasslands and shrublands 69 (41) 37 (18) 6 (1)<br />
Deserts 61 (37) 18 (6) 8 (2)<br />
Tundra 24 (13) 37 (27) 32 (12)<br />
Croplands 51 (25) 28 (13) 5 (1)<br />
*Precipitation †Air temperature ‡Short-wave radiation<br />
REPORTS<br />
These negative partial correlations may indicate<br />
an additional indirect effect of radiation or temperature<br />
on GPP by the water balance. Both climatic<br />
variables are usually associated with higher<br />
evapotranspiration rates, which will yield more<br />
negative water balances with higher temperature<br />
or radiation levels with consequent negative effects<br />
on primary productivity in these water-limited regions.<br />
This interpretation is possible notwithstanding<br />
a direct effect of temperature on vegetation by<br />
heat stress as well as increased levels of diffuse<br />
radiation associated with overall lower levels of<br />
radiation (35).<br />
After four decades of research on the global<br />
magnitude of primary production of terrestrial<br />
vegetation (23, 36), we present an observationbased<br />
estimate of global terrestrial GPP. Although<br />
we arrive at a global GPP of similar magnitude as<br />
these earlier estimates, our results add confidence<br />
and spatial details. The large range of GPP results<br />
by process-oriented biosphere models indicates<br />
the need for further constraining CO2 uptake processes<br />
in these models. Furthermore, our spatially<br />
explicit GPP results contribute to a quantification<br />
of the climatic control of GPP. Complementing<br />
theoretical or process-oriented results (37, 38)<br />
about climatic limitations of GPP, our observationbased<br />
results now constitute empirical evidence<br />
for a large effect of water availability on primary<br />
production over 40% of the vegetated land (Fig. 3A)<br />
and up to 70% in savannahs, shrublands, grasslands,<br />
and agricultural areas (Table 2). Our findings<br />
imply a high susceptibility of these ecosystems’<br />
productivity to projected changes of precipitation<br />
over the 21st century (39), but a robustness of<br />
tropical and boreal forests. Results of current process<br />
models show a large range and a tendency to<br />
overestimate precipitation-associated GPP (Fig.<br />
3B). Most likely, the association of GPP and climate<br />
in process-oriented models can be improved<br />
by including negative feedback mechanisms (e.g.,<br />
adaptation) that might stabilize the systems. Our<br />
high spatial resolution GPP estimates, their uncertainty,<br />
and their relationship to climate drivers<br />
should be useful for evaluating and thus improving<br />
coupled climate–carbon cycle process models.<br />
Fig. 3. Percentage of vegetated land<br />
surface (A) and corresponding GPP (B)<br />
that is controlled by precipitation, depending<br />
on the chosen threshold for<br />
the partial correlation coefficients that<br />
signal a control of GPP by a climate factor.<br />
The blue areas represent the range<br />
of data-driven estimates (MTE1, MTE2,<br />
ANN, LUE, and KGB) using different climate<br />
sources [CRU, ECMWF ERA-Interim,<br />
andGPCP(16)]. This is compared to the<br />
range of process-oriented model results<br />
(LPJ-DGVM, LPJmL, ORCHIDEE, CLM-CN,<br />
and SDGVM) in red. Purple shows the<br />
overlapping area. The thick lines represent<br />
the medians of both ranges. For<br />
instance, GPP of about 40% of the vegetated land surface is controlled by water availability by defining a water control of GPP as a partial correlation coefficient<br />
between GPP and precipitation higher than 0.2.<br />
www.sciencemag.org SCIENCE VOL 329 13 AUGUST 2010 837<br />
on August 13, 2010<br />
www.sciencemag.org<br />
Downloaded from
REPORTS<br />
838<br />
References and Notes<br />
1. E.-D. Schulze, Flora 159, 177 (1970).<br />
2. H. Poorter, C. Remkes, H. Lambers, Plant Physiol. 94,<br />
621 (1990).<br />
3. E. H. DeLucia, J. E. Drake, R. B. Thomas, M. Gonzalez-Meler,<br />
Glob. Change Biol. 13, 1157 (2007).<br />
4. S. Luyssaert et al., Glob. Change Biol. 13, 2509 (2007).<br />
5. C. M. Litton, J. W. Raich, M. G. Ryan, Glob. Change Biol.<br />
13, 2089 (2007).<br />
6. I. C. Prentice et al., Climate Change 2001: The Scientific<br />
Basis. Contribution of Working Group I to the Third<br />
Assessment Report of the Intergovernmental Panel on<br />
Climate Change, J.Houghton,et al., Eds. (Cambridge<br />
University Press, Cambridge, 2001), pp. 183–237.<br />
7. B. Saugier, J. Roy, H. A. Mooney, <strong>Terrestrial</strong> <strong>Global</strong><br />
Productivity, J.Roy,B.Saugier,H.A.Mooney,<br />
Eds. (Academic Press, San Diego, CA, 2001).<br />
8. G. D. Farquhar et al., Nature 363, 439 (1993).<br />
9. P. Ciais et al., J. Geophys. Res. 102 (D5), 5857 (1997).<br />
10. L. Wingate et al., Proc. Natl. Acad. Sci. U.S.A. 106,<br />
22411 (2009).<br />
11. L. Sandoval-Soto et al., Biogeosciences 2, 125 (2005).<br />
12. J. E. Campbell et al., Science 322, 1085 (2008).<br />
13. P. Suntharalingam, A. J. Kettle, S. M. Montzka,<br />
D. J. Jacob, Geophys. Res. Lett. 35, L19801 (2008).<br />
14. P. Friedlingstein et al., J. Clim. 19, 3337 (2006).<br />
15. D. Baldocchi, Aust. J. Bot. 56, 1 (2008).<br />
16. Materials and methods are available as supporting<br />
material on Science Online.<br />
17. M. Jung, M. Reichstein, A. Bondeau, Biogeosciences 6,<br />
2001 (2009).<br />
18. D. Papale, R. Valentini, Glob. Change Biol. 9, 525 (2003).<br />
19. C. Beer, M. Reichstein, P. Ciais, G. D. Farquhar,<br />
D. Papale, Geophys. Res. Lett. 34, L05401 (2007).<br />
20. C. Beer et al., Glob. Biogeochem. Cycles 23, GB2018 (2009).<br />
21. J. Monteith, J. Appl. Ecol. 9, 747 (1972).<br />
22. S. W. Running, P. Thornton, R. Nemani, J. Glassy, Methods in<br />
Ecosystem Science,O.Sala,R.Jackson,H.Mooney,R.Howarth,<br />
Eds. (Springer-Verlag, New York, 2000), pp. 44–57.<br />
23. H. Lieth, Primary Productivity of the Biosphere, H. Lieth,<br />
R. H. Whittaker, Eds. (Springer-Verlag, Berlin, 1975),<br />
pp. 237–263.<br />
24. R. Myneni et al., Remote Sens. Environ. 83, 214 (2002).<br />
25. N. Gobron et al., J. Geophys. Res.-Atmos. 111 (D13),<br />
D13110 (2006).<br />
26. F. Baret et al., Remote Sens. Environ. 110, 275 (2007).<br />
27. M. New, D. Lister, M. Hulme, I. Makin, Clim. Res. 21,<br />
1 (2002).<br />
28. T. D. Mitchell, P. D. Jones, Int. J. Climatol. 25, 693 (2005).<br />
29. A. Simmons, S. Uppala, D. Dee, S. Kobayashi, ECMWF<br />
Newsletter No. 110 (European Centre for Medium-Range<br />
Weather Forecasts, Shinfield Park, Reading, UK, 2007).<br />
30. Median absolute deviation times 1.48.<br />
31. B. Fekete, C. Vorosmarty, J. Roads, C. Willmott, J. Clim.<br />
17, 294 (2004).<br />
32. M. Zhao, S. W. Running, R. R. Nemani, J. Geophys.<br />
Res.-Biogeosci. 111 (G1), G01002 (2006).<br />
33. C. Rödenbeck, S. Houweling, M. Gloor, M. Heimann,<br />
Atmos. Chem. Phys. 3, 1919 (2003).<br />
34. A. Bondeau et al., Glob. Change Biol. 13, 679 (2007).<br />
35. L. M. Mercado et al., Nature 458, 1014 (2009).<br />
36. R. H. Whittaker, G. E. Likens, Primary Productivity of the<br />
Biosphere, H. Lieth, R. H. Whittaker, Eds.<br />
(Springer-Verlag, Berlin, 1975), pp. 305–328.<br />
37. R. R. Nemani et al., Science 300, 1560 (2003).<br />
38. D. Gerten et al., Geophys. Res. Lett. 32, L21408 (2005).<br />
39. G. Meehl et al., in Climate Change 2007: The Physical Science<br />
Basis. Contribution of Working Group I to the Fourth<br />
Assessment Report of the Intergovernmental Panel on Climate<br />
Change,S.Solomonet al.,Eds.(CambridgeUniversityPress,<br />
Cambridge and New York, 2007), pp. 747–845.<br />
40. This work used eddy covariance data acquired by the FLUXNET<br />
community and in particular by the following networks:<br />
AmeriFlux [U.S. Department of Energy, Biological and<br />
Environmental Research, <strong>Terrestrial</strong> <strong>Carbon</strong> Program (DE-<br />
FG02-04ER63917 and DE-FG02-04ER63911)], AfriFlux,<br />
AsiaFlux, CarboAfrica, CarboEuropeIP, CarboItaly, CarboMont,<br />
ChinaFlux, Fluxnet-Canada (supported by CFCAS, NSERC,<br />
BIOCAP, Environment Canada, and NRCan), GreenGrass,<br />
KoFlux, LBA, NECC, OzFlux, TCOS-Siberia, and USCCC. We<br />
acknowledge the support to the eddy covariance data<br />
harmonization provided by CarboEuropeIP, FAO-GTOS-TCO,<br />
Integrated Land Ecosystem-Atmosphere Processes Study, Max<br />
<strong>Global</strong> Convergence in the<br />
Temperature Sensitivity of Respiration<br />
at Ecosystem Level<br />
Miguel D. Mahecha, 1,2 * Markus Reichstein, 1 Nuno Carvalhais, 1,3 Gitta Lasslop, 1 Holger Lange, 4<br />
Sonia I. Seneviratne, 2 Rodrigo Vargas, 5 Christof Ammann, 6 M. Altaf Arain, 7 Alessandro Cescatti, 8<br />
Ivan A. Janssens, 9 Mirco Migliavacca, 10 Leonardo Montagnani, 11,12 Andrew D. Richardson 13<br />
The respiratory release of carbon dioxide (CO2) from the land surface is a major flux in the global carbon<br />
cycle, antipodal to photosynthetic CO2 uptake. Understanding the sensitivity of respiratory processes to<br />
temperature is central for quantifying the climate–carbon cycle feedback. We approximated the sensitivity<br />
of terrestrial ecosystem respiration to air temperature (Q10) across60FLUXNETsiteswiththeuseofa<br />
methodology that circumvents confounding effects. Contrary to previous findings, our results suggest that<br />
Q10 is independent of mean annual temperature, does not differ among biomes, and is confined to values<br />
around 1.4 T 0.1. The strong relation between photosynthesis and respiration, by contrast, is highly<br />
variable among sites. The results may partly explain a less pronounced climate–carbon cycle feedback<br />
than suggested by current carbon cycle climate models.<br />
Quantifying the intensity of feedback<br />
mechanisms between terrestrial ecosystems<br />
and climate is a central challenge<br />
for understanding the global carbon cycle<br />
and a prerequisite for reliable future climate scenarios<br />
(1, 2). One crucial determinant of the<br />
climate–carbon cycle feedback is the temperature<br />
sensitivity of respiratory processes in terrestrial<br />
ecosystems (3, 4), which has been subject to<br />
much debate (5–10). On the one hand, empirical<br />
studies have found high sensitivities of soil<br />
respiration to temperature, with values of Q10<br />
(here an indicator of the sensitivity of terrestrial<br />
ecosystem respiration to air temperature) well<br />
above 2 (11, 12). Dependencies of Q10 values on<br />
mean temperatures (12, 13) have been attributed<br />
to the acclimatization of soil respiration (5), among<br />
other factors (13). On the other hand, global-scale<br />
13 AUGUST 2010 VOL 329 SCIENCE www.sciencemag.org<br />
Planck Institute for Biogeochemistry, National Science<br />
Foundation, University of Tuscia, Université Laval and<br />
Environment Canada and U.S. Department of Energy and the<br />
database development and technical support from Berkeley<br />
Water Center, Lawrence Berkeley National Laboratory,<br />
Microsoft Research eScience, Oak Ridge National Laboratory,<br />
University of California–Berkeley, and University of Virginia.<br />
Remotely sensed land cover, fAPAR, and LAI were available<br />
through the Joint Research Centre of the European<br />
Commission, the National Aeronautics and Space<br />
Administration, and the projects GLC2000 and CYCLOPES.<br />
Climate data came from the European Centre for Medium-<br />
Range Weather Forecasts, the Climate Research Unit of the<br />
University of East Anglia, and the GEWEX project GPCP. We<br />
thank Mahendra K. Karki at GMAO/NASA for extracting the<br />
MOD17 required surface meteorological variables from the<br />
GMAO reanalysis dataset and Maosheng Zhao at NTSG of<br />
University of Montana for calculating the respective daytime<br />
VPD. We further acknowledge support by the European<br />
Commission FP7 projects COMBINE and CARBO-Extreme and<br />
a grant from the Max-Planck Society establishing the MPRG<br />
Biogeochemical Model-Data Integration. C.B., D.P., M.R., P.C.,<br />
D.B., and S.L. conceived the study. C.B., C.R., D.P., E.T., M.J.,<br />
M.R., and N.C. contributed diagnostic modeling results.<br />
C.B., A.B., G.B.B., M.L., F.I.W., and N.V. contributed process<br />
model results. C.B., E.T., and M.R. performed the analysis.<br />
C.B. and M.R. wrote the manuscript. All other coauthors<br />
contributed with data or substantial input to the manuscript.<br />
Supporting Online Material<br />
www.sciencemag.org/cgi/content/full/science.1184984/DC1<br />
Materials and Methods<br />
SOM Text<br />
Figs. S1 to S34<br />
Tables S1 to S9<br />
References<br />
20 November 2009; accepted 8 June 2010<br />
Published online 5 July 2010;<br />
10.1126/science.1184984<br />
Include this information when citing this paper.<br />
models often make use of globally constant Q10<br />
values of 2 or below to generate carbon dynamics<br />
consistent with global atmospheric CO2 growth<br />
rates (3, 14, 15). Nonetheless, several models have<br />
directly included empirical dependencies of the<br />
parameterization of respiratory processes to environmental<br />
dynamics (16–18). This inclusion is<br />
questionable, given that single-site studies have indicated<br />
that factors seasonally covarying with temperature<br />
can confound the experimental retrieval<br />
1<br />
Max Planck Institute for Biogeochemistry, 07745 Jena, Germany.<br />
2<br />
Institute for Atmospheric and Climate Science, ETH Zürich,<br />
Universitätsstrasse 16, 8092 Zürich, Switzerland. 3 Faculdade de<br />
Ciências e Tecnologia, FCT, Universidade Nova de Lisboa, 2829-516<br />
Caparica, Portugal. 4 Norsk Institutt for Skog og Landskap, N-1431<br />
A˚s, Norway. 5 Department of Environmental Science, Policy and<br />
Management, University of California, Berkeley, CA 94720, USA.<br />
6<br />
Agroscope ART, Federal Research Station, Reckenholzstr. 191,<br />
CH-8046 Zürich, Switzerland. 7 McMaster Centre for Climate Change,<br />
McMaster University, Hamilton, Ontario L8S 4L8, Canada. 8 European<br />
Commission, Joint Research Center, Institute for Environment<br />
and Sustainability, I-21027 Ispra, Italy. 9 Department of Biology,<br />
University of Antwerpen, Universiteitsplein 1, 2610 Wilrijk, Belgium.<br />
10<br />
Remote Sensing of Environmental Dynamics Laboratory, DISAT,<br />
University of Milano-Bicocca, 20126 Milano, Italy. 11 Servizi Forestali,<br />
Agenzia per l’Ambiente, Provincia Autonoma di Bolzano, 39100<br />
Bolzano, Italy. 12 Faculty of Sciences and Technologies, Free University<br />
of Bozen-Bolzano, Piazza Università 1, 39100 Bolzano,<br />
Italy. 13 Harvard University Department of Organismic and<br />
Evolutionary Biology, Harvard University Herbaria, 22 Divinity<br />
Avenue, Cambridge, MA 02138, USA.<br />
*To whom correspondence should be addressed. E-mail:<br />
mmahecha@bgc-jena.mpg.de<br />
on August 13, 2010<br />
www.sciencemag.org<br />
Downloaded from