Cheese - Innovation Center for US Dairy
Cheese - Innovation Center for US Dairy
Cheese - Innovation Center for US Dairy

You also want an ePaper? Increase the reach of your titles
YUMPU automatically turns print PDFs into web optimized ePapers that Google loves.
Sustainable <strong>Cheese</strong> Production<br />
Understand<br />
the<br />
Carbon<br />
Footprint<br />
of<br />
<strong>Cheese</strong><br />
©2011 Wisconsin Milk Marketing Board, Inc.<br />
SPONSORS:<br />
University of Wisconsin-Madison<br />
College of Agricultural and Life Sciences<br />
University of Wisconsin-Extension<br />
Department of Food Science<br />
Department of Biological Systems Engineering<br />
Environmental Resources <strong>Center</strong><br />
Wisconsin <strong>Center</strong> <strong>for</strong> <strong>Dairy</strong> Research<br />
<strong>US</strong>DA Rural Development<br />
<strong>Innovation</strong> <strong>Center</strong> <strong>for</strong> U.S. <strong>Dairy</strong>
Sustainable <strong>Cheese</strong> Production<br />
Many dairy processors, farmers, and consumers<br />
are concerned with energy use and global<br />
sustainability. Energy use is directly related to the cost<br />
of production and affects dairy product profitability.<br />
Buyers and<br />
consumers want<br />
to know the<br />
environmental<br />
impact of<br />
products. Lack of<br />
knowledge or<br />
transparency<br />
about a product’s<br />
environmental<br />
impact may make<br />
a business less appealing to a consumer. Since much of<br />
the energy we use is linked to production of greenhouse<br />
gases, using less energy saves money and reduces<br />
potential climate change.<br />
WCMA/Mike Roemer Photography<br />
©2011 Wisconsin Milk Marketing Board, Inc. (both photos)<br />
2
Understand the Carbon Footprint of<br />
<strong>Cheese</strong><br />
Mill Creek <strong>Cheese</strong>, Arena WI, Courtesy of WCDR<br />
How much impact do dairy plants have on climate<br />
change? Can you reduce greenhouse gas emissions<br />
effectively and still make a quality product with a<br />
competitive price? How do you calculate the carbon<br />
footprint of a dairy plant?<br />
Recent research at the University of Wisconsin and<br />
other institutions gives us solid data to answer these<br />
questions. This publication will guide you through<br />
an understanding of the factors that influence the<br />
carbon footprint of cheese. It will help you look at<br />
your opera tion and identify ways you can lessen the<br />
amount of greenhouse gases produced during the<br />
manufacture and sale of your product. You’ll learn how<br />
to under stand, calculate and discuss the carbon<br />
footprint of cheese.<br />
3
Sustainable <strong>Cheese</strong> Production<br />
Fossil Fuel<br />
Burning<br />
7<br />
7 billion<br />
tons go in<br />
800 billion tons carbon<br />
tub represents<br />
ATMOSPHERE<br />
4 billion tons added<br />
every year<br />
Hotinski, R. 2007<br />
OCEAN<br />
LAND BIOSPHERE (net)<br />
2 + 1 = 3 billion tons go out<br />
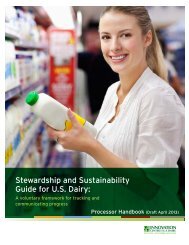
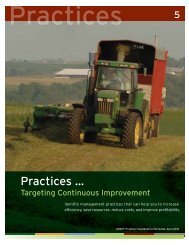
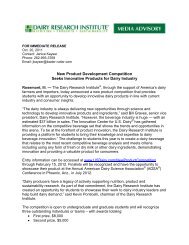
The atmosphere as a bathtub, with current annual inputs and outputs of carbon.<br />
The level in the tub is rising by about 4 billion tons per year.<br />
What is meant by<br />
“carbon footprint”?<br />
Activities such as farming, manufacturing, packaging, and<br />
transportation cause carbon dioxide (CO 2<br />
) and other gases<br />
to be released into the atmosphere. Some of these gases<br />
cause warming of the earth’s climate since they re-emit<br />
solar radiation back to the earth. These gases are called<br />
“greenhouse gases” (GHG). 1<br />
Carbon footprint is the overall amount of CO 2<br />
and other<br />
greenhouse gas emissions associated with a product. 2<br />
The carbon footprint is quantified using indicators such as<br />
the Global Warming Potential (GWP), which reflects the<br />
relative effect of a greenhouse gas in terms of climate change<br />
over time. This value expresses the overall contri bution to<br />
climate change of these emissions. 2 Levels of CO 2<br />
are<br />
increasing in the atmosphere. 3<br />
4
Understand the Carbon Footprint of<br />
<strong>Cheese</strong><br />
Greenhouse gases<br />
Greenhouse gases are gases that trap heat in the atmosphere<br />
and create a warming layer like a blanket that warms the<br />
earth. They absorb heat reflected off the earth’s surface.<br />
Some of this heat goes into space and some is emitted back<br />
to earth. Greenhouse gases occur naturally and as a result of<br />
human activities. Human activity has increased the amount<br />
of greenhouse gases, as evidenced by<br />
studies of the CO 2<br />
level in air bubbles<br />
in cores of ice <strong>for</strong>med thousands of<br />
years ago in Greenland and Antarctica.<br />
Be<strong>for</strong>e human activity, the level of CO 2<br />
in the atmosphere was never more<br />
than 300 ppm. Now it is 390 ppm, and<br />
rising by about 2 ppm every year.<br />
Earth is also warming at a rapid rate.<br />
Scientists believe a level of 350 ppm is the safe upper limit<br />
<strong>for</strong> CO 2<br />
in the atmosphere. We need to curb CO 2<br />
emission to<br />
“Greenhouse gases<br />
can be thought of as<br />
pollutants that are<br />
invisible.”<br />
prevent climate catastrophe<br />
such as the melting of the<br />
Greenland ice sheet and major<br />
flooding.<br />
Carbon dioxide is not the only<br />
greenhouse gas. Methane, nitrous oxide, ozone, and water<br />
vapor are also naturally occurring greenhouse gases. Other<br />
greenhouse gases are human-made, such chlorofluorocarbons<br />
commonly used as refrigerants and aerosol propellants. We<br />
are concerned not only with CO 2<br />
but with methane and other<br />
greenhouse gases because they have a much higher potential<br />
to warm the earth than CO 2<br />
does. Not only do greenhouse<br />
gases warm the earth, but some cause conditions which help<br />
increase the ozone hole in the upper atmosphere. Greenhouse<br />
gases can be thought of as pollutants that are invisible.<br />
everystockphoto.com<br />
5
Sustainable <strong>Cheese</strong> Production<br />
Global warming potential of<br />
greenhouse gases<br />
When thinking about greenhouse gas emissions, it is useful<br />
to think in terms of CO 2<br />
equivalents (CO 2<br />
-eq). Carbon<br />
dioxide equivalents are used to compare greenhouse gases<br />
based on their global warming potential, having CO 2<br />
as the<br />
reference value (Table 1). Methane, <strong>for</strong> example, has a CO 2<br />
equivalent of 25 in a 100 year period. If you can reduce<br />
methane emission by 100 lbs it is as if you have reduced your<br />
CO 2<br />
emission by 2,500 lbs, because methane has a much<br />
higher global warming potential than CO 2<br />
.<br />
Table 1. Greenhouse gases and their potential <strong>for</strong> global<br />
warming over a 100-year period 4,5,6<br />
Gas<br />
Formula or<br />
Designation<br />
Global warming<br />
potential, or<br />
CO 2<br />
equivalent<br />
Causes<br />
ozone<br />
depletion?<br />
Common Greenhouse Gases<br />
Carbon Dioxide CO 2<br />
1 No<br />
Methane CH 4<br />
25 No<br />
Nitrous Oxide N 2<br />
O 298 No<br />
Refrigerants<br />
Freon CFC-12 (R-12) 10,900 Yes<br />
Arcton HCFC (R-22) 1,810 Yes<br />
Genetron<br />
HFC-134a<br />
(R-134a)<br />
1,430 No<br />
Ammonia NH 3<br />
0 No<br />
Fire Extinguisher Gas<br />
Halon Halon 1301 7,140 Yes<br />
6
Understand the Carbon Footprint of<br />
<strong>Cheese</strong><br />
Are the refrigerants that leak from my<br />
cooling system greenhouse gases?<br />
Some refrigerants are greenhouse gases and some are<br />
not. Freon (R-12) and some other ozone depleting<br />
compounds have<br />
been phased out<br />
since the late<br />
1980s. Since that<br />
time we have seen<br />
the ozone hole in<br />
the Antarctic<br />
shrink, which is a<br />
good example of<br />
how human action can reverse environmental damage<br />
by making changes based on scientific evidence. Arcton<br />
(R-22) and genetron (R-134a) are greenhouse gases but<br />
ammonia is not.<br />
Babcock <strong>Dairy</strong>, UW-Madison, F. X. Milani<br />
Regulation of greenhouse gases<br />
Greenhouse gases became a federal pollutant through an<br />
EPA and Department of Transportation rule as of January 1,<br />
2011. Large emitters, over 25,000 metric tons of CO 2<br />
-eq per<br />
year, are required to report. However, there is no en<strong>for</strong>cement<br />
<strong>for</strong> reduction. Only the largest dairy plants would fall<br />
into that category. Further regulation limiting greenhouse gas<br />
emissions is politically contentious; so we expect lengthy<br />
delays in further actions.<br />
7
Sustainable <strong>Cheese</strong> Production<br />
How does this relate to<br />
cheese making?<br />
During the processes to make cheese<br />
and deliver it to the consumer, there<br />
are several potential sources of<br />
greenhouse gas emissions. The largest<br />
percentage of cheese GHG emissions<br />
occurs during milk production at the<br />
dairy farm (greater than 90%).<br />
stock.XCHNG<br />
Modern dairy practices produce about 1.2 kg CO 2<br />
-eq per<br />
kg milk, or 1.2 lbs CO 2<br />
-eq per lb of milk. 7,8 Nearly 10 pounds<br />
of milk are needed to produce one pound of cheese. Farm<br />
green house gas emissions come mostly from rumen methane,<br />
nitrous oxide from fertilizer, and methane from manure.<br />
When cows and other ruminants eat, microbes in their<br />
rumen break down the food and produce methane. This is<br />
called enteric methane, and most is expelled as burps.<br />
Enteric methane is the major single contributor to farm<br />
greenhouse gas emissions. When farmers apply fertilizer or<br />
manure to fields, nitrous oxide is emitted, another potent<br />
greenhouse gas. Nitrogen leaching and runoff into water<br />
also causes nitrous<br />
oxide to escape into<br />
the air.<br />
Farmers can lower<br />
their GHG emissions<br />
in several ways.<br />
They can alter the<br />
feed composition to<br />
reduce methane,<br />
manage fertilizer to<br />
Simone Kraatz<br />
8
Understand the Carbon Footprint of<br />
<strong>Cheese</strong><br />
limit excess nitro gen and runoff, and continue to aim <strong>for</strong><br />
more efficient milk production. Farmers can also capture<br />
manure methane and use it to make biogas in a digester.<br />
Any improvement at the dairy farm level will result in a<br />
substantive reduction in GHG emissions.<br />
<strong>Dairy</strong> manufacturing, including packaging, contributes the<br />
second highest percentage of cheese GHG (the dairy farm is<br />
the first). A dairy plant that produces a hard cheese emits about<br />
0.4 to 0.6 kg CO 2<br />
-eq/kg of cheese 9 or 0.4 to 0.6 lbs CO 2<br />
-eq/lb.<br />
The emissions resulting from this stage can vary significantly<br />
and there are a lot of ways you can reduce GHG emissions.<br />
Some factors that influence emissions at this stage are:<br />
• Type of cheese. For example, a higher moisture<br />
Monterey Jack needs less energy per pound<br />
than a drier Cheddar cheese <strong>for</strong> aging.<br />
• Length and type of aging. <strong>Cheese</strong>s that<br />
require storage at low temperatures will use<br />
more energy <strong>for</strong> refrigeration than those<br />
that do not.<br />
• Production of coproducts,<br />
such as<br />
whey cream or butter.<br />
You might be able to<br />
lower the GHG of your<br />
primary product by<br />
making a second<br />
product, thus distributing<br />
the impact over more products.<br />
• Recovery of energy from permeate. You can dramatically<br />
reduce your GHG emissions if you make heat or<br />
electricity by feeding your permeate into a digester to<br />
make biogas.<br />
©2011 Wisconsin Milk Marketing Board, Inc. (both photos)<br />
9
Sustainable <strong>Cheese</strong> Production<br />
Another, smaller percentage of<br />
GHG emissions from cheese<br />
production are CO 2<br />
emissions<br />
from the combustion of fossil fuel<br />
such as gasoline and diesel <strong>for</strong><br />
transportation, and electricity and<br />
natural gas <strong>for</strong> retail, and final use stages.<br />
The remaining GHG emissions in<br />
cheese production occur when the<br />
consumer eats the cheese and<br />
discards the packaging. If you landfill<br />
spoiled cheese or packaging, methane<br />
and CO 2<br />
are emitted.<br />
In 1995, 27% of food in the U.S. was<br />
wasted. The energy lost from producing,<br />
transporting, selling, and<br />
preparing this wasted food equals 2% of U.S. annual energy<br />
consumption. 10 Mold is a large contributor to cheese waste at<br />
the consumer level. Besides producing a better quality<br />
product, manufacturers who control mold also contribute to<br />
a better environment.<br />
©2011 Wisconsin Milk Marketing Board, Inc.<br />
everystockphoto.com<br />
Astrid Newenhouse<br />
10
Understand the Carbon Footprint of<br />
<strong>Cheese</strong><br />
What is a Life Cycle Assessment?<br />
A Life Cycle Assessment (LCA) is a value given to a product<br />
that takes into consideration all the environmental and<br />
health impacts associated with producing and using that<br />
product over its entire life cycle. It’s a way to evaluate the<br />
sustainability of a production process. The inputs and outputs<br />
of an LCA cover how the raw materials are acquired, the<br />
emissions given off, and what happens in production, use,<br />
recycling, and disposal of the product. Life Cycle Assessment<br />
is a structured, comprehensive, and internationally standardized<br />
method. 11 A related “eco-indicator” method takes into<br />
consideration a product’s impact on the ecosystem, human<br />
health, and the scarcity of raw materials. 12<br />
The life cycle GHG emissions of a kilogram of hard cheese<br />
is about 8.8 kg CO 2<br />
-eq, similar to driving a car 20 miles 13 or<br />
leaving an incandescent 100 w light bulb on <strong>for</strong> one hour.<br />
11
Sustainable <strong>Cheese</strong> Production<br />
Carbon Footprint is part of a Life<br />
Cycle Assessment<br />
The term “carbon footprint” is a value that only takes into<br />
consideration the product’s effect on greenhouse gas<br />
emissions, sometimes called “carbon emissions.” Greenhouse<br />
gas emissions are only one part of the Life Cycle Assessment<br />
in cheese production.<br />
What is a Carbon Footprint<br />
Calculator?<br />
If you know what steps go into making cheese you can<br />
calculate its carbon footprint. In the following section we<br />
illustrate a simplified calculation method. You can follow the<br />
calculations to see how we arrive at the carbon footprint of<br />
cheese or calculate the carbon footprint of your own cheese<br />
based on some of the parameters of your process. The<br />
parameters we use are based on research literature and on<br />
the cheese manufacturing process. The calculator includes<br />
choices that show what factors matter most.<br />
©2011 Wisconsin Milk Marketing Board, Inc.<br />
12
Understand the Carbon Footprint of<br />
<strong>Cheese</strong><br />
<strong>Cheese</strong> Carbon Footprint Calculator<br />
Unit Process<br />
Milk Production Impact: Average U.S. <strong>Dairy</strong> Farm<br />
(values are based on Fat and Protein Corrected Milk,<br />
FPCM, units are “kg CO 2<br />
eq per kg FPCM” (Thoma et al.).<br />
FPCM = [(0.0929)(fat% tested)+(0.05882)(protein%<br />
tested)+0.192]/[(0.0929)(4%tested)+(0.05882)<br />
(3.3%tested)+0.192]<br />
GHG emissions calculated by the “Green <strong>Cheese</strong>” Project in<br />
Wisconsin were on average 0.75 kg CO 2<br />
-eq per kg ECM<br />
(Energy Corrected Milk). The major differences in<br />
emissions are because the Green <strong>Cheese</strong> study considered<br />
best management practices <strong>for</strong> manure handling<br />
(e.g. collection and application), crop production<br />
(e.g. minimization of chemical fertilizer through manure<br />
application) and feeding efficiency; while the Thoma<br />
et.al. study used survey data to assess actual practices<br />
on farms.<br />
When considering the existence of a digester that uses<br />
manure to produce biogas, GHG emissions were further<br />
reduced up to 25%. This reduction was due to the<br />
avoided natural gas production and combustion, and to<br />
avoided CH 4<br />
emissions from manure storage. When<br />
maximizing DDGS (dried distillers grains with solubles)<br />
in the diets, the reductions in GHG emissions could<br />
reach up to another 25% due to the avoidance of<br />
gasoline production and combustion by ethanol use.<br />
Your<br />
custom<br />
calculation,<br />
running<br />
total<br />
Average<br />
<strong>for</strong> U.S.<br />
Cheddar<br />
cheese,<br />
running<br />
total<br />
1.2<br />
Cream Removal Impact: If you are removing (or<br />
adding) cream, we need to convert standard producer<br />
milk into kg CO 2<br />
eq per kg milk solids (U.S. average<br />
producer milk is 3.66% fat and 12.31% solids):<br />
kg CO 2<br />
eq per kg milk solids = 1.2/0.1231 = 9.75 kg CO 2<br />
eq<br />
per kg milk solids.<br />
(continued)<br />
1.2+0=<br />
1.2<br />
13
Sustainable <strong>Cheese</strong> Production<br />
<strong>Cheese</strong> Carbon Footprint Calculator (continued)<br />
For each 1% cream (37% fat content) removed, this<br />
removes 0.432% solids from milk. There<strong>for</strong>e:<br />
Solids milk after cream removal = 12.31 – [(____%<br />
cream removed)X(0.432)]<br />
Adjust kg CO 2<br />
eq per kg milk solids after cream removal<br />
= (9.75 kg CO 2<br />
eq per kg milk solids)X(Solids milk after<br />
cream removal)<br />
Cheddar cheese will remain at 1.2 kg CO 2<br />
eq per kg<br />
FPCM.<br />
Typical mozzarella cheese milk will have 3.25% cream<br />
removal from the producer milk be<strong>for</strong>e, so mozzarella<br />
cheese milk contains 10.91 solids. 1.06 kg CO 2<br />
eq per kg<br />
will be mozzarella cheese milk.<br />
Shipping Impact: Shipping impact is based on miles<br />
milk traveled from farm to processing plant:<br />
U.S. average is 86.75 miles (Newton 2007).<br />
Tanker holds 40,000 pounds.<br />
Semi mileage rate average is 7.3 mpg.<br />
CO 2<br />
eq per gallon diesel fuel= 22.38#. (EPA 2010)<br />
Example: Farm to plant shipping CO 2<br />
eq per kg FPCM =<br />
[(86.75/7.3)X(22.38)]/(40,000)<br />
Then convert to kg (1 lb = 0.454 kg)<br />
1.2+<br />
0.003=<br />
1.203<br />
Processing Plant Impact: There are a number of<br />
major factors with processing impacts. Main contributors<br />
are: Electric use, fuel use, caustic use, refrigerant loss,<br />
packaging use, and aging time.<br />
The majority of the emissions are related to energy use,<br />
which is mainly in the <strong>for</strong>ms of electricity <strong>for</strong> cooling,<br />
refrigeration, lighting and mechanical applications; and<br />
natural gas <strong>for</strong> thermal applications. Generally, thermal<br />
8.3<br />
14
Understand the Carbon Footprint of<br />
<strong>Cheese</strong><br />
energy use will result in less “net emissions” because<br />
the energy embedded in the production of natural gas is<br />
lower than electricity (producing electricity has lower<br />
efficiencies than generating heat, there<strong>for</strong>e more<br />
primary fuel is needed to produce the same amount of<br />
energy). Also, the emissions will be affected depending<br />
on the mix of fuels that is used to produce electricity.<br />
For example, in systems where coal is the main fuel to<br />
produce electricity the emissions will be higher than in<br />
systems that have a bigger inclusion of cleaner energies<br />
such as wind, solar, or hydro.<br />
We do not have yet all the appropriate in-factory<br />
contributions <strong>for</strong> cheese manufacture. However, we do<br />
have total factory contributions, concentration factors<br />
<strong>for</strong> making cheese and whey from milk, and energy<br />
allocations from cheese and whey.<br />
We are recommending that 0.086 kg CO 2<br />
eq per kg<br />
FPCM (FAO 2010) as the amount contribution from dairy<br />
processing and the cheese and whey allocation<br />
percentage (Feitz et al.).<br />
Cheddar manufacture kg CO 2<br />
eq per kg FPCM = (0.086<br />
kg CO 2<br />
eq per kg FPCM) X (5.1 cheese energy factor) =<br />
0.4386 kg CO 2<br />
eq per kg FPCM<br />
0.4386 kg CO 2<br />
eq per kg FPCM + 1.203 kg CO 2<br />
eq per kg<br />
FPCM = 1.64 kg CO 2<br />
eq per kg FPCM.<br />
(10 raw milk)/(1 finished cheese) X 1.64 X 50.4% solids<br />
used from milk <strong>for</strong> cheese = 8.3 kg CO 2<br />
eq per kg<br />
cheddar<br />
Whey manufacture kg CO 2<br />
eq per kg FPCM = (0.086 kg<br />
CO 2<br />
eq per kg FPCM) X (7.6 whey energy factor) = 0.6536<br />
kg CO 2<br />
eq per kg FPCM<br />
0.6536 kg CO 2<br />
eq per kg FPCM + 1.203 kg CO 2<br />
eq per kg<br />
FPCM = 1.87 kg CO 2<br />
eq per kg FPCM.<br />
(17.76 raw milk)/(1 finished whey) X 1.87 X 43.2% solids<br />
used from milk <strong>for</strong> whey = 14.3 kg CO 2<br />
eq per kg whey<br />
powder.<br />
15
Sustainable <strong>Cheese</strong> Production<br />
<strong>Cheese</strong> Carbon Footprint Calculator (continued)<br />
Shipping Distance to Retail Impact: Shipping<br />
distance to average U.S. retail (consumer):<br />
Geographic center of Wisconsin is Pittsville.<br />
Geographic population center of density <strong>for</strong> the U.S. is<br />
Edgar Springs, MO, which is 600 miles from Pittsville, WI.<br />
Distance from Edgar Springs, MO to New York City is<br />
1079 miles and to Los Angeles, CA is 1735 miles. We will<br />
credit shipping miles as not having to ship to Edgar Springs<br />
but rather as direct as ½ the distance of each leg:<br />
Average distance to average U.S. customer = (600/2) +<br />
[(1079/2)+(1735/2) / 2] = 1003 miles.<br />
Semi mileage rate average is 7.3 mpg.<br />
CO 2<br />
eq per gallon diesel fuel= 22.38#.<br />
Cheddar shipping CO 2<br />
eq per kg cheddar = [(1003/7.3)<br />
X(22.38)]/(40,000) = 0.077<br />
8.3+<br />
0.077 =<br />
8.377<br />
Total Carbon Footprint of Cheddar <strong>Cheese</strong>:<br />
Total CO 2<br />
eq per kg cheddar delivered to retail sale.<br />
It is not given here, but refrigeration, consumer travel<br />
and storage, and the disposal of the package in the landfill<br />
would also contribute to the CO 2<br />
eq per kg cheddar<br />
impact with the completion of the cradle-to-grave<br />
analysis of cheddar cheese consumption. Estimates are<br />
up to another 0.05 CO 2<br />
eq per kg cheddar cheese could<br />
be added (Berlin 2002).<br />
8.377<br />
Copyright: FX Milani, UW-Madison<br />
16
Understand the Carbon Footprint of<br />
<strong>Cheese</strong><br />
What is meant by allocation?<br />
We may soon be required to adhere to greenhouse gas<br />
emissions limits and need to be able to describe the emissions<br />
caused by making a product, such as cheese. The process of<br />
“allocation” is an important method to accurately describe<br />
the energy used and environmental impacts of producing a<br />
product. During allocation (or “partitioning”), you describe<br />
how the individual inputs and outputs of production are<br />
split up among the products and by-products. If possible,<br />
allocation should reflect the underlying physical, chemical<br />
and biological relationship between the different products. 14<br />
Allocation is a key part of a Life Cycle Assessment.<br />
As an example of LCA allocation we can look at the greenhouse<br />
gas emissions allocation of a passenger on an airline.<br />
The input of fuel consumption needs to be partitioned into<br />
the fuel used to transport the passenger and the fuel used to<br />
transport mail and cargo on the same flight. Passengers<br />
who fly coach take up less space (and there<strong>for</strong>e use fewer<br />
resources) than those flying first class.<br />
©2011 Wisconsin Milk Marketing Board, Inc.<br />
17
Sustainable <strong>Cheese</strong> Production<br />
How does energy use affect your<br />
carbon footprint?<br />
Energy used is the main driver of emissions at the processing<br />
and transportation stages. You can lower your emissions by<br />
increasing your energy efficiency or by using renewable<br />
energy with lower overall emissions. The best place to start<br />
is to improve your energy efficiency.<br />
If you reduce electricity consumption<br />
by 1 kilowatt hour you avoid the<br />
production of 3 kilowatt hours of<br />
primary energy, which come mainly<br />
from fossil fuels.<br />
Janice Kepka<br />
Typically, energy efficiency measures<br />
are the cheapest way to reduce energy<br />
costs. After improving energy efficiency,<br />
a conversion to renewable energy systems causes a dramatic<br />
reduction in greenhouse gas emissions. If you switch to renew -<br />
able energy you will lower your greenhouse gas emissions<br />
at least 90% (Table 2).<br />
Table 2. Approximate greenhouse gas emissions from<br />
different electricity generation systems 15<br />
Energy Source<br />
kg CO 2<br />
-eq/MWh<br />
Coal or Oil 1,030<br />
Natural Gas 622<br />
Anaerobic Digester 46<br />
Solar PV 39<br />
Nuclear 17<br />
Wind 14<br />
18
Understand the Carbon Footprint of<br />
<strong>Cheese</strong><br />
How does nutrient value affect carbon footprint?<br />
Typically, the carbon footprint of a food is expressed as<br />
pounds of CO 2<br />
per pound of food produced. But if we<br />
ignore the nutrient content of food we may be missing<br />
some key comparisons. On a<br />
pound <strong>for</strong> pound basis, milk,<br />
cheese, and yoghurt are very<br />
nutritious. As an example, let’s<br />
look at cow milk compared to<br />
soy milk. Compared on the<br />
basis of weight, cow milk has<br />
3 times the carbon footprint of<br />
soy milk, but when you compare them on the basis of<br />
nutrient density, cow milk has half the carbon footprint<br />
of soy milk. 16 Cow milk is more nutrient dense than soy<br />
milk. It makes a lot of sense to consider the functional<br />
unit when you talk about carbon footprint, especially the<br />
carbon footprint of food.<br />
J.S. Bailey Ltd<br />
What about recycling?<br />
Recycling can make a big impact on reducing<br />
the carbon footprint of a product. As an<br />
example, consider the blow-mold plastic used<br />
<strong>for</strong> milk gallons. If you recycle the plastic into<br />
another plastic product such as a doormat,<br />
you save the energy needed to refine that<br />
plastic from crude oil and you prevent the disposal of the<br />
plastic into a landfill. In the landfill, the plastic will produce<br />
methane as it decomposes. That methane in the atmosphere<br />
is 25 times more potent to global warming as compared to<br />
the CO 2<br />
given off if the plastic had been incinerated.<br />
Astrid Newenhouse<br />
19
Sustainable <strong>Cheese</strong> Production<br />
Environmental impacts<br />
The earth is a complex system consisting of many closely<br />
interconnected subsystems. If everything on our planet<br />
would function according to the simple principle of cause<br />
and effect, it would be possible to solve problems simply by<br />
intervening at one point. But the earth’s systems are more<br />
complex than that. As we try to solve the problem of reducing<br />
greenhouse gas emission, it is important to avoid creating<br />
Is burning wood really “green”?<br />
We think of wood as a renewable energy source because<br />
we can replenish it by growing more. While trees grow,<br />
they capture carbon from<br />
the atmosphere and<br />
energy from the sun during<br />
photo synthesis. Keep in<br />
mind that even though<br />
fossil fuels also captured<br />
carbon from photosynthesis,<br />
that occurred<br />
millions of years ago and<br />
doesn’t help us today. When biofuels are burned, they<br />
reduce the amount of carbon released to the atmosphere<br />
by greater than 80% because we give credit to account <strong>for</strong><br />
the carbon captured from the atmosphere during growth<br />
of the tree. 17 However, this amount is not 100% because<br />
burning biofuels also releases some pollutants.<br />
Audrius Meskauskas, Switzerland<br />
There is a big difference between wood versus other biofuels<br />
such as corn ethanol because of the time it takes to<br />
grow a tree. Consider <strong>for</strong> example an old oak tree. It would<br />
take this tree many years to capture the carbon, but that<br />
20
Understand the Carbon Footprint of<br />
<strong>Cheese</strong><br />
new problems. <strong>Cheese</strong> production has impacts on global<br />
warming, ozone depletion, acidification of lakes and streams,<br />
biodiversity, land use, and other environmental issues. The<br />
results of our management decisions often appear much later,<br />
are unpredictable, and can there<strong>for</strong>e not be entirely planned.<br />
We must understand cheese production as a whole to maintain<br />
environmental, social, and economic sustainability.<br />
carbon is released instantaneously when you burn the wood<br />
in your fireplace. Since we live in an age where we are adding<br />
more carbon to the atmosphere than can be absorbed<br />
by the natural carbon cycle, the impact of that carbon<br />
release is greater now. It is as if years of carbon accumulation<br />
are released to the atmosphere in an instant.<br />
The efficiency of the wood stove affects the fuel’s impact<br />
on greenhouse gases, and stoves vary greatly. Many wood<br />
heating systems may not be as efficient as fossil fuel<br />
systems. Generally, larger biofuel burning systems are<br />
more efficient than small. A fireplace wastes heat. Also,<br />
burning wood could release particulate air pollution if<br />
not combusted efficiently.<br />
If you burn wood to heat your pasteurizer you can claim<br />
a reduction in CO 2<br />
emissions if you have these factors: a<br />
high efficiency energy system, good energy conservation,<br />
optimal firebox design, and optimal flue design. You<br />
should have a regeneration configuration to recycle heat<br />
on your pasteurizer. If you know you have excellent<br />
process designs, you can support a statement that is an<br />
ethical declaration of your biofuel use and near zero<br />
carbon emission.<br />
21
Sustainable <strong>Cheese</strong> Production<br />
How does a digester make energy<br />
from waste?<br />
Organic waste contains nutrients which,<br />
when fermented by certain types of<br />
bacteria in the absence of air (anaerobic<br />
conditions), release methane and carbon<br />
dioxide. The combination of these gases<br />
from this process is named biogas. Microorganisms<br />
break down the short chain<br />
hydrocarbons, cellulose and hemicelluloses<br />
and release biogas. Biogas is composed<br />
of 60-65% CH 4<br />
, 35%-40% CO 2<br />
, trace amounts<br />
of other compounds, and has an energy content 18 of 20 to 25<br />
MJ/m3. Biogas can be used to generate heat or electricity.<br />
Anaerobic digestion is a valuable way to recover energy from<br />
organic waste with high water content, such as dairy manure.<br />
In confined herds where liquid manure is<br />
stored in lagoons, anaerobic digesters also<br />
improve nutrient and manure management,<br />
reduce odor, and decrease the population of<br />
weed seeds and pathogens in manure. The<br />
by-products of anaerobic digestion are liquids and solids, both<br />
of which can be used as fertilizers or <strong>for</strong> other purposes.<br />
Clearfleau Limited<br />
Farm-made energy<br />
With 26 on-farm bio-energy<br />
systems in operation and more<br />
on the way, Wisconsin leads the<br />
nation in converting manure<br />
into renewable energy.<br />
If you produce heat or electricity by burning methane that<br />
would otherwise have been given off from liquid manure<br />
stored in lagoons, you reduce GHG emissions in two ways.<br />
You replace a fossil fuel used to produce heat or electricity,<br />
and you convert methane into CO 2<br />
which is a less potent<br />
greenhouse gas. A Midwest study of food and beverage<br />
companies that use anaerobic digesters to make energy from<br />
their waste has recently been published. 19<br />
22<br />
Illustration source: Wisconsin Focus on Energy<br />
©2011 Wisconsin Milk Marketing Board, Inc.
Understand the Carbon Footprint of<br />
<strong>Cheese</strong><br />
You can make decisions today to<br />
reduce greenhouse gas emis sions<br />
Some of the greenhouse gas emissions occur during proces ses<br />
that are beyond our control. Other sources of greenhouse<br />
gas emissions are within our control. Along the way, you<br />
can make decisions that affect<br />
the amount of greenhouse<br />
gases given off. Here are some<br />
examples of areas where your<br />
choices can make a difference:<br />
Simple first steps to take<br />
to reduce your greenhouse<br />
gas emissions:<br />
1. Since most GHG emissions come from producing milk<br />
on the farm, keep your cheese yield as high as possible<br />
with moisture and vat optimization.<br />
2. Conduct a cleaning and pasteurization energy use audit,<br />
as these areas typically use the most energy in your<br />
plant. Remember that <strong>for</strong> every kilowatt hour saved you<br />
reduce global energy use by 3 kilowatt hours in transmission<br />
losses.<br />
3. At the retail store, are there<br />
ways to save energy? A full<br />
display case is more energy<br />
efficient than half empty, and<br />
is more appealing to customers.<br />
Keep your refrigerant<br />
systems well maintained to<br />
stop leaks and losses.<br />
©2011 Wisconsin Milk Marketing Board, Inc. ©2011 Wisconsin Milk Marketing Board, Inc.<br />
23
Sustainable <strong>Cheese</strong> Production<br />
Next steps that can further reduce your<br />
greenhouse gas emissions:<br />
1. Think about how many heat recovery projects are waiting<br />
to be done in your plant. If the air in your plant is greater<br />
than 50° F ambient, or the<br />
tempera ture of discharge flows<br />
greater than 30° F ambient to<br />
water, there should be payback<br />
<strong>for</strong> heat recovery projects.<br />
2. Are there ways to age cheese<br />
using shorter time periods?<br />
Think of adjunct (aging) starter cultures. Or less energy?<br />
Consider in-ground aging caves.<br />
3. Can you package your product with less waste?<br />
4. Design your product <strong>for</strong> less waste at the consumer level:<br />
mold control, package size, and yummy rinds.<br />
5. Try not to landfill any waste from your plant (“zero landfill”).<br />
This reduces the greenhouse gases given off at disposal.<br />
6. Look at the energy you use to transport cheese to market.<br />
Can you increase fuel efficiency or replace fossil fuels<br />
with renewable fuels?<br />
Going further to reduce<br />
greenhouse gas emissions:<br />
1. What renewable sources of energy would fit <strong>for</strong> your<br />
situation? A windmill installation if you are in a remote<br />
location? Anaerobic digestion and production of biogas<br />
from your wastewater or unwanted permeate? Does it make<br />
sense to build a digester that other regional food processing<br />
plants or farms can share? Can you add solar power and<br />
make it pay back within a reasonable amount of time?<br />
24<br />
©2011 Wisconsin Milk Marketing Board, Inc.
Understand the Carbon Footprint of<br />
<strong>Cheese</strong><br />
2. Are you aware of all the tax incentives, aid programs,<br />
manufacturers’ rebates, and government incentive programs<br />
<strong>for</strong> energy conservation and alternative energy systems?<br />
If not, please contact these agencies: Focus on Energy,<br />
EPA, Wisconsin State Energy Office, and Energy.gov.<br />
You may also contact the authors of this publication.<br />
3. Source milk from farms that have a lower carbon footprint<br />
because they use manure instead of synthetic fertilizers<br />
that require high fossil fuel energy inputs, reduce manure<br />
storage time (from collection to application) in warm<br />
weather, minimize the surface area of manure lagoons,<br />
cover manure storage lagoons, flare methane emissions<br />
from manure storage facilities or digesters, inject manure<br />
into the soil to reduce volatilization of methane and nitrous<br />
oxide, and prevent runoff into lakes and streams.<br />
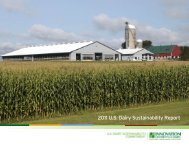
University of Wisconsin research<br />
Professor Doug Reinemann leads a “Green <strong>Cheese</strong>” research<br />
team that is creating a decision making tool <strong>for</strong> dairy farmers<br />
and dairy processors to help them calculate the energy impact<br />
of different practices they use to produce cheese. 20 For example,<br />
if a cheese plant adds an anaerobic digester, how much will<br />
that reduce the carbon footprint of the cheese? If a farmer<br />
grows and sells biofuels as part of their dairy business, how<br />
does that reduce the carbon footprint of cheese produced from<br />
the milk? Researchers from Bolivia, Brazil, and Germany are<br />
working together on the project.<br />
The researchers are (from left): Doug Reinemann, Franco Milani, Horacio Aguirre-Villegas, Simone Kraatz,<br />
Thais Passos-Fonseca and Astrid Newenhouse.<br />
25
Sustainable <strong>Cheese</strong> Production<br />
What Can Consumers Do?<br />
The biggest impact<br />
consumers can<br />
have on the carbon<br />
footprint of dairy<br />
products is not to<br />
waste food. So much<br />
energy goes into<br />
food production,<br />
packaging, transportation,<br />
and sale that with every ounce of cheese left<br />
uneaten, more than half a pound of CO 2<br />
emissions are<br />
given off. It may not sound like a lot, but it adds up.<br />
A single slice of cheese is about ¾ of an ounce. Purchase<br />
only what you think you will use. Save leftovers and<br />
regularly check the fridge so you eat what’s available.<br />
Avoid buying a special ingredient <strong>for</strong> a recipe that you will<br />
only use once. Take leftovers home from the restaurant.<br />
Teach your kids not to throw away food.<br />
©2011 Wisconsin Milk Marketing Board, Inc.<br />
Conclusion<br />
There are many ways to think about the carbon footprint<br />
of cheese and the impact cheese production has on climate<br />
change. This publication will help you get started. Life cycle<br />
assessment demonstrates a useful tool <strong>for</strong> this analysis.<br />
A focus on sustainability will lead to other benefits such as<br />
energy savings, monetary savings, and a cleaner environment.<br />
Contact the authors <strong>for</strong> more in<strong>for</strong>mation on how to calculate<br />
the carbon footprint of your cheese.<br />
26
Understand the Carbon Footprint of<br />
<strong>Cheese</strong><br />
Citations<br />
1. Carbon Footprint - What it is and How to Measure it. 2007. European Plat<strong>for</strong>m on Life Cycle<br />
Assessment, European Commission Joint Research Centre.<br />
http://lca.jrc.ec.europa.eu/Carbon_footprint.pdf<br />
2. Archer, D., Eby, M., Brovkin, V., Ridgwell, A., Cao, L., Mikolajewicz, U., Caldeira, K., Matsumoto, K.,<br />
Munhoven, G., Montenegro, A., and K. Tokos. 2009. Atmospheric Lifetime of Fossil Fuel Carbon<br />
Dioxide. Annu. Rev. Earth Planet. Sci. 37:117–34.<br />
3. Hotinski, R. 2007. Stabilization Wedges: a Concept and Game. Carbon Mitigation Initiative,<br />
Princeton, NJ. http://www.princeton.edu/~cmi<br />
4. Forster, P., V. Ramaswamy, P. Artaxo, T. Berntsen, R. Betts, D. W. Fahey, J. Haywood, J.Lean,<br />
D. C. Lowe, G. Myhre, J. Nganga, R. Prinn, G. Raga, M. Schulz, and R. Van Dorland. 2007. Changes in<br />
Atmospheric Constituents and in Radiative Forcing. In Climate Change 2007:The Physical Science<br />
Basis. Contribution of Working Group I to the Fourth Assessment Report of the Intergovernmental<br />
Panel on Climate Change. S. Solomon, D. Qin, M. Manning, Z. Chen,M. Marquis, K.B. Averyt, M.Tignor<br />
and H.L. Miller ed. Cambridge, United Kingdom and New York, NY, <strong>US</strong>A: Cambridge University Press.<br />
5. EPA, 2011. High Global Warming Potential Greenhouse Gases.<br />
http://www.epa.gov/highgwp1/scientific.html<br />
6. Carbonify.com. 2010. Carbon Dioxide Emissions Calculator. 2010.<br />
http://www.carbonify.com/carbon-calculator.htm<br />
7. Thoma, G., Popp, J., Shonnard, D.,Nutter, D., Ulrich, R., Matlock, M.,Kim, D, Neiderman, Z., East, C.,<br />
Adom, F., Kemper, N., and Mayes, A. 2010. Greenhouse Gas Emissions from Production in Fluid Milk<br />
in the <strong>US</strong>. <strong>Dairy</strong> Management, Inc., Rosemount, IL, <strong>US</strong>A.<br />
8. FAO. 2010. Greenhouse Gas Emissions from the <strong>Dairy</strong> Sector – A Life Cycle Assessment. Food and<br />
Agriculture Organization of the United Nations.<br />
9. Berlin, J., 2002. Environmental Life Cycle Assessment (LCA) of Swedish Semi-hard <strong>Cheese</strong>.<br />
International <strong>Dairy</strong> Journal, 12:939-953.<br />
10. Cuéllar, A., and Webber, M., 2010. Wasted Food, Wasted Energy: The Embedded Energy in Food<br />
Waste in the United States. Environ. Sci. Technol.,44(16):6464–6469.<br />
11. International Organization <strong>for</strong> Standardization (ISO) 14040:2006. Environmental Management -<br />
Life Cycle Assessment – Principles and Framework.<br />
12. International <strong>Dairy</strong> Federation (IDF) 2009. Environmental / Ecological Impact of the <strong>Dairy</strong> Sector:<br />
Literature Review on <strong>Dairy</strong> Products <strong>for</strong> an Inventory of Key Issues.<br />
13. EPA, 2005. Emission Facts: Greenhouse Gas Emissions from a Typical Passenger Vehicle.<br />
http://www.epa.gov/oms/climate/420f05004.htm<br />
14. International Organization <strong>for</strong> Standardization (ISO) 14044:2006 Environmental Management -<br />
Life Cycle Assessment - Requirements and Guidelines.<br />
15. Meier,P.J. 2002. Life-Cycle Assessment of Electricity Generation Systems and Applications <strong>for</strong><br />
Climate Change Policy Analysis, Ph.D. thesis, University of Wisconsin, Madison.<br />
16. Smedman, A., Lindmark Månsson, H., Drewnowski, A., and A.K. Edman. 2010. Nutrient Density of<br />
Beverages in Relation to Climate Impact. Food and Nutrition Research 54:5170.<br />
17. U.S. Energy In<strong>for</strong>mation Administration (EIA) Energy Kids. Renewable Biomass.<br />
http://www.eia.doe.gov/kids/energy.cfm?page=biomass_home-basics<br />
18. Møller, H., Sommerand, S., and B. Ahring. 2004. Methane Productivity of Manure, Straw, and Solid<br />
Fractions of Manure. Biomass and Bioenergy 26(5):485-495.<br />
19. Kramer, J. 2011. Great Lakes Region Food Industry Biogas Casebook. Energy <strong>Center</strong> of Wisconsin.<br />
http://www.ecw.org/ecwresults/261-1.pdf<br />
20. Passos-Fonseca, T., Aguirre-Villegas, H., Reinemann, D., Armentano, L., Cabrera, V., Norman, J.<br />
2010. Green <strong>Cheese</strong>: LCA of Energy Intensity and GHG Emissions of Integrated <strong>Dairy</strong>/Bio-fuels<br />
Systems in Wisconsin. ASABE Paper Number 1008719.<br />
27
Sustainable <strong>Cheese</strong> Production<br />
Understand<br />
the Carbon Footprint<br />
of C heese<br />
Authors: Horacio Aguirre-Villegas is a research assistant, Simone Kraatz is an associate<br />
research fellow, Franco Milani is an assistant professor, Astrid Newenhouse is an<br />
associate scientist, Thais Passos-Fonseca is a research assistant, and Doug Reinemann is<br />
a professor. Milani is in the Department of Food Science, College of Agricultural and Life<br />
Sciences, University of Wisconsin-Madison and University of Wisconsin-Extension,<br />
Cooperative Extension. All other authors are in the Department of Biological Systems<br />
Engineering, College of Agricultural and Life Sciences, University of Wisconsin-Madison.<br />
Reinemann is also in the University of Wisconsin-Extension, Cooperative Extension.<br />
Cooperative Extension publications are subject to peer review.<br />
This publication is available from your county UW-Extension office (www.uwex.edu/ces/cty) or<br />
from Cooperative Extension Publishing. To order, call toll-free: 1-877-947-7827 (WIS-PUBS) or<br />
visit our website: learningstore.uwex.edu. You can also contact the authors <strong>for</strong> a copy.<br />
Learning <strong>for</strong> life<br />
University of Wisconsin-Madison<br />
College of Agricultural and Life Sciences<br />
University of Wisconsin-Extension<br />
Department of Food Science<br />
Department of Biological Systems Engineering<br />
Environmental Resources <strong>Center</strong><br />
Wisconsin <strong>Center</strong> <strong>for</strong> <strong>Dairy</strong> Research<br />
<strong>US</strong>DA Rural Development<br />
<strong>Innovation</strong> <strong>Center</strong> <strong>for</strong> U.S. <strong>Dairy</strong><br />
Copyright © 2011 by the Board of Regents of the University of Wisconsin System doing business as the division of<br />
Cooperative Extension of the University of Wisconsin-Extension. All rights reserved. Send copyright inquiries to: Cooperative<br />
Extension Publishing, 432 N. Lake St., Rm. 227, Madison, WI 53706, pubs@uwex.edu.<br />
University of Wisconsin-Extension, Cooperative Extension, in cooperation with the U.S. Department of Agriculture and<br />
Wisconsin counties, publishes this in<strong>for</strong>mation to further the purpose of the May 8 and June 30, 1914, Acts of Congress.<br />
An EEO/AA employer, the University of Wisconsin-Extension, Cooperative Extension provides equal opportunities in<br />
employment and programming, including Title IX and ADA requirements. If you need this in<strong>for</strong>mation in an alternative<br />
<strong>for</strong>mat, contact Equal Opportunity and Diversity Programs, University of Wisconsin-Extension, 432 N. Lake St., Rm. 501,<br />
Madison, WI 53706, diversity@uwex.edu, phone: (608) 262-0277, fax: (608) 262-8404, TTY: 711 Wisconsin Relay.<br />
Graphic design by Jeffrey J. Strobel, UW-Extension Environmental Resources <strong>Center</strong><br />
UWEX: A3934