Download this week's charts in PDF format - TTI Inc.
Download this week's charts in PDF format - TTI Inc.
Download this week's charts in PDF format - TTI Inc.

Create successful ePaper yourself
Turn your PDF publications into a flip-book with our unique Google optimized e-Paper software.
20130409<br />
60.00<br />
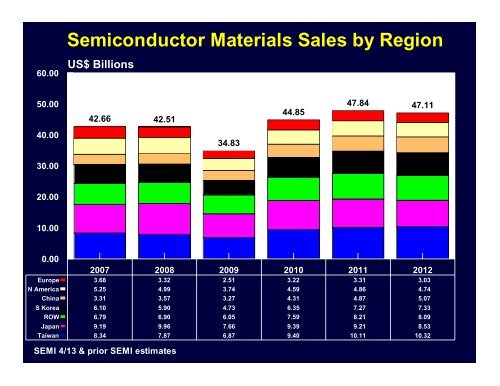
Semiconductor Materials Sales by Region<br />
US$ Billions<br />
50.00<br />
42.66 42.51<br />
44.85<br />
47.84 47.11<br />
40.00<br />
34.83<br />
30.00<br />
20.00<br />
10.00<br />
0.00<br />
2007 2008 2009 2010 2011 2012<br />
Europe 3.68 3.32 2.51 3.22 3.31 3.03<br />
N America 5.25 4.99 3.74 4.59 4.86 4.74<br />
Ch<strong>in</strong>a 3.31 3.57 3.27 4.31 4.87 5.07<br />
S Korea 6.10 5.90 4.73 6.35 7.27 7.33<br />
ROW 6.79 6.90 6.05 7.59 8.21 8.09<br />
Japan 9.19 9.96 7.66 9.39 9.21 8.53<br />
Taiwan 8.34 7.87 6.87 9.40 10.11 10.32<br />
SEMI 4/13 & prior SEMI estimates