Charts 40-52 - TTI Inc.
Charts 40-52 - TTI Inc.
Charts 40-52 - TTI Inc.

Create successful ePaper yourself
Turn your PDF publications into a flip-book with our unique Google optimized e-Paper software.
20050118Semiconductors
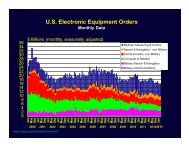
20071031Global Semiconductor Shipments3-Month Growth Rates on $ Basis1.61.43/12 Rate of Change123568101.247910.80.60.415915 915915 915915 91591 5915915 91591 5915915 915915 91591 5915915 91591 591591 5984 85 86 87 88 89 90 91 92 93 94 95 96 97 98 99 00 01 02 03 04 05 06 07Total $ Shipments from All Countries to an AreaSIA website: www.sia-online.org/
20071031100%Total Semiconductor Shipments to an AreaMonthly Shipments - Reporting Firms80%60%JapanEurope19.2%15.4%16.4%<strong>40</strong>%20%0%N AmericaAsia grows from 20%to 49% market shareAsia1 5 9 1 5 9 1 5 9 1 5 9 1 5 9 1 5 9 1 5 9 1 5 9 1 5 9 1 5 9 1 5 9 1 5 9 1 5 995 96 97 98 99 00 01 02 03 04 05 06 0749.0%SIA website: www.sia-online.org/
200710314.5Europe Semiconductor Shipments3-Month Average Shipments (US$ vs euro denominated)$ & euro (Billions)$ 3-Mon Avgeuro 3-Mon Avg2006/2005+1% in Euros3.<strong>52</strong>.51.5Model forEuropeanPCB Growth1 5 9 1 5 9 1 5 9 1 5 9 1 5 9 1 5 9 1 5 9 1 5 9 1 5 9 1 5 9 1 5 9 1 5 9 1 5 995 96 97 98 99 00 01 02 03 04 05 06 07SIA website: www.sia-online.org/
20071031Europe Semiconductor Shipments & ElectronicEquipment ProductionEuros (Billions)Semiconductors4Electronic EquipmentEuros (Billions)3025320215101501 5 9 1 5 9 1 5 9 1 5 9 1 5 9 1 5 9 1 5 9 1 5 9 1 5 999 00 01 02 03 04 05 06 070Custer Consulting Group 3/07
20050118SemiconductorFab, Assembly,Packaging,Test & MeasurementEquipment
20071116Semiconductor Fab, Test & MeasurementComposite of 14 Public CompaniesRevenue, Net <strong>Inc</strong>ome & Inventory8.0US$ Billions @ fluctuating exchange+3%6.04.02.00.0-2.03 4 1 2 3 4 1 2 3 4 1 2 3 4 1 2 3 4 1 2 3 4 1 2 3 4 1 2 300 01 02 03 04 05 06 07Revenue 7.6 6.9 6.5 5.4 4.5 3.8 3.9 4.3 4.7 3.9 4.0 4.1 4.34.8 5.7 6.3 6.3 5.6 5.6 5.5 5.3 5.5 6.1 6.6 6.5 6.2 6.4 6.7 6.7<strong>Inc</strong>ome 1.0 0.6 0.7 0.0-0.0-0.5-0.3-0.2-0.4-1.0-0.3-1.6-0.10.2 0.7 0.8 0.8 0.1 0.5 0.4 0.4 3.3 0.7 1.1 1.0 0.8 0.8 1.0 0.9Inventory 4.5 5.5 5.2 4.8 4.4 4.0 3.9 3.9 3.8 3.6 3.4 3.2 3.03.2 3.4 3.6 3.7 3.7 3.5 3.4 3.3 3.1 3.2 3.5 3.5 3.8 3.7 3.7 3.6Applied Materials, KLA-Tencor, Novellus Systems, Agilent Technologies, BTU International, FEI Co,IBIS Tech, Kulicke & Soffa, MKS Instruments, ST Assembly Test Services, Teradyne, UltratechStepper,
20071114120 %Wafer Fab Utilization RatesEstimated % of World IC Capacity Used1008089.1 90.9 93.9 94.6 95 96.4 92.880.8 81.7 84.5 83.977.373.264.2 65.987 86.381.5 82.8 85.9 88.3 91.9 93.4 95.4 92.786 84.889.1 90.1 91.8 89.5 91.2 88.5 86.4 87.5 89.7 89.660<strong>40</strong>2003 4 1 2 3 4 1 2 3 4 1 2 3 4 1 2 3 4 1 2 3 4 1 2 3 4 1 2 3 4 1 2 3 4 1 2 398 99 00 01 02 03 04 05 06 07www.sia-online.org/, www.eeca.org/Semiconductor International Capacity Statistics (SICAS)
20071116Global Semiconductor & Semiconductor Capital Equipment3-Month Shipment Growth Rates on $ Basis2.82.62.42.221.81.61.41.210.80.60.43/12 Rate of ChangeSemiconductorsSEMI Capital EquipSeries 5Capital EquipmentChips0.2159 1591591 591591 591591 591591 5915915 915915 915915 9159159 159159 159159 15915984 85 86 87 88 89 90 91 92 93 94 95 96 97 98 99 00 01 02 03 04 05 06 07Sources: SIA; Semiconductor Equipment Association of Japan
20070711Worldwide Semiconductor Capital Spending70.0 $ Billions50.048.5 47.260.056.3 57.1 54.659.854.6 58.6<strong>40</strong>.030.030.120.010.00.02003 2004 2005 2006 2007 2008 2009 2010 2011Other Capital Spending 7.0 10.6 13.1 14.4 13.5 10.8 11.7 11.5 10.0Automated Test Equip 3.0 4.8 3.8 4.1 3.9 4.2 4.4 3.8 4.7Packaging & Assembly Equip 3.3 4.8 4.4 5.2 5.0 5.3 5.5 4.9 5.7Gartner 10/2007Wafer Fab Equip 16.8 28.4 26.0 32.6 34.7 34.3 38.2 34.4 38.1
20050118PassiveComponents
20050118