Charts 40-52 - TTI Inc.
Charts 40-52 - TTI Inc.
Charts 40-52 - TTI Inc.
SHOW LESS

You also want an ePaper? Increase the reach of your titles
YUMPU automatically turns print PDFs into web optimized ePapers that Google loves.
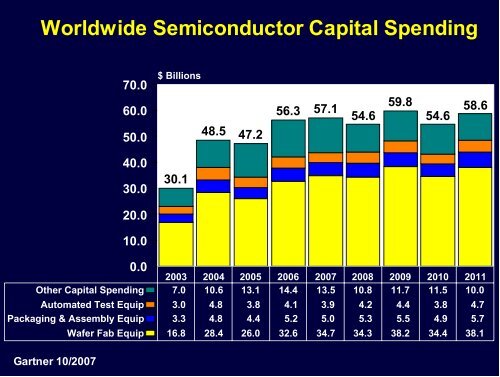
20070711Worldwide Semiconductor Capital Spending70.0 $ Billions50.048.5 47.260.056.3 57.1 54.659.854.6 58.6<strong>40</strong>.030.030.120.010.00.02003 2004 2005 2006 2007 2008 2009 2010 2011Other Capital Spending 7.0 10.6 13.1 14.4 13.5 10.8 11.7 11.5 10.0Automated Test Equip 3.0 4.8 3.8 4.1 3.9 4.2 4.4 3.8 4.7Packaging & Assembly Equip 3.3 4.8 4.4 5.2 5.0 5.3 5.5 4.9 5.7Gartner 10/2007Wafer Fab Equip 16.8 28.4 26.0 32.6 34.7 34.3 38.2 34.4 38.1