
Create successful ePaper yourself
Turn your PDF publications into a flip-book with our unique Google optimized e-Paper software.
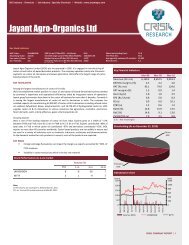
GICS Industry : Machinery l Sub Industry : Industrial Machinery l Website : www.jp-igarashi.com<br />
<strong>Igarashi</strong> <strong>Motors</strong> <strong>India</strong> <strong>Limited</strong><br />
Key Stock Indicators<br />
<strong>NSE</strong> Ticker : IGARASHI<br />
Bloomberg Ticker : IGM:IN<br />
Face value / Share: 10.0<br />
Div. Yield (%): 0.0<br />
CMP (as on 13 Apr 2011—Rs/share): 64.4<br />
52-week range up to 13 Apr 2011 (Rs)(H/L): 99.7/43.4<br />
Market Cap as on 13 Apr 2011 (Rs mn): 893<br />
Enterprise Value as on 13 Apr 2011 (Rs mn): 1,566<br />
Div. Yield (%): 0.0<br />
Shares outstanding (mn) : 13.9<br />
Free Float (%) : 37.0<br />
Average daily volumes (12 months) : 27,923<br />
Beta (2 year) : 1.2<br />
<strong>Igarashi</strong> <strong>Motors</strong> <strong>India</strong> <strong>Limited</strong> (IMIL) was established in 1993 as CG <strong>Igarashi</strong> <strong>Motors</strong> Ltd, a joint<br />
venture between Crompton Greaves Ltd (CGL), <strong>Igarashi</strong> Electric Works (IEW), Japan and <strong>Igarashi</strong><br />
Electric Works (H.K) <strong>Limited</strong>, Hong Kong. IMIL is engaged in development, production and sale of<br />
small, permanent magnet DC motors and gear motors with accessory mainly for the automotive<br />
sector. The company also provides assembly services like end cap /case / armature.<br />
KEY HIGHLIGHTS<br />
Strong parent support<br />
<strong>Igarashi</strong> Electric Works Ltd., Japan, IMIL’s parent company has an international presence with sales<br />
offices, manufacturing facilities, and distribution centers worldwide. The company has sales offices<br />
located in Japan, USA, Germany and Hong Kong. It also has manufacturing facilities spread across<br />
geographies in Japan, <strong>India</strong> and China. During FY10, IMIL’s 45% revenue came from USA, 17% from<br />
Europe and 38% from Asia.<br />
Substantial stake acquired by Agile Electric Drives Technologies and Holdings Private <strong>Limited</strong><br />
(Agile)<br />
Agile has executed a share purchase agreement on December 6, 2010 with IEW the promoter<br />
company of the IMIL for the acquisition from IEW of 48,56,034 Equity Shares of Rs.10/- each fully<br />
paid up, constituting 35% of the present issued, subscribed and paid-up share capital of IMIL at a<br />
price of Rs. 60.74 each. Further, through open offer Agile has acquired 27.9% stake in the company.<br />
Agile’s total stake in IMIL as on March 2011 stands at 62.9%. Agile was incorporated in 2003 at<br />
Chennai; it is engaged in the business of manufacturing of motor sub-assembly and precision<br />
components, and provides motor technology.<br />
Key Financial Indicators<br />
Mar-08 Mar-09 Mar-10<br />
Revenue (Rs mn) 2,785.0 2,616.4 1,611.2<br />
EBITDA margins (%) 1.1 -3.0 12.3<br />
PAT (Rs mn) 96.3 -602.9 27.3<br />
PAT margins(%) 3.5 -23.0 1.7<br />
Gearing (x) 1.9 5.7 3.5<br />
EPS (Rs/share) 6.9 -43.5 2.0<br />
PE (x) 7.6 n.m 32.7<br />
P/BV (x) 0.9 0.8 3.8<br />
RoCE (%) 12.0 n.m 10.7<br />
RoE (%) 12.7 n.m 12.8<br />
EV/EBITDA (x) 62.1 n.m<br />
n.m. : Not meaningful<br />
7.9<br />
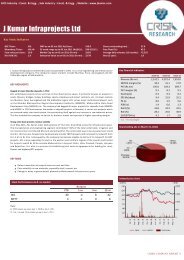
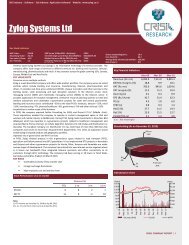
Shareholding (As on March 31, 2011)<br />
Others<br />
37%<br />
Established joint venture with Bosch<br />
IMIL and Robert Bosch GmbH have established a joint venture in February 2008 for developing,<br />
manufacturing and selling DC motors and systems for wiper, Heating, Ventilating, and Air<br />
Conditioning (HVAC), engine cooling and window lift applications for the <strong>India</strong>n automotive market.<br />
The joint venture is headquartered in Chennai, <strong>India</strong>, with a 51% shareholding of Bosch in the joint<br />
venture and 49% of IMIL. During FY10, the company invested an additional amount of Rs.19 million<br />
in the Joint Venture with Bosch Electrical Drives <strong>India</strong> Private <strong>Limited</strong>.<br />
KEY RISKS<br />
• Dependency on performance of auto industry<br />
• Fluctuation in foreign exchange as exports contributed ~77% of FY10 revenue. The<br />
Promoter<br />
63%<br />
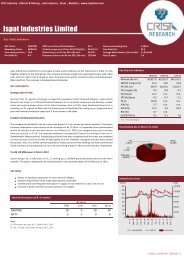
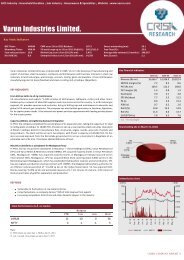
Indexed price chart<br />
company also imports ~89% of raw material consumption<br />
• Volatile prices of ferrous and Non-ferrous raw materials<br />
Stock Performances vis-à-vis market<br />
Returns (%)<br />
YTD 1-m 3-m 12-m<br />
IGARASHI 40 -3 -11 17<br />
NIFTY 12 7 3 11<br />
(index)<br />
200<br />
180<br />
160<br />
140<br />
120<br />
100<br />
80<br />
60<br />
40<br />
20<br />
0<br />
Apr-10<br />
May-10<br />
Jun-10<br />
Jul-10<br />
Aug-10<br />
Sep-10<br />
Oct-10<br />
Nov-10<br />
Dec-10<br />
Jan-11<br />
Feb-11<br />
Mar-11<br />
('000)<br />
700<br />
600<br />
500<br />
400<br />
300<br />
200<br />
100<br />
0<br />
Note:<br />
1) YTD returns are since Apr 01, 2010 to Apr 13, 2011.<br />
2) 1-m, 3-m and 12-m returns are up to Apr 13, 2011.<br />
Volumes (RHS) IGARASHI NIFTY<br />
CRISIL COMPANY REPORT | 1
<strong>Igarashi</strong> <strong>Motors</strong> <strong>India</strong> <strong>Limited</strong><br />
BACKGROUND<br />
IMIL was promoted as a joint venture between Crompton Greaves Ltd (CGL), <strong>Igarashi</strong> Electric Works (IEW), Japan and <strong>Igarashi</strong> Electric Works (H.K) <strong>Limited</strong>, Hong Kong.<br />
During 2003, CGL divested its holding in favour of IEW following which the company changed its name to present one. IMIL is engaged in the business of assembling DC<br />
motors and actuation system for various automotive and non automotive applications and manufacturing sub assemblies that go into a DC motor. The company has its<br />
manufacturing plant in Chennai , <strong>India</strong>. The company has an installed capacity to produce 9 million numbers of electric micro motors as on March 2010. During FY10, the<br />
company produced 7,854,211 numbers of electric micro motors as against 6,677,856 produced in FY09. During FY10, the company earned ~77% of its revenue from exports<br />
and ~23% from domestic sales.The company’s subsidiaries include <strong>Igarashi</strong> Electric Works (H K) Ltd, <strong>Igarashi</strong> Motor Sales LLC, <strong>Igarashi</strong> Motoren GMBH, and Agile Electric<br />
Drives Technologies and Holdings Pvt Ltd. The company’s associate companies include IJT Plastics & Tools Pvt. Ltd., Agile Electric Sub Assembly Pvt. Ltd. and Agile Electric<br />
Technologies Pvt. Ltd. As on 31st March, 2010 the company employed 396 employees. Recently the company has been nominated as a Lead Supplier for an <strong>Igarashi</strong> ETC<br />
Motor for the Global USCAR platforms which will be a growth driver for the future with several existing and New Tier One customers across several car platforms.<br />
COMPETITIVE POSITION<br />
Peer Comparison<br />
Particulars<br />
<strong>Igarashi</strong> <strong>Motors</strong><br />
<strong>India</strong> <strong>Limited</strong> KEI Industries Ltd.<br />
Lloyd Electric &<br />
Engineering Ltd<br />
Transformers & Rectifiers<br />
(india) Ltd<br />
PeriodEndsOn Mar-10 Mar-10 Mar-10 Mar-10<br />
Revenue (Rs mn) 1,611.2 9,096.8 8,187.1 5,230.3<br />
EBITDA margins (%) 12.3 6.9 10.0 16.6<br />
PAT (Rs mn) 27.3 142.3 338.1 520.8<br />
PAT margins(%) 1.7 1.6 4.1 10.0<br />
Gearing (x) 3.5 1.7 0.7 0.4<br />
EPS (Rs/share) 2.0 2.2 10.9 40.3<br />
PE (x) 32.7 11.3 6.0 6.9<br />
P/BV (x) 3.8 0.7 0.5 1.2<br />
RoCE (%) 10.7 10.3 9.9 24.1<br />
RoE (%) 12.8 6.8 9.1 19.1<br />
EV/EBITDA (x) 7.9 7.9 5.3 3.4<br />
n.m: Not meaningful<br />
FINANCIAL PROFILE<br />
Higher operating profit brought company into black in FY10<br />
Top line for IMIL has continued to show a downward trend in the last 2 years. For<br />
FY10, the revenue dropped by ~38 % to Rs. 1.6 billion in FY10 as against Rs. 2.6<br />
billion in FY09. Decrease in revenue was on account of slowdown in global<br />
automotive industry as a result of the 2008 recession. The company earns majority<br />
of its revenue from exports; out of which more than 60% came from USA and Europe<br />
where the impact of slowdown was rampant.<br />
Higher margins on trading business and better control over inventory cost has<br />
improved EBITDA margins to 12.3% in FY10.<br />
PAT turned positive to Rs. 27.3 million in FY10 from a net loss of Rs. 602.9 million<br />
reported in FY09. This was due to better operational performance coupled with<br />
lower interest and depreciation cost. The company reported higher net loss in FY09<br />
because of Rs. 415.10 million of foreign exchange losses.<br />
Key Financial Indicators<br />
Units Mar-08 Mar-09 Mar-10<br />
Revenue Rs million 2,785.0 2,616.4 1,611.2<br />
EBITDA margins Per cent 1.1 -3.0 12.3<br />
PAT Rs million 96.3 -602.9 27.3<br />
PAT margins Per cent 3.5 -23.0 1.7<br />
Revenue growth Per cent 11.1 -6.1 -38.4<br />
EBITDA growth Per cent -78.9 n.m n.m<br />
PAT growth Per cent 58.5 n.m n.m<br />
Gearing Times 1.9 5.7 3.5<br />
RoCE Per cent 12.0 n.m 10.7<br />
RoE Per cent 12.7 n.m 12.8<br />
INDUSTRY PROFILE<br />
Auto Component<br />
The auto components industry production, in <strong>India</strong>, is estimated at around Rs 1212 billion in 2009-10. The industry has been reducing its dependence on the domestic<br />
automobile industry over the long term; it also continues to maintain its ability of being cost-competitive and technically proficient in niche segments. These factors along<br />
with foray of <strong>India</strong>n auto component players in the international markets through acquistions have enhanced the industry`s popularity among international original<br />
equipment manufacturers (OEMs) in terms of their outsourcing needs. Currently, domestic OEMs account for around 67% of the total auto component production off take,<br />
whereas the replacement and export segments account for around 21% and 12%, respectively. The industry is largely fragmented with over 558 players operating in the<br />
organised segment and many unorganised players catering to the replacement demand. However, with auto OEMs adopting vendor rationalisation, proportion of the<br />
organised segment is likely to increase over the long term. In the long term, exports are expected to grow at a faster pace as global OEMs are expected to implement cost<br />
rationalisation strategies by increasing their sourcing from low cost regions. The bargaining power of players is moderate with OEM's and has been historically high in the<br />
replacement market. The technological edge of a particular auto component segment determines the bargaining power of its players. Further, players with higher<br />
exposure to replacement segment are able to have better margins given higher bargainning power in the segment. However, increasing competition from imports is<br />
impacting the ability to pass on input cost increases in replacement market as well.<br />
CRISIL COMPANY REPORT | 2
<strong>Igarashi</strong> <strong>Motors</strong> <strong>India</strong> <strong>Limited</strong><br />
ANNUAL RESULTS<br />
Income Statement<br />
Balance sheet<br />
(Rs million ) Mar-08 Mar-09 Mar-10 (Rs million ) Mar-08 Mar-09 Mar-10<br />
Net Sales 2,740.2 2,578.1 1,587.1 Equity share capital 138.7 138.7 138.7<br />
Operating Income 2,785.0 2,616.4 1,611.2 Reserves and surplus 660.8 55.1 93.3<br />
Tangible net worth 799.6 193.9 232.0<br />
EBITDA 31.3 -77.8 198.3 Deferred tax liablity:|asset| 67.5 82.3 92.7<br />
EBITDA Margin 1.1 -3.0 12.3 Long-term debt 323.7 476.0 553.5<br />
Short-term-debt 992.3 535.2 149.2<br />
Depreciation 106.1 83.5 64.8 Total debt 1,316.1 1,011.2 702.7<br />
Interest 133.6 569.6 96.8 Current liabilities 704.7 465.6 505.4<br />
Other Income 44.8 144.1 0.9 Total provisions 75.2 9.0 8.1<br />
Total liabilities 2,963.1 1,762.0 1,540.9<br />
PBT 123.4 -586.8 37.6 Gross block 1,143.7 1,133.1 1,165.0<br />
PAT 96.3 -602.9 27.3 Net fixed assets 1,000.0 876.2 835.2<br />
Investments 134.1 124.3 143.3<br />
PAT Margin 3.5 -23.0 1.7 Current assets 1,829.0 761.5 562.5<br />
Receivables 666.0 323.2 227.1<br />
No. of shares (Mn No.) 13.9 13.9 13.9 Inventories 332.8 159.1 136.5<br />
Cash 101.1 40.8 29.9<br />
Earnings per share (EPS) 6.9 -43.5 2.0 Total assets 2,963.1 1,762.0 1,541.0<br />
Cash flow<br />
Ratio<br />
(Rs million ) Mar-08 Mar-09 Mar-10 Mar-08 Mar-09 Mar-10<br />
Pre-tax profit -163.5 -586.8 37.6 Revenue growth (%) 11.1 -6.1 -38.4<br />
Total tax paid -34.0 -1.3 0.0 EBITDA growth(%) -78.9 n.m n.m<br />
Depreciation 106.1 83.5 64.8 PAT growth(%) 58.5 n.m n.m<br />
Change in working capital -443.7 702.0 227.0<br />
EBITDA margins(%) 1.1 -3.0 12.3<br />
Cash flow from operating activities -535.1 197.4 329.4 Tax rate (%) 27.5 n.m 0.0<br />
Capital Expenditure -118.1 37.4 -12.9 PAT margins (%) 3.5 -23.0 1.7<br />
Investments and others -60.8 9.8 -19.0<br />
Dividend payout (%) 21.6 0.0 0.0<br />
Dividend per share (Rs) 1.5 0.0 0.0<br />
Cash flow from investing activities -178.9 47.2 -31.9 BV (Rs) 57.6 14.0 16.7<br />
Equity raised/(repaid) 0.0 0.0 0.0 Return on Equity (%) 12.7 n.m 12.8<br />
Debt raised/(repaid) 453.9 -304.9 -308.5 Return on capital employed (%) 12.0 n.m 10.7<br />
Dividend (incl. tax) -24.3 0.0 0.0<br />
Others (incl extraordinaries) 287.0 0.0 0.0 Gearing (x) 1.9 5.7 3.5<br />
Interest coverage (x) 0.2 n.m 2.0<br />
Debt/EBITDA (x) 42.1 n.m 3.5<br />
Cash flow from financing activities 716.6 -304.9 -308.5<br />
Change in cash position 2.6 -60.3 -11.0 Asset turnover (x) 2.4 2.3 1.4<br />
Opening cash 98.6 101.1 40.8 Current ratio (x) 1.0 0.8 0.9<br />
Closing cash 101.1 40.8 29.9 Gross current assets (days) 156 106 127<br />
n.m : Not meaningful;<br />
QUARTERLY RESULTS<br />
Profit and loss account<br />
(Rs million) Dec-10 % of Rev Dec-09 % of Rev Sep-10 % of Rev Dec-10 % of Rev Dec-09 % of Rev<br />
No of Months 3 3 3 9 9<br />
Revenue 527.8 100.0 450.8 100.0 460.8 100.0 1,451.9 100.0 1,155.2 100.0<br />
EBITDA 76.4 14.5 59.7 13.2 69.1 15.0 208.3 14.3 103.8 9.0<br />
Interest 26.6 5.0 21.8 4.8 25.2 5.5 73.6 5.1 69.8 6.0<br />
Depreciation 25.8 4.9 16.3 3.6 30.8 6.7 78.7 5.4 48.7 4.2<br />
PBT 24.1 4.6 21.6 4.8 13.1 2.8 55.9 3.9 (14.7) (1.3)<br />
PAT 26.3 5.0 21.3 4.7 17.1 3.7 64.1 4.4 (15.7) (1.4)<br />
CRISIL COMPANY REPORT | 3
<strong>Igarashi</strong> <strong>Motors</strong> <strong>India</strong> <strong>Limited</strong><br />
FOCUS CHARTS & TABLES<br />
Rs mn<br />
1,200<br />
1,000<br />
800<br />
600<br />
400<br />
200<br />
0<br />
Quarterly sales & y-o-y growth<br />
Per cent<br />
80<br />
60<br />
40<br />
20<br />
0<br />
-20<br />
-40<br />
-60<br />
-80<br />
Rs mn<br />
200<br />
150<br />
100<br />
50<br />
0<br />
-50<br />
-100<br />
-150<br />
-200<br />
-250<br />
Quarterly PAT & y-o-y growth<br />
Per cent<br />
1,000<br />
0<br />
-1,000<br />
-2,000<br />
-3,000<br />
-4,000<br />
-5,000<br />
-6,000<br />
-7,000<br />
-8,000<br />
Mar-08<br />
Jun-08<br />
Sep-08<br />
Dec-08<br />
Mar-09<br />
Jun-09<br />
Sep-09<br />
Dec-09<br />
Mar-10<br />
Jun-10<br />
Sep-10<br />
Dec-10<br />
Mar-08<br />
Jun-08<br />
Sep-08<br />
Dec-08<br />
Mar-09<br />
Jun-09<br />
Sep-09<br />
Dec-09<br />
Mar-10<br />
Jun-10<br />
Sep-10<br />
Dec-10<br />
Sales<br />
Sales growth y-o-y (RHS)<br />
Net Profit<br />
Net profit growth y-o-y (RHS)<br />
Rs/share<br />
5<br />
0<br />
-5<br />
-10<br />
-15<br />
-20<br />
Jun-08<br />
Sep-08<br />
Dec-08<br />
Mar-09<br />
Jun-09<br />
EPS<br />
Sep-09<br />
Dec-09<br />
Mar-10<br />
Jun-10<br />
Sep-10<br />
Dec-10<br />
Per cent<br />
30<br />
20<br />
10<br />
0<br />
-10<br />
-20<br />
-30<br />
-40<br />
-50<br />
-60<br />
-70<br />
Jun-08<br />
Movement in operating and net margins<br />
Sep-08<br />
Dec-08<br />
Mar-09<br />
Jun-09<br />
Sep-09<br />
Dec-09<br />
Mar-10<br />
Jun-10<br />
Sep-10<br />
OPM<br />
NPM<br />
Dec-10<br />
Shareholding Pattern (Per cent)<br />
Jun 2010 Sep 2010 Dec 2010 Mar 2011<br />
Promoter 60.0 60.0 60.0 62.9<br />
FII - - 0.3 -<br />
DII - - - -<br />
Others 40.0 40.0 39.7 37.1<br />
Board of Directors<br />
Director Name<br />
Kewal Krishan Nohria (Dr.)<br />
Mukund Padbhanabhan (Mr.)<br />
Chandra Prakash Dusad (Mr.)<br />
Kazuharu <strong>Igarashi</strong> (Mr.)<br />
Keiichi <strong>Igarashi</strong> (Mr.)<br />
Tadaharu <strong>Igarashi</strong> (Mr.)<br />
Gopalasamudram Narayana<br />
Mani (Mr.)<br />
Designation<br />
Non-Executive Chairman<br />
Managing Director<br />
Non-Executive Director<br />
Promoter-Director<br />
Promoter-Director<br />
Promoter-Director<br />
Non-Executive Director<br />
Additional Disclosure<br />
This report has been sponsored by <strong>NSE</strong> - Investor Protection Fund Trust (<strong>NSE</strong>IPFT).<br />
Disclaimer<br />
This report is based on data publicly available or from sources considered reliable. CRISIL Ltd. (CRISIL) does not represent that it is accurate or complete and hence, it should not be relied upon as<br />
such. The data / report is subject to change without any prior notice. Opinions expressed herein are our current opinions as on the date of this report. Nothing in this report constitutes investment,<br />
legal, accounting or tax advice or any solicitation, whatsoever. The subscriber / user assume the entire risk of any use made of this data / report. CRISIL especially states that, it has no financial<br />
liability whatsoever, to the subscribers / users of this report. This report is for the personal information only of the authorised recipient in <strong>India</strong> only. This report should not be reproduced or<br />
redistributed or communicated directly or indirectly in any form to any other person – especially outside <strong>India</strong> or published or copied in whole or in part, for any purpose.<br />
CRISIL is not responsible for any errors and especially states that it has no financial liability whatsoever to the subscribers / users / transmitters / distributors of this report. For information please<br />
contact 'Client Servicing' at +91-22-33423561, or via e-mail: clientservicing@crisil.com.<br />
CRISIL COMPANY REPORT | 4