Economic Analysis of Rice Crop Cultivation in District Swat Anwar ...
Economic Analysis of Rice Crop Cultivation in District Swat Anwar ...
Economic Analysis of Rice Crop Cultivation in District Swat Anwar ...

Create successful ePaper yourself
Turn your PDF publications into a flip-book with our unique Google optimized e-Paper software.
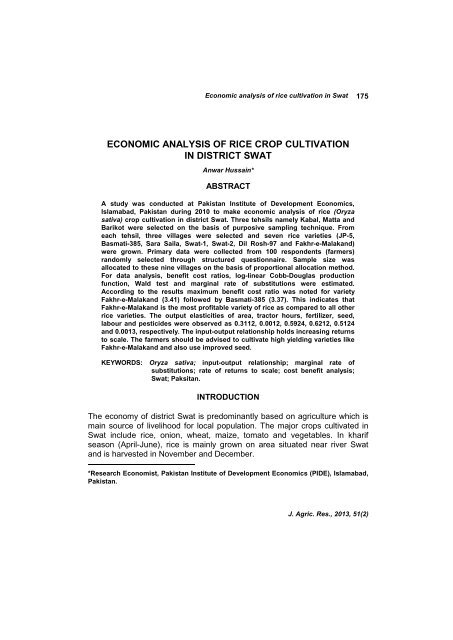
<strong>Economic</strong> analysis <strong>of</strong> rice cultivation <strong>in</strong> <strong>Swat</strong><br />
175<br />
ECONOMIC ANALYSIS OF RICE CROP CULTIVATION<br />
IN DISTRICT SWAT<br />
<strong>Anwar</strong> Hussa<strong>in</strong>*<br />
ABSTRACT<br />
A study was conducted at Pakistan Institute <strong>of</strong> Development <strong>Economic</strong>s,<br />
Islamabad, Pakistan dur<strong>in</strong>g 2010 to make economic analysis <strong>of</strong> rice (Oryza<br />
sativa) crop cultivation <strong>in</strong> district <strong>Swat</strong>. Three tehsils namely Kabal, Matta and<br />
Barikot were selected on the basis <strong>of</strong> purposive sampl<strong>in</strong>g technique. From<br />
each tehsil, three villages were selected and seven rice varieties (JP-5,<br />
Basmati-385, Sara Saila, <strong>Swat</strong>-1, <strong>Swat</strong>-2, Dil Rosh-97 and Fakhr-e-Malakand)<br />
were grown. Primary data were collected from 100 respondents (farmers)<br />
randomly selected through structured questionnaire. Sample size was<br />
allocated to these n<strong>in</strong>e villages on the basis <strong>of</strong> proportional allocation method.<br />
For data analysis, benefit cost ratios, log-l<strong>in</strong>ear Cobb-Douglas production<br />
function, Wald test and marg<strong>in</strong>al rate <strong>of</strong> substitutions were estimated.<br />
Accord<strong>in</strong>g to the results maximum benefit cost ratio was noted for variety<br />
Fakhr-e-Malakand (3.41) followed by Basmati-385 (3.37). This <strong>in</strong>dicates that<br />
Fakhr-e-Malakand is the most pr<strong>of</strong>itable variety <strong>of</strong> rice as compared to all other<br />
rice varieties. The output elasticities <strong>of</strong> area, tractor hours, fertilizer, seed,<br />
labour and pesticides were observed as 0.3112, 0.0012, 0.5924, 0.6212, 0.5124<br />
and 0.0013, respectively. The <strong>in</strong>put-output relationship holds <strong>in</strong>creas<strong>in</strong>g returns<br />
to scale. The farmers should be advised to cultivate high yield<strong>in</strong>g varieties like<br />
Fakhr-e-Malakand and also use improved seed.<br />
KEYWORDS: Oryza sativa; <strong>in</strong>put-output relationship; marg<strong>in</strong>al rate <strong>of</strong><br />
substitutions; rate <strong>of</strong> returns to scale; cost benefit analysis;<br />
<strong>Swat</strong>; Paksitan.<br />
INTRODUCTION<br />
The economy <strong>of</strong> district <strong>Swat</strong> is predom<strong>in</strong>antly based on agriculture which is<br />
ma<strong>in</strong> source <strong>of</strong> livelihood for local population. The major crops cultivated <strong>in</strong><br />
<strong>Swat</strong> <strong>in</strong>clude rice, onion, wheat, maize, tomato and vegetables. In kharif<br />
season (April-June), rice is ma<strong>in</strong>ly grown on area situated near river <strong>Swat</strong><br />
and is harvested <strong>in</strong> November and December.<br />
*Research Economist, Pakistan Institute <strong>of</strong> Development <strong>Economic</strong>s (PIDE), Islamabad,<br />
Pakistan.<br />
J. Agric. Res., 2013, 51(2)
176<br />
A. Hussa<strong>in</strong><br />
Most <strong>of</strong> the cultivation is carried out <strong>in</strong> southern areas <strong>of</strong> district ma<strong>in</strong>ly <strong>in</strong><br />
M<strong>in</strong>gora, Barikot, Kabal, Matta and Khwazakhela. The ma<strong>in</strong> rice varieties<br />
grown <strong>in</strong> <strong>Swat</strong> are JP-5, Basmati-385, Sara Saila, <strong>Swat</strong>-1, <strong>Swat</strong>-2, Fakhr-e-<br />
Malakand and Dil Rosh-97. However, JP-5 is a well-known variety <strong>of</strong> the<br />
district (2).<br />
A number <strong>of</strong> researchers explored different economic aspects <strong>of</strong> various<br />
crops <strong>in</strong> general and particularly <strong>of</strong> rice crop. Khan and Maki (16) studied the<br />
relationship between farm size and economic efficiency <strong>in</strong> Punjab and S<strong>in</strong>dh.<br />
They found that large farm size did not matter for economic efficiency <strong>in</strong><br />
agriculture sector as compared to small size. Santha (21) studied the<br />
economics <strong>of</strong> rice cultivation <strong>in</strong> India and compared the production cost, <strong>in</strong>put<br />
use and pr<strong>of</strong>itability <strong>of</strong> rice production <strong>in</strong> three seasons. He found that the<br />
Viruppu crop performed better <strong>in</strong> terms <strong>of</strong> benefit cost ratio and cost <strong>of</strong><br />
production. Rebuffel (20) observed that small farmers had comparatively less<br />
access to credit as compared to large farmers. Further, 80 percent <strong>of</strong> small<br />
farmers used primitive methods <strong>of</strong> farm<strong>in</strong>g. Sreeja and Chandrabhanu (23)<br />
evaluated and identified the economic benefits <strong>of</strong> fertilization practices for<br />
upland rice production. They found that slope <strong>of</strong> demand curve was greater<br />
than the slope <strong>of</strong> supply curve <strong>of</strong> paddy; price structure <strong>of</strong> paddy <strong>in</strong> Kerala,<br />
India. Projected values based on the model showed that <strong>in</strong>stability <strong>of</strong> supply<br />
behavior to adjust changes <strong>in</strong> price should be changed to reduce the time lag<br />
<strong>in</strong> achiev<strong>in</strong>g equilibrium price and output. Parikh et al. (19) measured the<br />
economic efficiency <strong>in</strong> Pakistan agriculture sector us<strong>in</strong>g econometric<br />
techniques. Their views differed from those <strong>of</strong> Khan and Maki (16) and found<br />
that small farms were more efficient than large farms. Dash et al. (5) studied<br />
per hectare cost and return and level <strong>of</strong> <strong>in</strong>put used <strong>in</strong> production for summer<br />
rice and observed that on average, per hectare cost <strong>of</strong> cultivation was Rs.<br />
17113 and average yield per hectare was about 56 qu<strong>in</strong>tals, which varied<br />
from 52.71 to 58 qu<strong>in</strong>tals on sample farms. The average gross and net<br />
returns per hectare were Rs. 18923 and Rs. 1920, respectively.<br />
Dipeolu and Kazeem (6) <strong>in</strong> Nigeria estimated three functional forms i.e.<br />
l<strong>in</strong>ear, semi-logarithmic, and double logarithmic where Cobb-Douglas<br />
production function (4) revealed that farmers lacked adequate experience <strong>in</strong><br />
improved farm<strong>in</strong>g technologies. It further showed an average productivity <strong>of</strong><br />
0.994 tons per hectare which was low, compared to potential rice yield <strong>of</strong> 2-3<br />
tons per hectare. Young et al. (24) described that both government and nongovernmental<br />
<strong>in</strong>stitutions should devise appropriate policy about production<br />
systems i.e. market<strong>in</strong>g, transport storage, production costs, market<strong>in</strong>g<br />
marg<strong>in</strong>s, consumption, exports, capacity <strong>of</strong> land and water resources to<br />
<strong>in</strong>crease production. Ishida and Asmuni (12) <strong>in</strong> Malaysia presented an<br />
J. Agric. Res., 2013, 51(2)
<strong>Economic</strong> analysis <strong>of</strong> rice cultivation <strong>in</strong> <strong>Swat</strong><br />
177<br />
economic analysis <strong>of</strong> rice production so as to trace the impact <strong>of</strong> agricultural<br />
modernization on paddy <strong>in</strong>come. They concluded that farm mechanization<br />
had positive impact on paddy <strong>in</strong>come. Haq et al. (8) us<strong>in</strong>g Cobb-Douglas type<br />
<strong>of</strong> production function technique <strong>in</strong>vestigated the relationship <strong>of</strong> farm size and<br />
<strong>in</strong>put use and its effect on production and gross/net <strong>in</strong>comes <strong>in</strong> potato. They<br />
concluded that labour, seed, farmyard manure, nitrophos and labours were<br />
the factors significantly contributed towards output. Lohano and Mari (18)<br />
assessed the <strong>in</strong>put-output relationship <strong>of</strong> onion crop <strong>in</strong> Hyderabad district,<br />
S<strong>in</strong>dh, us<strong>in</strong>g Cobb-Douglas production function and found that <strong>in</strong>put-output<br />
relationship <strong>of</strong> onion crop was characterized by constant returns to scale.<br />
Ahmad, et al. (1) determ<strong>in</strong>ed the cost and revenue for potato crop and<br />
compared it for two districts <strong>of</strong> Punjab namely Okara and Kasur. They found<br />
significant difference <strong>in</strong> cost and revenue <strong>in</strong> these districts. They also<br />
considered funds availability, seed quality and stability <strong>in</strong> price as responsible<br />
factors to <strong>in</strong>crease production <strong>of</strong> potato crop and its pr<strong>of</strong>itability. Arifullah (3)<br />
noted that yield potential was low (13-23%) as compared to world average<br />
yield for various crops <strong>in</strong> general and particularly for IRRI rice, onion, wheat,<br />
sugarcane and chickpea. He suggested to decrease the cost <strong>of</strong> production<br />
alongwith <strong>in</strong>creas<strong>in</strong>g per hectare yield. Khan et al. (15) exam<strong>in</strong>ed the<br />
relationship between energy <strong>in</strong>puts and rice production <strong>in</strong> Dera Ismail Khan,<br />
district <strong>of</strong> Pakistan, us<strong>in</strong>g cross-sectional data collected on the basis <strong>of</strong><br />
stratified random sampl<strong>in</strong>g technique. The results showed that <strong>in</strong>crease <strong>in</strong><br />
energy consumption at farm level <strong>in</strong>creased rice yield and therefore, farmers<br />
with high cost <strong>of</strong> production could get better return <strong>of</strong> their crop.<br />
Hussa<strong>in</strong> and Khattak (10) made the economic analysis <strong>of</strong> sugarcane crop <strong>in</strong><br />
district Charsadda (Khyber Pakhtunkhwa), us<strong>in</strong>g primary data collected from<br />
100 respondents and Cobb-Douglas production function. They noted that<br />
area under sugarcane crop, tractor hours, fertilizer, seed, labour and<br />
pesticides were the significant variables affect<strong>in</strong>g sugarcane crop <strong>in</strong> the<br />
district.<br />
The present study ma<strong>in</strong>ly focuses on <strong>in</strong>put-output relationship and costrevenue<br />
comparison <strong>of</strong> different rice varieties <strong>in</strong> district <strong>Swat</strong>.<br />
MATERIALS AND METHODS<br />
This study was conducted at Pakistan Institute <strong>of</strong> Development <strong>Economic</strong>s,<br />
Islamabad, Pakistan dur<strong>in</strong>g the year 2010. Three tehsils <strong>of</strong> district <strong>Swat</strong><br />
(Kabal, Matta and Barikot) were selected on the basis <strong>of</strong> purposive sampl<strong>in</strong>g<br />
technique. These tehsils qualify most <strong>of</strong> the characteristics favorable for the<br />
cultivation <strong>of</strong> food gra<strong>in</strong> crops. In addition, selected areas are situated on the<br />
J. Agric. Res., 2013, 51(2)
178<br />
A. Hussa<strong>in</strong><br />
bank <strong>of</strong> River <strong>Swat</strong> where food gra<strong>in</strong>s <strong>in</strong> general and particularly rice crop are<br />
grown extensively. From each tehsil three villages were selected i.e.<br />
Akhunkalay, Hazara and Dagai from tehsil Kabal; Parai, Aboha and Kota<br />
from tehsil Barikot while Asharai, Durashkhela and Baidara from tehsil Matta.<br />
While select<strong>in</strong>g these villages weightage was given to those which were<br />
nearest to River <strong>Swat</strong>.<br />
The analysis is based on primary data, which were collected from 100<br />
respondents (farmers) through structured questionnaire. The data <strong>in</strong>cluded<br />
the cost components ma<strong>in</strong>ly land preparation, rais<strong>in</strong>g nursery, fertilizer,<br />
transplant<strong>in</strong>g, pesticides, land rent, harvest<strong>in</strong>g, irrigation, clean<strong>in</strong>g and<br />
thresh<strong>in</strong>g. Information on revenue components ma<strong>in</strong>ly paddy production and<br />
rice straw was also collected. The sample size used was quite logical<br />
because the villages were homogeneous <strong>in</strong> terms <strong>of</strong> land conditions (field,<br />
soil type and irrigation sources), cropp<strong>in</strong>g pattern, population and farm<strong>in</strong>g<br />
activities. Sample size was allocated to these n<strong>in</strong>e villages on the basis <strong>of</strong><br />
proportional allocation method. Further, respondents were selected randomly<br />
from each village.<br />
To compare the cost and revenue <strong>of</strong> different rice varieties at a glance,<br />
benefit cost ratios were calculated with formula used by Santha (21):<br />
Benefit cost ratio for rice varieties = TRR / TECR….. (1)<br />
where TRR is the per acre total revenue generated from variety <strong>of</strong> rice and<br />
TCR is the total per acre cost <strong>of</strong> rice variety.<br />
To show the <strong>in</strong>put-output relationship, log l<strong>in</strong>ear Cobb Douglas production<br />
function (4) was used. This model was also used by Khattak and Hussa<strong>in</strong><br />
(17) and Haq et al (8). However, <strong>in</strong> present study it was modified by <strong>in</strong>clud<strong>in</strong>g<br />
some additional variables. The same technique was also used to f<strong>in</strong>d out the<br />
contribution <strong>of</strong> various <strong>in</strong>puts towards output. This model is widely used <strong>in</strong><br />
agriculture for determ<strong>in</strong><strong>in</strong>g the nature <strong>of</strong> returns to scale. The follow<strong>in</strong>g log<br />
l<strong>in</strong>ear Cobb-Douglas production function was applied, us<strong>in</strong>g the least square<br />
method.<br />
ln RP = ln a 0 + a 1 ln RA+a 2 ln TRHR + a 3 ln FERTR + a 4 ln SDR+a 5 ln LABR<br />
+ a 6 ln PSTR +e i ……(2)<br />
The above model was then converted <strong>in</strong>to follow<strong>in</strong>g general form:<br />
RP=a o´RA a1´TRHR a2 ´FERTR a3´ SDR a4´ LABR a5´ PSTR a6´e i …(3)<br />
where RP = Total paddy production (kg)<br />
RA = Area under rice crop (acres)<br />
J. Agric. Res., 2013, 51(2)
<strong>Economic</strong> analysis <strong>of</strong> rice cultivation <strong>in</strong> <strong>Swat</strong><br />
179<br />
TRHR = Tractor hours for cultivated area <strong>of</strong> rice<br />
FERTR= Total fertilizer used on cultivated area <strong>of</strong> rice (bags)<br />
SDR = Seed used on cultivated area <strong>of</strong> rice (kg)<br />
LABR = Total labour used on cultivated area <strong>of</strong> rice (man days)<br />
PSTR= Total pesticides/<strong>in</strong>secticides used on cultivated area <strong>of</strong> rice (Rs.)<br />
a o = Shows the impact <strong>of</strong> <strong>in</strong>novations or technology.<br />
a 1 , a 2 , a 3 , a 4 , a 5 and a 6 Output elasticities <strong>of</strong> RA, TRHR, FERTR, SDR, LABR<br />
and PSTR, respectively.<br />
e i = The residual term (absorbs the effect <strong>of</strong> those variables, which are not<br />
<strong>in</strong>cluded <strong>in</strong> the model).<br />
The equations <strong>in</strong>dicate that rice production is dependent variable whereas<br />
RA, TRHR, FERTR, SDR, LABR and PSTR are explanatory variables.<br />
Irrigation cost was excluded from the set <strong>of</strong> explanatory variables because it<br />
was available free <strong>of</strong> cost <strong>in</strong> the study area.<br />
To check whether the rice crop is characterized by constant, <strong>in</strong>creas<strong>in</strong>g or<br />
decreas<strong>in</strong>g returns to scale, Wald test (1952) was used. This test is widely<br />
used for determ<strong>in</strong><strong>in</strong>g the rate <strong>of</strong> return to scale, which imposes restrictions on<br />
values <strong>of</strong> population parameter estimates.<br />
Under the null hypothesis H o , the Wald statistic has an asymptotic (z)<br />
distribution, where z is the number <strong>of</strong> restrictions under H o . In case <strong>of</strong> l<strong>in</strong>ear<br />
regression model, the null hypothesis is Rb-r = 0.<br />
The Wald statistic is: W = (Rb-r)’(Rs 2 (X’X) -1 R’) -1 = (Rb-r) which is<br />
asymptotically (z) under H o . where R is a known z × k matrix, and r is a z<br />
vector, respectively.<br />
Assum<strong>in</strong>g that the errors e i are <strong>in</strong>dependent and identically normally<br />
distributed, the f<strong>in</strong>ite sample F-statistic is:<br />
F = W/Z =<br />
Here is a vector <strong>of</strong> residuals from restricted regression and T is the number<br />
<strong>of</strong> observations. In this case, the F-statistic compares the residual sum <strong>of</strong><br />
squares computed with and without restrictions imposed. Further, Chi-square<br />
statistic is equal to the F-statistic times the number <strong>of</strong> restrictions under test<br />
(14).<br />
J. Agric. Res., 2013, 51(2)
180<br />
A. Hussa<strong>in</strong><br />
In this case, there is only one restriction i.e. sum <strong>of</strong> exponents equals one for<br />
rice crop. If two test statistics are identical with p-values <strong>of</strong> both statistics, this<br />
<strong>in</strong>dicates that the null hypothesis <strong>of</strong> constant returns to scale can be<br />
decisively rejected. If the sum <strong>of</strong> exponents on explanatory variables equals<br />
one, then the <strong>in</strong>put-output relationship holds constant returns to scale for rice<br />
crop i.e. any proportional <strong>in</strong>crease <strong>in</strong> rice <strong>in</strong>puts results <strong>in</strong> an equal <strong>in</strong>crease<br />
<strong>in</strong> rice output. If the sum <strong>of</strong> exponents on explanatory variables is greater<br />
than one, then <strong>in</strong>put-output relationship holds <strong>in</strong>creas<strong>in</strong>g returns to scale i.e.<br />
rice output <strong>in</strong>creases faster than rice <strong>in</strong>puts. If the sum <strong>of</strong> exponents on<br />
explanatory variables is less than one, then <strong>in</strong>put-output relationship holds<br />
decreas<strong>in</strong>g returns to scale i.e. rice output <strong>in</strong>creases slower than <strong>in</strong>puts <strong>of</strong><br />
rice. This approach was used for Lohano and Mari (18) for onion crop.<br />
The marg<strong>in</strong>al rate <strong>of</strong> substitution among <strong>in</strong>puts was calculated, to show how<br />
the scale <strong>of</strong> production responds if quantity <strong>of</strong> one <strong>in</strong>put is changed while<br />
others stay unchanged. The approach was adopted by Dawson and L<strong>in</strong>gard<br />
(7). The marg<strong>in</strong>al rate <strong>of</strong> substitution among <strong>in</strong>puts was calculated us<strong>in</strong>g the<br />
follow<strong>in</strong>g formula:<br />
MRS (X/Y) = L /M ´ YX -1 …..(4)<br />
Here MRS (X/Y) represents marg<strong>in</strong>al rate <strong>of</strong> substitution <strong>of</strong> <strong>in</strong>put X for Y, L is<br />
the output elasticity <strong>of</strong> X and M is the output elasticity <strong>of</strong> Y. In this study the<br />
<strong>in</strong>puts used were RA, TRHR, FERTR, SDR, LABR and PSTR.<br />
All variables were valued at the prevail<strong>in</strong>g market prices dur<strong>in</strong>g 2010. Further,<br />
simple arithmetics, averages, classification and tabulation were also used as<br />
analytical tools. Statistical packages such as SPSS and Eviews were used<br />
for deriv<strong>in</strong>g the results.<br />
RESULTS AND DISCUSSION<br />
Average cost <strong>of</strong> components and revenue<br />
Average per acre cost for all varieties became to Rs. 16,208, which <strong>in</strong>cluded<br />
cost <strong>of</strong> seed (Rs. 273), fertilizers (Rs. 655), labour usage (man days) (Rs.<br />
6600), transplant<strong>in</strong>g (Rs. 1800), harvest<strong>in</strong>g (Rs. 1200) and thresh<strong>in</strong>g (Rs.<br />
1260) (Table 1) <strong>in</strong> addition to other costs (Table 1). This cost is higher as<br />
compared to per acre cost computed by Hussa<strong>in</strong> et al. (11), which was Rs.<br />
13,565. This is due to <strong>in</strong>creas<strong>in</strong>g trend <strong>of</strong> prices <strong>of</strong> <strong>in</strong>puts over time.<br />
J. Agric. Res., 2013, 51(2)
<strong>Economic</strong> analysis <strong>of</strong> rice cultivation <strong>in</strong> <strong>Swat</strong><br />
181<br />
Table 1.<br />
Average per acre cost and revenue <strong>of</strong> all varieties <strong>in</strong> all villages.<br />
Particulars Unit Quantity Rates<br />
(Rs.)<br />
Land preparation<br />
Hour<br />
(i) Plough<strong>in</strong>g with tractor<br />
Day 3 200<br />
(ii) Puddl<strong>in</strong>g with bullocks<br />
1 500<br />
Rais<strong>in</strong>g nursery<br />
(i) Seed<br />
(ii) Nursery bed preparation<br />
(iii) Nursery ma<strong>in</strong>tenance<br />
(iv) Nursery pull<strong>in</strong>g, transport<br />
Fertilizers<br />
(i) DAP<br />
(ii) Urea<br />
kg<br />
Day<br />
Day<br />
Day<br />
7 [1]<br />
2<br />
1<br />
4<br />
39<br />
120<br />
120<br />
120<br />
Amount/acre<br />
(Rs.)<br />
600<br />
500<br />
273<br />
240<br />
120<br />
480<br />
kg<br />
kg<br />
25<br />
50<br />
9<br />
8.6<br />
225<br />
430<br />
Transplant<strong>in</strong>g Day 15 120 1800<br />
Irrigation Day 4 120 480<br />
Clean<strong>in</strong>g/handl<strong>in</strong>g Day 7 120 840<br />
Pesticides<br />
(i) Furadan (Insecticides)<br />
(ii) Machety (weedicides)<br />
(iii) labour charges<br />
kg<br />
ml<br />
Day<br />
16<br />
800<br />
3<br />
50<br />
300<br />
120<br />
800<br />
300<br />
360<br />
Harvest<strong>in</strong>g Day 10 120 1200<br />
Thresh<strong>in</strong>g<br />
(i) Tractor charges<br />
(ii) Labour charges<br />
Hr<br />
Day<br />
1<br />
8<br />
300<br />
120<br />
300<br />
960<br />
Gunny bags charges Bag 20 40 800<br />
Land rent -- -- -- 5500<br />
Total average cost on all varieties - - - 16, 208<br />
Average paddy production for all varieties was calculated as 36 maunds from<br />
one acre area amount<strong>in</strong>g to Rs. 38556 (Table 2). Average amount <strong>of</strong> rice<br />
straw from all varieties was Rs. 4357 per acre. Thus total and net revenue<br />
from all varieties was calculated Rs. 42913 and Rs. 26705, respectively<br />
(Table 2). Further, average per acre cost was m<strong>in</strong>imum <strong>in</strong> Dil Rosh-97 (Rs.<br />
16185) followed by Sara Saila and <strong>Swat</strong>-1 (Rs. 16235 each). Maximum per<br />
acre cost was noted <strong>in</strong> JP-5 (Rs. 16385/-) (Table 3).<br />
Table 2. Average total and net revenue <strong>of</strong> all varieties <strong>in</strong> all villages.<br />
Yield Quantity (maund*) Rate (Rs./maund*) Total amount (Rs.)<br />
(i) Paddy<br />
(ii) Straw<br />
36 1071<br />
4357<br />
38556<br />
4357<br />
Total revenue 42913<br />
Net revenue 26705<br />
*Maund=40kg<br />
1 In study area, farmers were us<strong>in</strong>g on average 7 kg seed per acre for local rice varieties. This<br />
seed rate was also recommended by local Agriculture Research Station, <strong>Swat</strong>. However,<br />
Pakistan Agricultural Research Council recommends 12-14 kg seed per acre for basmati rice.<br />
J. Agric. Res., 2013, 51(2)
182<br />
A. Hussa<strong>in</strong><br />
J. Agric. Res., 2013, 51(2)
<strong>Economic</strong> analysis <strong>of</strong> rice cultivation <strong>in</strong> <strong>Swat</strong><br />
183<br />
Benefit cost ratios (BCRs) <strong>of</strong> different rice varieties<br />
The BCR for varieties ranged from 2.08 to 3.41 (Table 4). Variety Fakhr-e-<br />
Malakand possessed the highest BCR value (3.41), <strong>in</strong>dicat<strong>in</strong>g that it is the<br />
most pr<strong>of</strong>itable variety <strong>of</strong> rice as compared to all other rice varieties. In some<br />
earlier studies (9, 11) also variety Fakhr-e-Malakand was found to be the<br />
most pr<strong>of</strong>itable variety as compared to other rice varieties.<br />
Table 4.<br />
Benefit cost ratios for different rice varieties.<br />
<strong>Rice</strong> variety<br />
Average<br />
yield/acre<br />
(kg)<br />
Total rice<br />
revenue<br />
(TRR) (Rs/acre)<br />
Total cost<br />
<strong>of</strong> rice (TCR)<br />
(Rs/acre)<br />
Benefit cost ratios<br />
BCR = TRR/TCR<br />
JP-5 1800 44, 000 16385 2.69<br />
Basmati-385 1950 54, 900 16271 3.37<br />
Sara saila 1700 42, 500 16235 2.62<br />
Dil Rosh-97 1650 33, 700 16185 2.08<br />
<strong>Swat</strong>-1 1680 35, 300 16235 2.17<br />
<strong>Swat</strong>-2 1680 35, 300 16295 2.16<br />
Fakhr-e-<br />
Malakand<br />
2000 55, 500 16295 3.41<br />
Estimation <strong>of</strong> log l<strong>in</strong>ear rice production function<br />
R-square and adjusted R-square values <strong>in</strong>dicated that the fit is good (Table<br />
5). The high value <strong>of</strong> R 2 (=0.81) showed that 81 percent <strong>of</strong> variations <strong>in</strong> the<br />
(log <strong>of</strong>) total rice product was expla<strong>in</strong>ed by the (log <strong>of</strong>) <strong>in</strong>cluded explanatory<br />
variables. Most <strong>of</strong> the explanatory variables had a strong relationship with the<br />
dependent variable.<br />
Table 5.<br />
Estimated log l<strong>in</strong>ear rice production function results.<br />
Dependent variable: ln RP<br />
Sample: 1-100<br />
Variable Coefficient Std. Error t-Statistic Prob.<br />
C 1.3612 0.1234 11.03079 0.0000<br />
ln RA 0.3112 0.1243 2.50362 0.0141<br />
ln TRHR 0.0012 0.00032 3.75000 0.0021<br />
ln FERTR 0.5924 0.19994 2.962889 0.0531<br />
ln SDR 0.6212 0.10995 5.649841 0.0213<br />
ln LABR 0.5124 0.1922 2.665973 0.0019<br />
ln PSTR 0.0013 0.34125 0.00381 0.45123<br />
R-squared 0.8113 Durb<strong>in</strong>-Watson stat 1.8921<br />
Adjusted R-squared 0.8122<br />
J. Agric. Res., 2013, 51(2)
184<br />
A. Hussa<strong>in</strong><br />
F-Statistic 12451 Prob(F-Statistic) 0.00001<br />
The results suggests the follow<strong>in</strong>g model:<br />
ln RP = 1.3612+ 0.3112*ln RA+ 0.0012*ln TRHR + 0.05924*ln FERTR +<br />
0.6212*ln SDR+ 0.5124*ln LABR + 0.00126*ln PSTR…. (5)<br />
or <strong>in</strong> the most general form:<br />
RP = 3.900872´ RA 0.3112´ TRHR 0.0012´ FERTR 0.5924´ SDR 0.6212´ LABR 0.5124 ´<br />
PSTR 0.00126 …..(6)<br />
where a o = e 1.3612 = 3.900872<br />
The results <strong>in</strong>dicated that RA, TRHR, LABR, FERTR and SDR are<br />
statistically significant variables while PSTR is statistically non-significant<br />
variable. The reason is that the farmers rarely used pesticides/<strong>in</strong>secticides as<br />
the possibility <strong>of</strong> diseases <strong>in</strong> rice crop was too low <strong>in</strong> the study area. Usage <strong>of</strong><br />
fertilizer was also at m<strong>in</strong>imum level due to fertile land suitable for rice crop<br />
cultivation.<br />
Accord<strong>in</strong>g to eq. 5 and 6, value <strong>of</strong> rice area elasticity <strong>of</strong> production (0.3112)<br />
<strong>in</strong>dicated that if rice area <strong>in</strong>creases by 1 percent rema<strong>in</strong><strong>in</strong>g all other <strong>in</strong>puts<br />
unchanged, the rice production will <strong>in</strong>crease by 0.31 percent. This elasticity is<br />
lower as compared to the area elasticity <strong>of</strong> rice production computed by<br />
Shaikh and Shah (22) which was 0.192. Khattak and Hussa<strong>in</strong> (17) estimated<br />
the area elasticity <strong>of</strong> rice production as 0.197, while Hussa<strong>in</strong> (9) estimated<br />
rice area elasticity <strong>of</strong> rice production as 0.2457. The results further showed if<br />
TRHR <strong>in</strong>crease by 1 percent, rice production will <strong>in</strong>crease by 0.0012 percent<br />
tak<strong>in</strong>g all other variables unchanged. The output elasticities <strong>of</strong> FERTR, SDR,<br />
LABR and PSTR are 0.5924, 0.6212, 0.5124 and 0.0013, respectively which<br />
can be <strong>in</strong>terpreted <strong>in</strong> the same way. Khattak and Hussa<strong>in</strong> (17) also estimated<br />
the elasticity <strong>of</strong> seed and fertilizer as 0.545 and 0.126, respectively. The<br />
differences <strong>in</strong> these values are due to study period and number <strong>of</strong> sample<br />
observations.<br />
The high coefficient observed for seed (rice <strong>in</strong>put) <strong>in</strong>dicated that it is the most<br />
cost efficient. Value <strong>of</strong> Durb<strong>in</strong> Watson statistic (1.89) showed that no problem<br />
<strong>of</strong> autocorrelation exists. The value <strong>of</strong> F-statistic alongwith its probability<br />
showed the overall significance <strong>of</strong> <strong>in</strong>cluded explanatory variables.<br />
Rate <strong>of</strong> returns to scale<br />
In the context <strong>of</strong> <strong>in</strong>put-output relationship, it is necessary to show how the<br />
<strong>in</strong>puts and output go side by side. The sum <strong>of</strong> all output elasticities (3.4009)<br />
J. Agric. Res., 2013, 51(2)
<strong>Economic</strong> analysis <strong>of</strong> rice cultivation <strong>in</strong> <strong>Swat</strong><br />
185<br />
(greater than one) (Tabel 5), <strong>in</strong>dicates that rice production is characterized by<br />
<strong>in</strong>creas<strong>in</strong>g returns to scale. These results are consistent with those <strong>of</strong><br />
Hussa<strong>in</strong> (9) and Khattak and Hussa<strong>in</strong> (17), where rice production <strong>in</strong> district<br />
<strong>Swat</strong> was characterized by <strong>in</strong>creas<strong>in</strong>g returns to scale.<br />
The Wald-Test (1952) also supports these f<strong>in</strong>d<strong>in</strong>gs (Table 6). The test has<br />
the null hypothesis that rice production is characterized by constant returns to<br />
scale and has only one restriction i.e. a 1 +a 2 + a 3 + a 4 + a 5 + a 6 =1. As, the Chisquare<br />
statistic is equal to F-statistic times the number <strong>of</strong> restrictions under<br />
test (identical), and also the p-values lead us to reject null hypothesis <strong>of</strong><br />
constant returns to scale.<br />
Table 6.<br />
Wald test results.<br />
Null Hypothesis: a 1 + a 2 + a 3+ a 4+ a 5 + a 6 =1<br />
Probability<br />
F-statistic 5.213452 0.0038<br />
Chi-square 5.213452 0.0015<br />
t-statistic 9.254535 0.0000<br />
Here a 1 , a 2 , a 3 , a 4 , a 5 and a 6 are the coefficients <strong>of</strong> RA, TRHR, FERTR, SDR,<br />
LABR and PSTR, respectively.<br />
Marg<strong>in</strong>al rate <strong>of</strong> substitution <strong>of</strong> different <strong>in</strong>puts at mean values <strong>of</strong> rice<br />
<strong>in</strong>puts<br />
Marg<strong>in</strong>al rate <strong>of</strong> substitutions (MRS) was calculated us<strong>in</strong>g to show how the<br />
scale <strong>of</strong> production responds if quantity <strong>of</strong> one <strong>in</strong>put is changed while others<br />
stay unchanged. The ratios <strong>of</strong> output elasticities are presented <strong>in</strong> Table 7.<br />
Table 7.<br />
<strong>Rice</strong> output elasticities ratios.<br />
Inputs<br />
Inputs a 1=0.3112 a 2=0.0012 a 3=0.5924 a 4=0.6212 a 5=0.5124 a 6=0.0013<br />
a 1=0.3112 1.0000 0.0039 1.9036 1.9961 1.6465 0.0042<br />
a 2=0.0012 259.3333 1.0000 493.6667 517.6667 427.0000 1.0833<br />
a 3=0.5924 0.5253 0.0020 1.0000 1.0486 0.8650 0.0022<br />
a 4=0.6212 0.5010 0.0019 0.9536 1.0000 0.8249 0.0021<br />
a 5=0.5124 0.6073 0.0023 1.1561 1.2123 1.0000 0.0025<br />
a 6=0.0013 239.3846 0.9231 455.6923 477.8462 394.1538 1.0000<br />
The data (Table 8) further showed that MRS <strong>of</strong> RA for LABR is 30, <strong>in</strong>dicat<strong>in</strong>g<br />
that one unit <strong>of</strong> rice area (one acre area) can be substituted for 30 units <strong>of</strong><br />
labour (<strong>in</strong> man days) without chang<strong>in</strong>g the product scale. Similarly, MRS <strong>of</strong><br />
RA for FERTR is 1.1, <strong>in</strong>dicat<strong>in</strong>g that one unit <strong>of</strong> rice area (one acre area) can<br />
be substituted for 1.1 units <strong>of</strong> fertilizer bags without chang<strong>in</strong>g the product<br />
J. Agric. Res., 2013, 51(2)
186<br />
A. Hussa<strong>in</strong><br />
scale. MRS, RA for SDR and PSTR is 13.2 and 478.8, respectively. MRS <strong>of</strong><br />
TRHR for LAB is 0.035 and FERTR for PSTR is 455.7 show<strong>in</strong>g significance<br />
<strong>of</strong> the rice <strong>in</strong>puts.<br />
Table 8.<br />
Marg<strong>in</strong>al rate <strong>of</strong> substitutions (MRS) between rice <strong>in</strong>puts.<br />
Substitution between <strong>in</strong>puts<br />
MRS<br />
Substitution <strong>of</strong> RA for TRHR 864.444<br />
Substitution <strong>of</strong> RA for FERTR 1.051<br />
Substitution <strong>of</strong> RA for SDR 13.360<br />
Substitution <strong>of</strong> RA for LABR 30.365<br />
Substitution <strong>of</strong> RA for PSTR 478.769<br />
Substitution <strong>of</strong> TRHR for RA 0.001<br />
Substitution <strong>of</strong> TRHR for FERTR 0.001<br />
Substitution <strong>of</strong> TRHR for SDR 0.015<br />
Substitution <strong>of</strong> TRHR for LAB 0.035<br />
Substitution <strong>of</strong> TRHR for PST 0.554<br />
Substitution <strong>of</strong> FERTR for RA 0.952<br />
Substitution <strong>of</strong> FERTR for TRHR 822.778<br />
Substitution <strong>of</strong> FERTR for SDR 12.715<br />
Substitution <strong>of</strong> FERTR for LABR 28.903<br />
Substitution <strong>of</strong> FERTR for PSTR 455.692<br />
Substitution <strong>of</strong> SDR for RA 0.075<br />
Substitution <strong>of</strong> SDR for TRHR 64.708<br />
Substitution <strong>of</strong> SDR for FERTR 0.079<br />
Substitution <strong>of</strong> SDR for LABR 2.273<br />
Substitution <strong>of</strong> SDR for PSTR 35.838<br />
Substitution <strong>of</strong> LABR for RA 0.440<br />
Substitution <strong>of</strong> LABR for TRHR 15.766<br />
Substitution <strong>of</strong> LABR for FERTR 0.002<br />
Substitution <strong>of</strong> LABR for SDR 1.806<br />
Substitution <strong>of</strong> LABR for PSTR 0.002<br />
Substitution <strong>of</strong> PSTR for RA 0.028<br />
Substitution <strong>of</strong> PSTR for TRHR 0.063<br />
Substitution <strong>of</strong> PSTR for FERTR 864.444<br />
Substitution <strong>of</strong> PSTR for SDR 1.051<br />
Substitution <strong>of</strong> PSTR for LABR 13.360<br />
CONCLUSION AND RECOMMENDATIONS<br />
The study concludes that average per acre cost for all varieties <strong>in</strong> all villages<br />
was Rs. 16,208. Average total and net revenue for the farmers from all<br />
varieties were Rs. 42913 and Rs. 26705, respectively. Fakhr-e-Malakand<br />
was the most pr<strong>of</strong>itable variety <strong>in</strong> terms <strong>of</strong> total and net yield. The <strong>in</strong>puts<br />
such as area, tractor hours, fertilizer, labour and seed were found statistically<br />
significant. The output elasticities <strong>of</strong> area, tractor hours, fertilizer, seed,<br />
labour and pesticides were estimated as 0.3112, 0.0012, 0.5924, 0.6212,<br />
J. Agric. Res., 2013, 51(2)
<strong>Economic</strong> analysis <strong>of</strong> rice cultivation <strong>in</strong> <strong>Swat</strong><br />
187<br />
0.5124 and 0.0013, respectively. It showed that rice <strong>in</strong>put-output relationship<br />
holds <strong>in</strong>creas<strong>in</strong>g returns to scale. The marg<strong>in</strong>al rate <strong>of</strong> substitution <strong>of</strong> area for<br />
labour was 30, and that <strong>of</strong> rice area for tractor hours was 864. The farmers<br />
should cultivate pr<strong>of</strong>itable variety i.e Fakhr-e-Malakand, for which proper<br />
awareness to the farmers is necessary.<br />
REFERENCES<br />
1. Ahmad, B., S. Hasan, K. Bakhsh and W. Ahmad. 2005. Pr<strong>of</strong>itability and<br />
various constra<strong>in</strong>ts <strong>in</strong> potato cultivation. Pak. J. Agric. Sci. 42(3): 68-73.<br />
2. Anon. 2006. <strong>Crop</strong> Report<strong>in</strong>g Services. Agric. Res. Station (Ext.<br />
Services), Statistics Deptt. Amankot, Distt. <strong>Swat</strong>.<br />
3. Arifullah, S. A. 2007. Pakistan <strong>Crop</strong> Sector: an <strong>Economic</strong> Evaluation<br />
Ph.D. Thesis, NWFP Agriculture University, Peshawar.<br />
4. Cobb, C.W. and P.H. Douglas. 1928. A theory <strong>of</strong> production. American<br />
Econ. Rev. 18: 139-165.<br />
5. Dash, J.K., R.P. S<strong>in</strong>gh and R.K. Pandey. 1995. <strong>Economic</strong> analysis <strong>of</strong><br />
summer rice production <strong>in</strong> Baharagora block <strong>of</strong> S<strong>in</strong>ghbhum district,<br />
Bihar - A case study. J. Res. Birsa Agric. Univ. 7(2): 131-135.<br />
6. Dipeolu, A. and M.A. Kazeem. 1997. <strong>Economic</strong>s <strong>of</strong> lowland rice<br />
production: a case study <strong>of</strong> the Itoik<strong>in</strong> irrigation project. Lagos, Nigeria.<br />
Int. J. Tropical Agric. 15: 1-4.<br />
7. Dawson, P. J. and J. L<strong>in</strong>gard. 1982. Management bias and returns to<br />
scale <strong>in</strong> a Cobb-Douglas production function for agriculture. Europ.<br />
Rev. Agric. Econ. 9(1): 7-24.<br />
8. Haq, Z. A., M. Khan and M. Ahmad. 2002. Role <strong>of</strong> farm size <strong>in</strong> <strong>in</strong>put<br />
use and productivity <strong>of</strong> potato <strong>in</strong> Shigar Valley <strong>of</strong> Baltistan Area: An<br />
econometric analysis. Sarhad J. Agric. 18(2): 245-250.<br />
9. Hussa<strong>in</strong>, A. 2010. <strong>Economic</strong> <strong>Analysis</strong> <strong>of</strong> Staple Food-gra<strong>in</strong> <strong>Crop</strong>s:<br />
Varieties’ Input-Output Comparison, <strong>Economic</strong> Practices and<br />
Significance <strong>in</strong> the Economy <strong>of</strong> <strong>District</strong> <strong>Swat</strong>. Ph.D. Thesis. University <strong>of</strong><br />
Peshawar, Pakistan.<br />
10. Hussa<strong>in</strong>, A. and N .R. Khattak. 2011. <strong>Economic</strong> analysis <strong>of</strong> sugarcane<br />
crop <strong>in</strong> district Charsadda. J. Agric. Res. 49(1): 153-163.<br />
11. Hussa<strong>in</strong>, A., N. R. Khattak and A. Q. Khan. 2008. Costs benefit analysis<br />
<strong>of</strong> different rice varieties <strong>in</strong> district <strong>Swat</strong>. Sarhad J. Agric. 24 (4): 745-<br />
748.<br />
12. Ishida, A. and A. Asmuni. 1998. Poverty eradication and <strong>in</strong>come<br />
distribution <strong>in</strong> Malaysia. J. Contemporary Asia. 28 (3): 327-345.<br />
13. Jha, D. 1998. Impact <strong>of</strong> <strong>Rice</strong> Research. IRRI. Manila, Philipp<strong>in</strong>es.<br />
14. Kawakatrn, H. 1998. A Computer Handbook Us<strong>in</strong>g Eviews. McGraw Hill<br />
Co., Int. USA.<br />
J. Agric. Res., 2013, 51(2)
188<br />
A. Hussa<strong>in</strong><br />
15. Khan, M.A., I.U. Awan and J. Zafar. 2009. Energy requirement and<br />
economic analysis <strong>of</strong> rice production <strong>in</strong> western part <strong>of</strong> Pakistan. Soil &<br />
Environ. 28(1): 60-67.<br />
16. Khan, M. and D. Maki. 1979. Effect <strong>of</strong> farm size on economic efficiency:<br />
the case for Pakistan. Amer. J. Agric. Econ. 61(1): 64-69.<br />
17. Khattak, N.U. and A. Hussa<strong>in</strong>. 2006. Role <strong>of</strong> farm <strong>in</strong>puts and rice<br />
productivity <strong>in</strong> district <strong>Swat</strong>: an econometric analysis. Sarhad J. Agric.<br />
22(1): 163-167.<br />
18. Lohano, H. and F. Mari. 2005. Measur<strong>in</strong>g the degree <strong>of</strong> return to scale<br />
for onion production <strong>in</strong> S<strong>in</strong>dh. Indus J. Biol. Sci. 2(4): 532-535.<br />
19. Parikh, A., F.Ali and M.K. Shah. 1995. Measurement <strong>of</strong> economic<br />
efficiency <strong>in</strong> Pakistan agriculture sector. Amer. J. Agric. Econ. 77(3):<br />
675-686.<br />
20. Rebuffel, P. 1994. The importance <strong>of</strong> smallholder rice production <strong>in</strong><br />
Ghana. Agric. Dev. 3: 66-70.<br />
21. Santha, A. M. 1993. A comparative analysis <strong>of</strong> cost and returns <strong>of</strong><br />
paddy cultivation for different seasons <strong>in</strong> Trichur, Kerala. Madras Agric.<br />
J. 80 (2): 41-44.<br />
22. Shaikh, F. M. and M. A. Shah. 2008. Dynamic supply response<br />
analysis <strong>of</strong> Pakistani rice growers. Pak. J. Comm. Soc. Sci. 1:48-55.<br />
23. Sreeja, S. and P. Chandrabhanu. 1995. Cobweb theory approach: an<br />
application to rice production <strong>in</strong> Kerala. J. Tropical Agric. 33 (1): 66-69.<br />
24. Young, K. B., G. L. Cramer and E. J. Wailers. 1998. An economic<br />
assessment <strong>of</strong> the Myanmar rice sector: current developments and<br />
prospects. Res. Bullet. Arkansas Agric. Exper. Station. 958, 87.<br />
25. Zaffaroni, E., P.R. Taboada and J.G. da-Silva. 1996. <strong>Analysis</strong> <strong>of</strong> small<br />
and large scale rice production systems <strong>in</strong> Arroio Grande, Rio Grande<br />
do Sul: Socioeconomic Aspects. Lavoura-Arrozeira. 49(428): 19-24.<br />
J. Agric. Res., 2013, 51(2)