Dynamic Stability Analysis of Chabot Dam, Vol. I - East Bay ...
Dynamic Stability Analysis of Chabot Dam, Vol. I - East Bay ...
Dynamic Stability Analysis of Chabot Dam, Vol. I - East Bay ...

You also want an ePaper? Increase the reach of your titles
YUMPU automatically turns print PDFs into web optimized ePapers that Google loves.
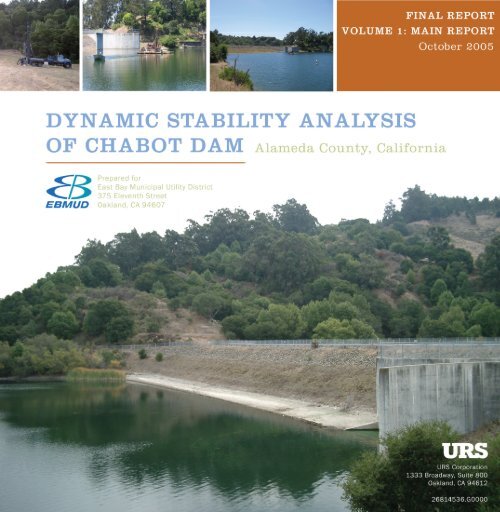
F I N A L R E P O R T<br />
V O L U M E 1<br />
DYNAMIC STABILITY ANALYSIS<br />
OF CHABOT DAM<br />
ALAMEDA COUNTY, CALIFORNIA<br />
Prepared for<br />
<strong>East</strong> <strong>Bay</strong> Municipal Utility District<br />
375 Eleventh Street<br />
Oakland, California 94607<br />
October 2005<br />
URS Corporation<br />
1333 Broadway, Suite 800<br />
Oakland, California 94612<br />
26814536.G0000
Introduction.....................................................................................................................<br />
Scope<br />
Project<br />
Field<br />
Geological<br />
Site<br />
TABLE OF CONTENTS<br />
Executive Summary............................................................................................................................... ES-1<br />
Section 1 ONE<br />
1-1<br />
1.1 Background.............................................................................................. 1-1<br />
1.2 Purpose and Objectives............................................................................ 1-1<br />
1.3 Previous Investigations ............................................................................ 1-1<br />
1.4 Report Organization................................................................................. 1-2<br />
Section 2 TWO<br />
<strong>of</strong> Work ................................................................................................................ 2-1<br />
Section 3 THREE<br />
Description......................................................................................................... 3-1<br />
3.1 Site Setting............................................................................................... 3-1<br />
3.2 Description <strong>of</strong> <strong>Dam</strong>.................................................................................. 3-1<br />
3.3 Appurtenant Facilities.............................................................................. 3-1<br />
3.4 Construction History................................................................................ 3-1<br />
3.5 Performance and Monitoring ................................................................... 3-2<br />
Section 4 FOUR<br />
and Laboratory Investigations ............................................................................. 4-1<br />
4.1 Field Investigations.................................................................................. 4-1<br />
4.1.1 Rotary Wash Drilling................................................................... 4-1<br />
4.1.2 Becker Penetration Testing.......................................................... 4-2<br />
4.1.3 Hammer Energy Measurements................................................... 4-2<br />
4.1.4 Downhole Geophysical Surveys.................................................. 4-2<br />
4.2 Laboratory Testing................................................................................... 4-3<br />
Section 5 FIVE<br />
Setting .......................................................................................................... 5-1<br />
5.1 Regional Geology .................................................................................... 5-1<br />
5.2 Site Geology............................................................................................. 5-1<br />
5.3 Fault Rupture ........................................................................................... 5-2<br />
Section 6 SIX<br />
- Specific Earthquake Ground Motions ................................................................. 6-1<br />
6.1 General Approach .................................................................................... 6-1<br />
6.2 Seismic Sources ....................................................................................... 6-1<br />
6.3 Design Response Spectra......................................................................... 6-2<br />
6.3.1 Site Conditions............................................................................. 6-2<br />
6.3.2 Attenuation Relationships............................................................ 6-2<br />
6.3.3 Deterministic Ground Motion <strong>Analysis</strong>....................................... 6-2<br />
6.3.4 Fault Rupture Directivity Effects................................................. 6-3<br />
6.3.5 Design Response Spectra............................................................. 6-3<br />
6.4 Spectrum-Compatible Acceleration Time Histories................................ 6-4<br />
X:\X_GEO\CHABOT DAM\TASK G -- ENGINEERING REPORT\DRAFT FINAL\DYNAMIC STABILITY ANALYSIS_R4.DOC\30-AUG-05\\ i
Embankment<br />
General<br />
Limit<br />
<strong>Dynamic</strong><br />
Seismic<br />
TABLE OF CONTENTS<br />
Section 7 SEVEN<br />
and Foundation Conditions.................................................................... 7-1<br />
7.1 <strong>Dam</strong> Materials and Zonation ................................................................... 7-1<br />
7.2 Embankment Conditions.......................................................................... 7-2<br />
7.2.1 Wagon Fill ................................................................................... 7-2<br />
7.2.2 Sluiced Fill................................................................................... 7-4<br />
7.2.3 Modern Fill .................................................................................. 7-6<br />
7.2.4 Random Fill ................................................................................. 7-6<br />
7.3 Foundation Conditions............................................................................. 7-6<br />
7.3.1 Foundation Soils .......................................................................... 7-6<br />
7.3.2 Bedrock........................................................................................ 7-7<br />
7.4 Groundwater Conditions.......................................................................... 7-8<br />
Section 8 EIGHT<br />
<strong>Analysis</strong> Approach........................................................................................... 8-1<br />
Section 9 NINE<br />
Equilibrium <strong>Stability</strong> Analyses............................................................................. 9-1<br />
9.1 Analytical Procedures .............................................................................. 9-1<br />
9.2 Cross Sections.......................................................................................... 9-1<br />
9.3 Material Properties................................................................................... 9-1<br />
9.4 <strong>Analysis</strong> Results....................................................................................... 9-2<br />
Section 10 TEN<br />
Response Analyses...................................................................................... 10-1<br />
10.1 Methodology.......................................................................................... 10-1<br />
10.2 <strong>Dynamic</strong> Material Properties ................................................................. 10-2<br />
10.2.1 Shear Wave Velocities............................................................... 10-2<br />
10.2.2 Modulus Reduction and <strong>Dam</strong>ping Relationships ...................... 10-2<br />
10.3 <strong>Analysis</strong> Results..................................................................................... 10-3<br />
10.3.1 1989 Loma Prieta Earthquake.................................................... 10-3<br />
10.3.2 Hayward-Rogers Creek Fault MCE........................................... 10-3<br />
10.3.3 San Andreas Fault MCE ............................................................ 10-4<br />
Section 11 ELEVEN<br />
<strong>Stability</strong> Analyses .......................................................................................... 11-1<br />
11.1 Approach................................................................................................ 11-1<br />
11.2 Evaluation <strong>of</strong> Liquefaction Potential In Sluiced Fill ............................. 11-1<br />
11.2.1 Evaluation Procedures ............................................................... 11-1<br />
11.2.2 SPT Blow Count Evaluation...................................................... 11-2<br />
11.2.3 BPT Blow Count Evaluation ..................................................... 11-2<br />
11.2.4 Liquefaction Potential................................................................ 11-3<br />
11.2.5 Residual Strength Evaluation..................................................... 11-3<br />
11.3 Evaluation <strong>of</strong> Potential Strength Loss in Wagon Fill and<br />
Foundation Soils .................................................................................... 11-3<br />
11.3.1 Evaluation Procedures ............................................................... 11-3<br />
11.3.2 Potential for Strength Loss......................................................... 11-5<br />
11.4 Post-Earthquake Slope <strong>Stability</strong> ............................................................ 11-5<br />
X:\X_GEO\CHABOT DAM\TASK G -- ENGINEERING REPORT\DRAFT FINAL\DYNAMIC STABILITY ANALYSIS_R4.DOC\30-AUG-05\\ ii
Nonlinear<br />
Expected<br />
Conclusions..................................................................................................................<br />
References<br />
TABLE OF CONTENTS<br />
11.5 Deformation Analyses ........................................................................... 11-6<br />
11.5.1 Methodology.............................................................................. 11-6<br />
11.5.2 Yield Acceleration Evaluation................................................... 11-6<br />
11.5.3 <strong>Analysis</strong> Results......................................................................... 11-6<br />
11.5.4 Analyses <strong>of</strong> Alternative Cross-Sections..................................... 11-7<br />
Section 12 TWELVE<br />
Analyses ...................................................................................................... 12-1<br />
12.1 Methodology.......................................................................................... 12-1<br />
12.2 Material Properties................................................................................. 12-1<br />
12.3 <strong>Analysis</strong> Results..................................................................................... 12-2<br />
12.3.1 1989 Loma Prieta Earthquake.................................................... 12-2<br />
12.3.2 Hayward-Rogers Creek Fault MCE........................................... 12-2<br />
Section 13 THIRTEEN<br />
<strong>Dam</strong> Performance........................................................................................ 13-1<br />
Section 14 FOURTEEN<br />
14-1<br />
Section 15 FIFTEEN<br />
.................................................................................................................... 15-1<br />
X:\X_GEO\CHABOT DAM\TASK G -- ENGINEERING REPORT\DRAFT FINAL\DYNAMIC STABILITY ANALYSIS_R4.DOC\30-AUG-05\\ iii
List <strong>of</strong> Tables, Figures and Appendices<br />
Tables<br />
Table 3-1<br />
Table 4-1<br />
Table 6-1<br />
Table 6-2<br />
Table 6-3<br />
Table 6-4<br />
Table 6-5<br />
Table 7-1<br />
Table 7-2<br />
Table 7-3<br />
Table 7-4<br />
Table 9-1<br />
Table 9-2<br />
Table 10-1<br />
Table 11-1<br />
Table 11-2<br />
Table 11-3<br />
Table 11-4<br />
Table 12-1<br />
Table 12-2<br />
Table 12-3<br />
Figures<br />
Figure 1-1<br />
Figure 3-1<br />
Figure 3-2<br />
Figure 3-3<br />
Existing Piezometers at <strong>Chabot</strong> <strong>Dam</strong><br />
Summary <strong>of</strong> Borings<br />
Earthquake Sources Affecting <strong>Chabot</strong> <strong>Dam</strong><br />
Selected Attenuation Relationships<br />
Calculated Horizontal Peak Ground Acceleration<br />
Recommended Design Response Spectral Values<br />
Earthquake Records Used to Develop Time Histories for Hayward-Rodgers Creek<br />
Fault and San Andreas Fault MCEs<br />
Representative Index Properties <strong>of</strong> Embankment and Foundation Materials(1)<br />
Strength Parameters for Embankment and Foundation Soils<br />
Comparison <strong>of</strong> Effective Stress Strength Parameters Between This and Previous<br />
Studies<br />
Comparison <strong>of</strong> Total Stress Strength Parameters Between This and Previous<br />
Studies<br />
UTEXAS3 Input Parameters for Static <strong>Stability</strong> <strong>Analysis</strong> - Long Term Condition<br />
UTEXAS3 Input Parameters for Seismic <strong>Stability</strong> <strong>Analysis</strong> - Pre-Earthquake<br />
Condition<br />
Material Parameters for <strong>Dynamic</strong> Response <strong>Analysis</strong><br />
Post-Earthquake Factors <strong>of</strong> Safety for Hayward Fault MCE<br />
Yield Acceleration Coefficients <strong>of</strong> Selected Sliding Blocks for Various Levels <strong>of</strong><br />
Post-cyclic Strength Reduction in Embankment and Foundation Materials<br />
Calculated Horizontal Displacement in Newmark-type Analyses<br />
Sensitivity <strong>Analysis</strong> <strong>of</strong> Calculated Horizontal displacement to Uncertainties in<br />
Embankment and Foundation Conditions - Hayward Fault MCE<br />
Material Properties for Seepage <strong>Analysis</strong><br />
Material Properties for Static Stress <strong>Analysis</strong><br />
Material Properties for <strong>Dynamic</strong> <strong>Analysis</strong><br />
Site Location Map<br />
Location <strong>of</strong> <strong>Chabot</strong> <strong>Dam</strong><br />
Site Plan<br />
Instrument Locations<br />
X:\X_GEO\CHABOT DAM\TASK G -- ENGINEERING REPORT\DRAFT FINAL\DYNAMIC STABILITY ANALYSIS_R4.DOC\30-AUG-05\\ iv
List <strong>of</strong> Tables, Figures and Appendices<br />
Figure 4-1 Location <strong>of</strong> Borings From Previous Studies<br />
Figure 4-2 Boring Locations<br />
Figure 5-1 Site Geological Map<br />
Figure 6-1 Seismic Sources Map<br />
Figure 6-2 Calculated 84th-percentile Acceleration Response Spectra for Hayward-Rodgers<br />
Creek Fault MCE<br />
Figure 6-3 Calculated 84th-percentile Acceleration Response Spectra for San Andreas Fault<br />
MCE<br />
Figure 6-4 Design Acceleration Response Spectra for Hayward-Rodgers Creek Fault MCE<br />
Figure 6-5 Design Acceleration Response Spectra for San Andreas Fault MCE<br />
Figure 6-6 Recorded Time History, 1992 Landers, CA, Earthquake at Lucerne Valley<br />
Station, Horizontal Component, 000 deg.<br />
Figure 6-7 Acceleration Response Spectra, 1992 Landers, CA, Earthquake at Lucerne Valley<br />
Station, Horizontal Component 000 deg.<br />
Figure 6-8 Recorded Time History, 1992 Landers, CA, Earthquake at Lucerne Valley<br />
Station, Horizontal Component, 270 deg.<br />
Figure 6-9 Acceleration Response Spectra, 1992 Landers, CA, Earthquake at Lucerne Valley<br />
Station, Horizontal Component 270 deg.<br />
Figure 6-10 Recorded Time History, 2002 Denali, Alaska, Earthquake at Carlo, Alaska<br />
Station, Horizontal Component, 360 deg.<br />
Figure 6-11 Acceleration Response Spectra, 2002 Denali, Alaska, Earthquake at Carlo, Alaska<br />
Station, Horizontal Component 360 deg.<br />
Figure 6-12 Hayward-Rodgers Creek Fault MCE, Recommended Time History No. 1<br />
Figure 6-13 Hayward-Rodgers Creek Fault MCE, Recommended Time History No. 2<br />
Figure 6-14 Comparison <strong>of</strong> Acceleration Response Spectra for Hayward-Rodgers Creek Fault<br />
MCE<br />
Figure 6-15 San Andreas Fault MCE, Recommended Time History<br />
Figure 6-16 Comparison <strong>of</strong> Acceleration Response Spectra for San Andreas Fault MCE<br />
Figure 7-1 Plan View <strong>of</strong> <strong>Dam</strong> and Cross-Sections<br />
Figure 7-2 GIS Model – Distribution <strong>of</strong> Soil Types in Embankment and Foundation<br />
Figure 7-3 Cross Section A-A’<br />
Figure 7-4 Cross Section B-B’<br />
Figure 7-5 Cross Section C-C’<br />
Figure 7-6 Gradation <strong>of</strong> Wagon Fill in Downstream Shell Borings<br />
Figure 7-7 Gradation <strong>of</strong> Wagon Fill in Upstream Shell Borings<br />
X:\X_GEO\CHABOT DAM\TASK G -- ENGINEERING REPORT\DRAFT FINAL\DYNAMIC STABILITY ANALYSIS_R4.DOC\30-AUG-05\\ v
List <strong>of</strong> Tables, Figures and Appendices<br />
Figure 7-8<br />
Figure 7-9<br />
Figure 7-10<br />
Figure 7-11<br />
Figure 7-12<br />
Figure 7-13<br />
Figure 7-14<br />
Figure 7-15<br />
Figure 7-16<br />
Figure 7-17<br />
Figure 7-18<br />
Figure 7-19<br />
Figure 7-20<br />
Figure 7-21<br />
Figure 7-22<br />
Figure 7-23<br />
Figure 7-24<br />
Figure 7-25<br />
Figure 7-26<br />
Figure 7-27<br />
Figure 7-28<br />
Figure 7-29<br />
Figure 7-30<br />
Figure 7-31<br />
Figure 7-32<br />
Figure 7-33<br />
Figure 7-34<br />
Figure 7-35<br />
Figure 7-36<br />
Gradation <strong>of</strong> Wagon Fill in Crest Borings<br />
Gravel Content From Borings WI-59, 61, 62, 64, 66 and 67, Wagon Fill Zone<br />
Gravel Content From Previous Borings in Wagon Fill Zone<br />
Fines Content From Borings WI-59, 61, 62, 64, 66 and 67, Wagon Fill Zone<br />
Fines Content From Previous Borings in Wagon Fill Zone<br />
Plasticity From Borings WI-59, 61, 62, 64, 66 and 67, Wagon Fill Zone (by<br />
Material Zone)<br />
Plasticity From Previous Borings in Wagon Fill Zone<br />
Plasticity From Borings WI-59, 61, 62, 64, 66 and 67, Wagon Fill Zone (By Soil<br />
Classification)<br />
Plasticity Index From Borings WI-59, 61, 62, 64, 66 and 67, Wagon Fill Zone<br />
Liquid Limit From Borings WI-59, 61, 62, 64, 66 and 67, Wagon Fill Zone<br />
Dry Unit Weight From Borings WI-59, 61, 62, 64, 66 and 67, Wagon Fill Zone<br />
Dry Unit Weight From Previous Borings in Wagon Fill Zone<br />
Moisture Content From Borings WI-59, 61, 62, 64, 66 and 67, Wagon Fill Zone<br />
Moisture Content From Previous Borings in Wagon Fill Zone<br />
Total Unit Weight From Borings WI-59, 61, 62, 64, 66 and 67, Wagon Fill Zone<br />
Wagon Fill, Effective Shear Strength from CIU Triaxial Compression Tests<br />
Wagon Fill, Total Shear Strength From CIU Triaxial Compression Tests<br />
Wagon Fill, Effective Shear Strength From CIU Triaxial Compression Tests,<br />
Comparison with Prior Data<br />
Wagon Fill, Total Shear Strength From CIU Triaxial Compression Tests,<br />
Comparison with Prior Data<br />
Wagon Fill, Total Shear Strength From S&W CU Triaxial Compression Tests on<br />
Modified California Samples<br />
Liquefaction Susceptibility Chart, WI-59, 61, 62, 64, 66 and 67, Wagon Fill Zone<br />
Gradation <strong>of</strong> Sluiced Fill in Downstream Toe Borings<br />
Fines Content From Borings WI-60, 63 and 65, Sluiced Fill Zone<br />
Fines Content From Previous Borings in Sluiced Fill Zone<br />
Gravel Content From Borings WI-60, 63 and 65, Sluiced Fill Zone<br />
Gravel Content From Previous Borings in Sluiced Fill Zone<br />
Plasticity From Borings WI-60, 63 and 65, Sluiced Fill Zone<br />
Plasticity From Previous Borings in Sluiced Fill Zone<br />
Dry Unit Weight From Previous Borings in Sluiced Fill Zone<br />
X:\X_GEO\CHABOT DAM\TASK G -- ENGINEERING REPORT\DRAFT FINAL\DYNAMIC STABILITY ANALYSIS_R4.DOC\30-AUG-05\\ vi
List <strong>of</strong> Tables, Figures and Appendices<br />
Figure 7-37 Moisture Content From Previous Borings in Sluiced Fill Zone<br />
Figure 7-38 Total Unit Weight From Previous Borings in Sluiced Fill Zone<br />
Figure 7-39 Gradation <strong>of</strong> Foundation Soil<br />
Figure 9-1 Plan View <strong>of</strong> <strong>Dam</strong> and <strong>Analysis</strong> Cross-sections<br />
Figure 9-2 Idealized Cross Section A-A’ for <strong>Stability</strong> <strong>Analysis</strong><br />
Figure 9-3 Idealized Cross Section B-B’ for <strong>Stability</strong> <strong>Analysis</strong><br />
Figure 9-4 Modified Cross Section A-A’ for <strong>Stability</strong> <strong>Analysis</strong><br />
Figure 9-5 Composite Downstream Section A-A” for <strong>Stability</strong> <strong>Analysis</strong><br />
Figure 9-6 Static <strong>Stability</strong> <strong>Analysis</strong>, Long-Term Condition, Cross Section A-A’<br />
Figure 9-7 Static <strong>Stability</strong> <strong>Analysis</strong>, Long-Term Condition, Modified Cross Section A-A’<br />
Figure 9-8 Seismic <strong>Stability</strong> <strong>Analysis</strong>, Pre-Earthquake Condition, Cross Section A-A’<br />
Figure 9-9 Seismic <strong>Stability</strong> <strong>Analysis</strong>, Pre-Earthquake Condition, Modified Cross<br />
Section A-A’<br />
Figure 9-10 Seismic <strong>Stability</strong> <strong>Analysis</strong>, Pseudo-Static Loading, (Pre-Earthquake Strengths),<br />
Cross Section A-A’<br />
Figure 9-11 Seismic <strong>Stability</strong> <strong>Analysis</strong>, Pseudo-Static Loading, (Pre-Earthquake Strengths),<br />
Modified Cross Section A-A’<br />
Figure 9-12 Static <strong>Stability</strong> <strong>Analysis</strong>, Long-Term Condition, Cross Section B-B’<br />
Figure 9-13 Seismic <strong>Stability</strong> <strong>Analysis</strong>, Pre-Earthquake Condition, Cross Section B-B’<br />
Figure 9-14 Seismic <strong>Stability</strong> <strong>Analysis</strong>, Pre-Earthquake Condition, Downstream Section A-A”<br />
Figure 10-1 Finite Element/Difference Mesh Cross, Section A-A’<br />
Figure 10-2 1989 Loma Prieta Earthquake, Acceleration Time History, (CSUH Stadium<br />
A3E000)<br />
Figure 10-3 Seismic Wave Velocity Pr<strong>of</strong>iles and Stratigraphy <strong>of</strong> Boring WI-61<br />
Figure 10-4 Seismic Wave Velocity Pr<strong>of</strong>iles and Stratigraphy <strong>of</strong> Boring WI-59<br />
Figure 10-5 Seismic Wave Velocity Pr<strong>of</strong>iles and Stratigraphy <strong>of</strong> Boring WI-62<br />
Figure 10-6 Seismic Wave Velocity Pr<strong>of</strong>iles and Stratigraphy <strong>of</strong> Boring WI-60<br />
Figure 10-7 Selected Element Locations for Stress Time-History Plots, QUAD4M <strong>Analysis</strong><br />
Figure 10-8 Selected Nodal Points for Acceleration Outputs, QUAD4M <strong>Analysis</strong><br />
Figure 10-9 Sliding Blocks for Newmark Deformation Analyses, Cross Section A-A’<br />
Figure 10-10 Peak Horizontal Acceleration, QUAD4M <strong>Analysis</strong>, 1989 Loma Prieta Earthquake<br />
Figure 10-11 Cyclic Stress Ratio, QUAD4M <strong>Analysis</strong>, 1989 Loma Prieta Earthquake<br />
Figure 10-12 Average Mass Acceleration, Upstream Sliding Blocks, QUAD4M <strong>Analysis</strong>, 1989<br />
Loma Prieta Earthquake<br />
X:\X_GEO\CHABOT DAM\TASK G -- ENGINEERING REPORT\DRAFT FINAL\DYNAMIC STABILITY ANALYSIS_R4.DOC\30-AUG-05\\ vii
List <strong>of</strong> Tables, Figures and Appendices<br />
Figure 10-13 Average Mass Acceleration, Downstream Sliding Blocks, QUAD4M <strong>Analysis</strong>,<br />
1989 Loma Prieta Earthquake<br />
Figure 10-14 Average Mass Acceleration, Downstream Sliding Block #4, QUAD4M <strong>Analysis</strong>,<br />
1989 Loma Prieta Earthquake<br />
Figure 10-15 Peak Horizontal Acceleration, QUAD4M <strong>Analysis</strong>, Hayward Fault MCE TH #1<br />
Figure 10-16 Acceleration Time History Beneath Crest Nodes 1145, 1147 and 1149, Hayward<br />
Fault MCE TH #1<br />
Figure 10-17 Acceleration Time History Beneath Crest Nodes 1160 and 1179, Hayward Fault<br />
MCE TH #1<br />
Figure 10-18 Peak Shear Stress, QUAD4M <strong>Analysis</strong>, Hayward Fault MCE TH #1<br />
Figure 10-19 Shear Stress Time History, Beneath Crest Elements 1095, 1101, and 1106,<br />
Hayward Fault MCE TH #1<br />
Figure 10-20 Shear Stress Time History, Beneath Crest Elements 1112 and 1117, Hayward<br />
Fault MCE TH #1<br />
Figure 10-21 Cyclic Stress Ratio, QUAD4M <strong>Analysis</strong>, Hayward Fault MCE TH #1<br />
Figure 10-22 Peak Horizontal Acceleration, QUAD4M <strong>Analysis</strong>, San Andreas Fault MCE<br />
Figure 10-23 Peak Shear Stress, QUAD4M <strong>Analysis</strong>, San Andreas Fault MCE<br />
Figure 10-24 Cyclic Stress Ratio, QUAD4M <strong>Analysis</strong>, San Andreas Fault MCE<br />
Figure 11-1 SPT-Based Liquefaction Triggering Correlations for Mw 7.5 Earthquakes (1996<br />
and 1998 NCEER/NSF Workshops)<br />
Figure 11-2 SPT Blow Counts N60 From Borings in Sluiced Fill Zone<br />
Figure 11-3 Adjustment <strong>of</strong> Nbc for Casing Friction on BPT-1, 2 and 3<br />
Figure 11-4 Becker Penetration Test BPT-1<br />
Figure 11-5 SPT Resistance N60 From Borings WI-60 and BPT-1<br />
Figure 11-6 SPT Resistance N60 From Borings WI-63 and BPT-2<br />
Figure 11-7 SPT Resistance N60 From Borings WI-65 and BPT-3<br />
Figure 11-8 Equivalent SPT N1,60 and Stratigraphy From Boring BPT-1<br />
Figure 11-9 Equivalent SPT N1,60 and Stratigraphy From Boring BPT-2<br />
Figure 11-10 Equivalent SPT N1,60 and Stratigraphy From Boring BPT-3<br />
Figure 11-11 Factors <strong>of</strong> Safety Against Liquefaction in Sluiced Fill, 1989 Loma Prieta<br />
Earthquake<br />
Figure 11-12 Factors <strong>of</strong> Safety Against Liquefaction in Sluiced Fill, Hayward Fault MCE TH<br />
#1<br />
Figure 11-13 Factors <strong>of</strong> Safety Against Liquefaction in Sluiced Fill, San Andreas Fault MCE<br />
Figure 11-14 Correlations Between Undrained Residual Strength and Equivalent Clean Sand,<br />
SPT Corrected Blow Counts (Idriss, 2002)<br />
X:\X_GEO\CHABOT DAM\TASK G -- ENGINEERING REPORT\DRAFT FINAL\DYNAMIC STABILITY ANALYSIS_R4.DOC\30-AUG-05\\ viii
List <strong>of</strong> Tables, Figures and Appendices<br />
Figure 11-15 Cyclic Strength and Undrained Strength Degradation <strong>of</strong> Saturated Wagon Fill and<br />
Foundation Soils<br />
Figure 11-16 Excess Pore Pressure Ratio in Wagon Fill and Foundation Soils, 1989 Loma<br />
Prieta Earthquake<br />
Figure 11-17 Excess Pore Pressure Ratio in Wagon Fill and Foundation Soils, Hayward Fault<br />
MCE TH #1<br />
Figure 11-18 Excess Pore Pressure Ratio in Wagon Fill and Foundation Soils, San Andreas<br />
Fault MCE<br />
Figure 11-19 Seismic <strong>Stability</strong> <strong>Analysis</strong>, Post-Earthquake Condition, Downstream Section A-<br />
A”, Hayward Fault MCE<br />
Figure 11-20 Newmark Deformation <strong>Analysis</strong>, Calculated Displacement, U/S Block #1,<br />
Hayward Fault MCE TH #1<br />
Figure 11-21 Newmark Deformation <strong>Analysis</strong>, Calculated Displacement, U/S Block #2,<br />
Hayward Fault MCE TH #1<br />
Figure 11-22 Newmark Deformation <strong>Analysis</strong>, Calculated Displacement, U/S Block #3<br />
Hayward Fault MCE TH #1<br />
Figure 11-23 Newmark Deformation <strong>Analysis</strong>, Calculated Displacement, D/S Block #1,<br />
Hayward Fault MCE TH #1<br />
Figure 11-24 Newmark Deformation <strong>Analysis</strong>, Calculated Displacement, D/S Block #2,<br />
Hayward Fault MCE TH #1<br />
Figure 11-25 Newmark Deformation <strong>Analysis</strong>, Calculated Displacement, D/S Block #3,<br />
Hayward Fault MCE TH #1<br />
Figure 11-26 Newmark Deformation <strong>Analysis</strong>, Calculated Displacement, D/S Block #4,<br />
Hayward Fault MCE TH #1<br />
Figure 11-27 Newmark Deformation <strong>Analysis</strong>, Calculated Displacement, U/S Block #1,<br />
Hayward Fault MCE TH #1 (10% Max. Strength Reduction)<br />
Figure 11-28 Newmark Deformation <strong>Analysis</strong>, Calculated Displacement, U/S Block #3,<br />
Hayward Fault MCE TH #1 (10% Max. Strength Reduction)<br />
Figure 11-29 Newmark Deformation <strong>Analysis</strong>, Calculated Displacement, D/S Block #1,<br />
Hayward Fault MCE TH #1 (10% Max. Strength Reduction)<br />
Figure 11-30 Newmark Deformation <strong>Analysis</strong>, Calculated Displacement, U/S Block #1, San<br />
Andreas Fault MCE<br />
Figure 11-31 Newmark Deformation <strong>Analysis</strong>, Calculated Displacement, U/S Block #3, San<br />
Andreas Fault MCE<br />
Figure 11-32 Newmark Deformation <strong>Analysis</strong>, Calculated Displacement, D/S Block #4, San<br />
Andreas Fault MCE<br />
Figure 11-33 Newmark Deformation <strong>Analysis</strong>, Calculated Displacement, U/S Block #1, San<br />
Andreas Fault MCE (10% Max. Strength Reduction)<br />
X:\X_GEO\CHABOT DAM\TASK G -- ENGINEERING REPORT\DRAFT FINAL\DYNAMIC STABILITY ANALYSIS_R4.DOC\30-AUG-05\\ ix
List <strong>of</strong> Tables, Figures and Appendices<br />
Figure 11-34 Newmark Deformation <strong>Analysis</strong>, Calculated Displacement, U/S Block #3, San<br />
Andreas Fault MCE (10% Max. Strength Reduction)<br />
Figure 11-35 Newmark Deformation <strong>Analysis</strong>, Calculated Displacement, D/S Block #1<br />
(Modified Section A-A’), Hayward Fault MCE TH #1<br />
Figure 11-36 Newmark Deformation <strong>Analysis</strong>, Calculated Displacement, D/S Block #3<br />
(Modified Section A-A’), Hayward Fault MCE TH #1<br />
Figure 11-37 Alternative Cross Section A-A’ for <strong>Stability</strong> <strong>Analysis</strong><br />
Figure 11-38 Seismic <strong>Stability</strong> <strong>Analysis</strong>, Pre-Earthquake Condition, Alternative Cross<br />
Section A-A’<br />
Figure 11-39 Seismic <strong>Stability</strong> <strong>Analysis</strong>, Condition with 20% Strength Reduction, Alternative<br />
Cross Section A-A’<br />
Figure 11-40 Alternative Cross Section A-A’, Calculated Displacement, U/S Block #2,<br />
Hayward MCE Time-History #1<br />
Figure 11-41 Seismic <strong>Stability</strong> <strong>Analysis</strong>, Pre-Earthquake Condition, Alternative Modified<br />
Section A-A’<br />
Figure 11-42 Seismic <strong>Stability</strong> <strong>Analysis</strong>, Condition with 20% Strength Reduction, Alternative<br />
Modified Section A-A’<br />
Figure 11-43 Alternative Cross Section A-A’, Calculated Displacement, D/S Block #2,<br />
Hayward MCE Time-History #1<br />
Figure 11-44 Alternative Modified Section A-A’, Calculated Displacement, D/S Block #2,<br />
Hayward MCE Time-History #1<br />
Figure 12-1 FLAC <strong>Analysis</strong>, Pore Pressure Generation Model<br />
Figure 12-2 Mohr-Coulomb and Residual Strength Envelope<br />
Figure 12-3 Cyclic Strength <strong>of</strong> Saturated Sluiced Fill<br />
Figure 12-4 Cyclic Strength and Undrained Strength Degradation <strong>of</strong> Saturated Wagon Fill and<br />
Foundation Soils<br />
Figure 12-5 Acceleration at <strong>Dam</strong> Crest and Rock Outcrop, 1989 Loma Prieta Earthquake<br />
Figure 12-6 Excess Pore Pressure Ratio in Sluiced Fill, 1989 Loma Prieta Earthquake<br />
Figure 12-7 Cyclic Degradation <strong>of</strong> Wagon Fill and Foundation Soils, 1989 Loma Prieta<br />
Earthquake<br />
Figure 12-8 Calculated Displacement Vectors, 1989 Loma Prieta Earthquake<br />
Figure 12-9 Acceleration at <strong>Dam</strong> Crest and Rock Outcrop, Hayward Fault MCE TH #1<br />
Figure 12-10 Time Histories <strong>of</strong> Cyclic Degradation and Pore Pressure Ratio, Hayward Fault<br />
MCE TH #1<br />
Figure 12-11 Cyclic Degradation <strong>of</strong> Saturated Wagon Fill and Foundation Soils, Hayward Fault<br />
MCE TH #1<br />
Figure 12-12 Calculated Displacement Vectors, Hayward Fault MCE TH #1<br />
X:\X_GEO\CHABOT DAM\TASK G -- ENGINEERING REPORT\DRAFT FINAL\DYNAMIC STABILITY ANALYSIS_R4.DOC\30-AUG-05\\ x
List <strong>of</strong> Tables, Figures and Appendices<br />
Figure 12-13 Calculated Horizontal Displacement, Time Histories, Hayward Fault MCE TH #1<br />
Figure 12-14 Calculated Vertical Displacement, Time Histories, Hayward Fault MCE TH #1<br />
Figure 12-15 Post-Earthquake <strong>Stability</strong> <strong>of</strong> Downstream Slope, Hayward Fault MCE TH #1<br />
Figure 12-16 Post-Earthquake <strong>Stability</strong> <strong>of</strong> Upstream Slope, Hayward Fault MCE TH #1<br />
Appendices<br />
Appendix A Exploratory Drilling<br />
Appendix B Becker Penetration Testing<br />
Appendix C SPT Energy Measurements<br />
Appendix D BPT Energy Measurements<br />
Appendix E Downhole Geophysical Survey<br />
Appendix F Laboratory Testing<br />
Appendix G Site Geology<br />
Appendix H Seismotectonic Setting and Seismic Sources<br />
Appendix I 3-D GIS Model – Existing Boring Data<br />
X:\X_GEO\CHABOT DAM\TASK G -- ENGINEERING REPORT\DRAFT FINAL\DYNAMIC STABILITY ANALYSIS_R4.DOC\30-AUG-05\\ xi
Executive Summary<br />
This report presents the results <strong>of</strong> a dynamic stability study <strong>of</strong> <strong>Chabot</strong> <strong>Dam</strong>. The dam is located<br />
near the city <strong>of</strong> San Leandro in Alameda County, California, within the <strong>East</strong> <strong>Bay</strong> hills,<br />
approximately 0.5 kilometers (km) east <strong>of</strong> the Hayward fault. <strong>Chabot</strong> <strong>Dam</strong> is owned and<br />
operated by the <strong>East</strong> <strong>Bay</strong> Municipal Utility District (EBMUD).<br />
The dam is approximately 135 feet high and 500 feet long and has a 30-foot-wide crest. The<br />
main body <strong>of</strong> the dam (referred to as “wagon fill”) was placed and compacted by teams <strong>of</strong> horses<br />
and wagons to a crest elevation <strong>of</strong> 233 1 during 1874 and 1875. A hydraulic fill buttress (referred<br />
to as “sluiced fill”) was placed at the downstream toe <strong>of</strong> the embankment between 1875 and<br />
1888. Additional fill was placed along the upstream and downstream slopes and the crest was<br />
raised to elevation 243 between 1890 and 1892. During further dam modifications in 1980,<br />
engineered fill was placed along the downstream slope to raise the crest to the current elevation<br />
250. A new spillway was also constructed as part <strong>of</strong> the 1980 modifications. Random fill<br />
consisting <strong>of</strong> excess materials from the new spillway excavation and from demolition <strong>of</strong> the old<br />
spillway was placed near the downstream toe.<br />
In March 2003, the California Department <strong>of</strong> Water Resources, Division <strong>of</strong> Safety <strong>of</strong> <strong>Dam</strong>s<br />
(DSOD) conducted a simplified dynamic analysis <strong>of</strong> <strong>Chabot</strong> <strong>Dam</strong>, as part <strong>of</strong> a reevaluation <strong>of</strong><br />
dams located near active faults. The study presented herein was conducted in response to a<br />
directive from DSOD to EBMUD to evaluate the dynamic stability <strong>of</strong> the dam. The purpose <strong>of</strong><br />
the study was to evaluate the seismic hazard at the site and to re-evaluate the seismic stability <strong>of</strong><br />
the dam using current state-<strong>of</strong>-the-practice techniques. The scope <strong>of</strong> work included reviewing<br />
the existing project data, performing field and laboratory investigations, developing site-specific<br />
earthquake design criteria, evaluating the dynamic stability and deformations <strong>of</strong> the dam, and<br />
preparing a report summarizing the analysis results and conclusions.<br />
A comprehensive field exploration was carried out including geologic mapping, exploratory<br />
drilling, Becker Penetration testing (BPT), and downhole geophysical surveys. Samples<br />
retrieved from the field were subsequently examined in the URS Pleasant Hill Laboratory and<br />
tested for engineering properties and strengths. The subsurface data obtained from this study and<br />
from previous investigations were entered into a 3-dimensional Geographic Information System<br />
(GIS) database and were used to develop representative embankment cross-sections.<br />
The study included development <strong>of</strong> site-specific earthquake ground motions for use in the dam<br />
stability analysis. The controlling sources were determined to be the Hayward-Rodgers Creek<br />
and San Andreas faults. The maximum credible earthquake (MCE) on the Hayward-Rodgers<br />
Creek fault was determined to be a magnitude 7.25 earthquake with a peak horizontal ground<br />
acceleration (PGA) <strong>of</strong> 1.05 g. The MCE on the San Andreas fault was found to be a magnitude 8<br />
event with a PGA <strong>of</strong> 0.33 g. Two acceleration time-histories were developed to represent the<br />
earthquake ground motions for dynamic stability analysis under the Hayward fault MCE, and<br />
one time history was developed for the San Andreas fault MCE.<br />
Based on its index properties including gradation, plasticity and moisture content, the wagon fill<br />
is judged not to be susceptible to liquefaction. Similarly, the foundation soils are judged not to<br />
be susceptible to liquefaction. However, the sluiced fill, which consists <strong>of</strong> primarily gravelly<br />
clayey sand, is liquefaction-susceptible due to its loose state and relatively low fines content.<br />
1 Unless otherwise noted, all elevations in this report are given in feet and refer to USGS datum.<br />
X:\X_GEO\CHABOT DAM\TASK G -- ENGINEERING REPORT\DRAFT FINAL\DYNAMIC STABILITY ANALYSIS_R4.DOC\30-AUG-05\\OAK ES-1
Executive Summary<br />
The cyclic strength <strong>of</strong> the wagon fill and foundation soils were evaluated based on the results <strong>of</strong><br />
laboratory cyclic triaxial tests previously performed by others. The post-cyclic strength <strong>of</strong> the<br />
materials was evaluated from published data for similar materials. The liquefaction resistance<br />
and post-liquefaction residual strength <strong>of</strong> the sluiced fill were evaluated based on its standard<br />
penetration test (SPT) blow count.<br />
The seismic stability <strong>of</strong> the dam was evaluated using the Seed-Lee-Idriss approach (Seed, 1979).<br />
This approach consists <strong>of</strong> evaluating the dynamic response <strong>of</strong> the dam to the design earthquake<br />
motions, evaluating the potential for strength loss <strong>of</strong> the embankment and foundation materials<br />
under the earthquake shaking, estimating the deformations likely to be induced by the<br />
earthquake, and assessing the post-earthquake stability <strong>of</strong> the dam and its overall condition after<br />
the earthquake. The seismic response and deformations <strong>of</strong> the dam were also evaluated using a<br />
nonlinear analysis approach in which the above steps are coupled in a single analysis. The<br />
nonlinear analyses were performed with the computer program FLAC.<br />
The design earthquake was defined as the MCE on the Hayward-Rodgers Creek fault since this<br />
earthquake is likely to generate the strongest ground motions at the site. Because the MCE on<br />
the San Andreas fault could result in strong shaking <strong>of</strong> long duration, the seismic stability <strong>of</strong> the<br />
dam was also evaluated for that earthquake. As a check <strong>of</strong> the analysis procedures, the dynamic<br />
response and deformations <strong>of</strong> the dam were also analyzed for motions representative <strong>of</strong> the 1989<br />
Loma Prieta earthquake, for which the general performance <strong>of</strong> the dam is known.<br />
The analyses indicate that the dam will experience deformations during the MCE on the<br />
Hayward fault, but will remain stable. No liquefaction <strong>of</strong> the wagon fill is expected because <strong>of</strong><br />
its overall clayey nature, but the earthquake is likely to induce high excess pore pressures in<br />
these materials with accompanying strength reduction. Likewise, no widespread liquefaction <strong>of</strong><br />
the foundation soils is expected, except possibly in interspersed pockets <strong>of</strong> sands and gravels.<br />
However, such pockets appear to be confined primarily to near the stream channel and are<br />
unlikely to affect the overall stability <strong>of</strong> the dam. The sluiced fill at the downstream toe <strong>of</strong> the<br />
dam is expected to liquefy early in the strong shaking phase <strong>of</strong> the earthquake and to deform<br />
subsequently.<br />
The analyses for the Hayward fault MCE result in calculated downward vertical displacements<br />
<strong>of</strong> the crest between 1 and 6 feet. Considering the limitations <strong>of</strong> the methods <strong>of</strong> analysis, the best<br />
estimate <strong>of</strong> the maximum crest settlements is between 1.5 and 3.5 feet. These settlements<br />
correspond to about 1.1% to 2.5% <strong>of</strong> the structural dam height and are generally consistent with<br />
the past seismic performance <strong>of</strong> embankment dams, considering the age <strong>of</strong> <strong>Chabot</strong> <strong>Dam</strong> and the<br />
methods used for its construction.<br />
The best estimate <strong>of</strong> horizontal displacements <strong>of</strong> the upstream slope is less than 5 feet.<br />
Progressive sliding <strong>of</strong> the dam and instability <strong>of</strong> the crest are not expected to occur. Except for<br />
the sluiced fill, horizontal displacements <strong>of</strong> the downstream slope are expected to be less than 2<br />
feet. Displacements <strong>of</strong> several feet may occur in the sluiced fill in the direction <strong>of</strong> the<br />
downstream channel. The stability analyses indicate that such displacements, however, are<br />
unlikely to lead to instability <strong>of</strong> the main body <strong>of</strong> the embankment.<br />
Because the dam has a freeboard <strong>of</strong> about 23 feet, the estimated crest settlements will not lead to<br />
overtopping <strong>of</strong> the embankment. However, the expected settlements and horizontal<br />
deformations will likely result in longitudinal and transverse cracking <strong>of</strong> the embankment crest<br />
and may require drawdown <strong>of</strong> the reservoir immediately after the earthquake. The estimated<br />
X:\X_GEO\CHABOT DAM\TASK G -- ENGINEERING REPORT\DRAFT FINAL\DYNAMIC STABILITY ANALYSIS_R4.DOC\30-AUG-05\\OAK ES-2
Executive Summary<br />
dam deformations are not expected to affect the structural integrity <strong>of</strong> the spillway or outlet<br />
works. A separate study has been undertaken by EBMUD to evaluate the seismic stability <strong>of</strong> the<br />
outlet tower.<br />
Transverse cracking <strong>of</strong> the embankment is most likely to develop near the abutments because <strong>of</strong><br />
their steep nature. Transverse cracking is <strong>of</strong> particular concern as it could provide a mechanism<br />
for leakage, if it were to extend below the reservoir level and to be continuous across the dam<br />
crest or to be interconnected by longitudinal cracking.<br />
The potential for developing through-going transverse cracks will be tempered by the width <strong>of</strong><br />
the embankment. In addition, the likelihood <strong>of</strong> leakage will be a function <strong>of</strong> the reservoir level at<br />
the time <strong>of</strong> the earthquake. Nonetheless, transverse cracking that extends below the reservoir<br />
elevation, even if not continuous across the embankment, would increase seepage and the<br />
potential for leakage immediately after the earthquake. On this basis and given that the dam<br />
lacks an internal filter and drainage system to safely control possible leakage and its consequent<br />
effects, it may be concluded that the potential for transverse cracking represents a risk regarding<br />
the safety <strong>of</strong> the structure. The significance <strong>of</strong> this risk is to be further considered by EBMUD.<br />
The analyses for the San Andreas fault MCE result in a dynamic response <strong>of</strong> the embankment<br />
lower than that calculated for the Hayward fault MCE. Nonetheless, liquefaction and<br />
deformations <strong>of</strong> the sluiced fill are also expected to occur during the San Andreas fault MCE.<br />
The calculated dam deformations for the San Andreas event are lower than those for the<br />
Hayward event. Thus, the results <strong>of</strong> the analyses indicate that the San Andreas event is less<br />
critical than the Hayward event regarding the seismic stability <strong>of</strong> the dam.<br />
X:\X_GEO\CHABOT DAM\TASK G -- ENGINEERING REPORT\DRAFT FINAL\DYNAMIC STABILITY ANALYSIS_R4.DOC\30-AUG-05\\OAK ES-3
1. Section 1 ONE Introduction<br />
SECTIONONE<br />
Introduction<br />
1.1 BACKGROUND<br />
This report presents the results <strong>of</strong> a dynamic stability study <strong>of</strong> <strong>Chabot</strong> <strong>Dam</strong>, located near the City<br />
<strong>of</strong> San Leandro in Alameda County, California (Figure 1-1). The dam and reservoir were<br />
initially constructed between 1874 and 1892. <strong>Chabot</strong> <strong>Dam</strong> is owned and operated by the <strong>East</strong><br />
<strong>Bay</strong> Municipal Utility District (EBMUD).<br />
1.2 PURPOSE AND OBJECTIVES<br />
The stability <strong>of</strong> <strong>Chabot</strong> <strong>Dam</strong> has been the subject <strong>of</strong> several previous investigations, including<br />
those by Shannon and Wilson (S&W) (1965), Woodward-Lundgren & Associates (WLA)<br />
(1974), and Woodward-Clyde Consultants (WCC) (1977). Those studies are briefly described<br />
below.<br />
In 2003, the California Department <strong>of</strong> Water Resources, Division <strong>of</strong> Safety <strong>of</strong> <strong>Dam</strong>s (DSOD)<br />
conducted a simplified dynamic analysis <strong>of</strong> the dam as part <strong>of</strong> a statewide reevaluation <strong>of</strong> dams<br />
located near high-slip rate faults. On that basis, they asked EBMUD to perform a more detailed<br />
dynamic stability study <strong>of</strong> the dam. The study presented herein was conducted in response to<br />
DSOD’s request. The purpose <strong>of</strong> the study was to evaluate the seismic hazard at the site based<br />
on the current understanding <strong>of</strong> the tectonic and geologic setting <strong>of</strong> the region, evaluate the<br />
strengths <strong>of</strong> the embankment and foundation materials, and reevaluate the seismic stability <strong>of</strong> the<br />
dam using current state-<strong>of</strong>-practice analytical techniques.<br />
1.3 PREVIOUS INVESTIGATIONS<br />
Shannon and Wilson investigated the dam and performed stability analyses in 1965. EBMUD<br />
and S&W drilled 19 borings in the crest and downstream slope <strong>of</strong> the dam to identify the<br />
materials and retrieve samples for testing. The slope stability <strong>of</strong> the dam was analyzed under<br />
steady seepage conditions, pseudo-static conditions, and rapid drawdown conditions, using limitequilibrium<br />
methods. The study concluded that the dam had adequate factors <strong>of</strong> safety, but made<br />
recommendations for minor improvements. Following the S&W study, EBMUD placed a fillet<br />
fill on the downstream slope <strong>of</strong> the dam and installed a subdrain system at the downstream toe.<br />
Woodward-Lundgren and Associates performed an evaluation <strong>of</strong> the seismic stability <strong>of</strong> the dam<br />
in 1974. EBMUD and WLA drilled 15 borings in the upstream and downstream shells <strong>of</strong> the<br />
dam. The soil samples were tested by EBMUD and WLA for index properties and cyclic<br />
strength. The dynamic response <strong>of</strong> the dam was evaluated using the finite element method. The<br />
investigation predicted limited overall deformation <strong>of</strong> the dam during San Andreas and Hayward<br />
earthquake events, but indicated the possibility <strong>of</strong> surface sloughing <strong>of</strong> the upstream slope and<br />
accompanying crest settlement.<br />
Woodward-Clyde Consultants re-evaluated the seismic stability <strong>of</strong> the dam in 1977. Three<br />
additional borings were drilled in the crest and downstream embankment and samples were<br />
retrieved and tested. The study predicted maximum crest settlements <strong>of</strong> about 3 to 5 feet. On<br />
that basis, an increase in crest elevation <strong>of</strong> 5 feet was recommended. EBMUD subsequently<br />
X:\X_GEO\CHABOT DAM\TASK G -- ENGINEERING REPORT\DRAFT FINAL\DYNAMIC STABILITY ANALYSIS_R4.DOC\30-AUG-05\\OAK 1-1
SECTIONONE<br />
Introduction<br />
placed compacted fill on the downstream slope <strong>of</strong> the dam and raised the crest from elevation<br />
243 2 to 250. As part <strong>of</strong> the project, EBMUD also constructed a new spillway.<br />
1.4 REPORT ORGANIZATION<br />
This report is organized into fifteen sections and eight appendices. After this introductory<br />
section, Section 2 presents the scope <strong>of</strong> work <strong>of</strong> the study. A brief description <strong>of</strong> the project and<br />
information on the construction and performance <strong>of</strong> the dam are summarized in Section 3.<br />
Section 4 summarizes the field and laboratory investigations performed for the present study.<br />
The geological setting <strong>of</strong> the dam is discussed in Section 5, followed by a discussion <strong>of</strong> sitespecific<br />
earthquake ground motions in Section 6. Characterizations <strong>of</strong> the embankment and<br />
foundation conditions are presented in Section 7. Section 8 discusses the general analysis<br />
approach. The details <strong>of</strong> the limit-equilibrium stability analyses, dynamic response analyses,<br />
seismic stability analyses, and non-linear analyses are presented in Sections 9 through 12.<br />
Section 13 summarizes the expected seismic performance <strong>of</strong> the dam whereas Section 14<br />
summarizes the main conclusions and recommendations from the study. The references cited in<br />
the report are listed in Section 15. Appendices A through I present supporting documentation<br />
including field and laboratory data as well as geologic and seismologic reports produced for the<br />
study.<br />
2 Unless otherwise noted, all elevations in this report are given in feet and refer to USGS datum.<br />
X:\X_GEO\CHABOT DAM\TASK G -- ENGINEERING REPORT\DRAFT FINAL\DYNAMIC STABILITY ANALYSIS_R4.DOC\30-AUG-05\\OAK 1-2
Vallejo<br />
San Pablo<br />
<strong>Bay</strong><br />
San Rafael<br />
Concord<br />
Contra Costa County<br />
Oakland<br />
San Francisco<br />
<strong>Chabot</strong> <strong>Dam</strong><br />
PACIFIC<br />
OCEAN<br />
San<br />
Francisco<br />
County<br />
San Mateo<br />
County<br />
San Mateo<br />
San Francisco<br />
<strong>Bay</strong><br />
10 5 0 10 20<br />
San Leandro<br />
Kilometers<br />
10 5<br />
0 10<br />
Miles<br />
Castro<br />
Valley<br />
Fremont<br />
Dublin<br />
Alameda County<br />
L:\Projects\<strong>Chabot</strong>_<strong>Dam</strong>_26814536\MXD\Current Working Documents\Fig 1-1 Site Location Map.mxd<br />
<strong>Chabot</strong> <strong>Dam</strong><br />
Seismic <strong>Stability</strong><br />
26814536<br />
Site Location Map<br />
Figure<br />
1-1
SECTIONTWO<br />
Scope <strong>of</strong> Work<br />
2. Section 2 TWO Scope <strong>of</strong> Work<br />
This study was performed in accordance with the Agreement between URS and EBMUD dated<br />
January 13, 2004. The main technical tasks <strong>of</strong> the scope <strong>of</strong> work are summarized below.<br />
Data Review<br />
This task consisted <strong>of</strong> reviewing existing information on the reservoir site geology and on the<br />
design, construction, and instrumentation monitoring <strong>of</strong> the dam.<br />
Geologic Mapping<br />
This task included developing an understanding <strong>of</strong> the site geology and the stratigraphy <strong>of</strong> the<br />
dam foundation. The existing boring data was incorporated into a geographic information<br />
system (GIS) database to help assess the distribution <strong>of</strong> soils and their characteristics within the<br />
embankment and the foundation.<br />
Field Exploration and Laboratory Testing<br />
This task included drilling rotary-wash borings through the embankment and foundation soils<br />
and into bedrock. Samples were retrieved with a Standard Penetration Test (SPT) sampler and<br />
other types <strong>of</strong> samplers for laboratory testing. Geophysical surveys were performed in selected<br />
borings to measure the shear wave velocity <strong>of</strong> the embankment and foundation materials.<br />
Becker Penetration Test (BPT) soundings were performed at locations adjacent to the toe<br />
borings. The hammer energy efficiencies were measured and calibrated during the SPT and BPT<br />
sampling. Laboratory tests were performed to characterize and evaluate the geotechnical<br />
properties <strong>of</strong> the materials for use in dynamic stability analyses.<br />
Develop Site-Specific Earthquake Ground Motions<br />
This task included reviewing recent information on the regional seismic environment and the<br />
characteristics <strong>of</strong> faults that could affect the dam to determine the maximum credible earthquake<br />
(MCE) on the controlling faults. Site-specific acceleration response spectra were developed<br />
using well-established attenuation relationships and up-to-date procedures that account for nearfield<br />
and directivity effects. Acceleration time histories were developed for use in analysis <strong>of</strong> the<br />
dam.<br />
<strong>Analysis</strong> <strong>of</strong> <strong>Dam</strong> <strong>Stability</strong> and Deformations<br />
This task included developing representative cross-sections and material properties for analysis<br />
<strong>of</strong> dam stability. The potential for liquefaction <strong>of</strong> cohesionless soils and <strong>of</strong> strength degradation<br />
<strong>of</strong> cohesive soils were evaluated using state-<strong>of</strong>-the-practice procedures. The critical section <strong>of</strong><br />
the dam was established using limit-equilibrium slope stability analyses. The seismic stability<br />
and deformations <strong>of</strong> the dam were evaluated using up-to-date two-dimensional finite element<br />
analysis and Newmark-type deformation analysis procedures. In addition, non-linear analyses<br />
were performed with the two-dimensional finite difference computer code FLAC. The overall<br />
performance and seismic stability <strong>of</strong> the dam were evaluated and assessed based on the results <strong>of</strong><br />
the analyses.<br />
X:\X_GEO\CHABOT DAM\TASK G -- ENGINEERING REPORT\DRAFT FINAL\DYNAMIC STABILITY ANALYSIS_R4.DOC\30-AUG-05\\OAK 2-1
3. Section 3 THREE Project Description<br />
SECTIONTHREE<br />
Project Description<br />
3.1 SITE SETTING<br />
The dam and reservoir are situated on San Leandro Creek in a narrow canyon in the <strong>East</strong> <strong>Bay</strong><br />
hills, approximately nine miles southeast <strong>of</strong> Oakland and about two miles northeast <strong>of</strong> San<br />
Leandro. The site location is shown on Figure 3-1.<br />
3.2 DESCRIPTION OF DAM<br />
The dam is approximately 135 feet high and 500 feet long and has a 30-foot-wide crest. The<br />
dam crest elevation is 250 and the spillway crest elevation is 227.25 (per EBMUD as-built<br />
drawings). The current downstream slope is 3:1 (H:V) with a 15-foot-wide bench at elevation<br />
210. The upstream slope is approximately 2:1 and is protected by a layer <strong>of</strong> riprap. The main<br />
body <strong>of</strong> the dam is composed <strong>of</strong> so-called “wagon fill,” which is a clayey sandy material placed<br />
and compacted by teams <strong>of</strong> horses and wagons. On the crest and downstream slope, the wagon<br />
fill is overlain by engineered fill. The downstream toe <strong>of</strong> the embankment is composed <strong>of</strong><br />
sluiced fill and random fill zones. The dam layout is shown in Figure 3-2.<br />
3.3 APPURTENANT FACILITIES<br />
The project appurtenant facilities include three outlet tunnels and a spillway. The locations <strong>of</strong><br />
the spillway and <strong>of</strong> outlet tunnels Nos. 1 and 2 are shown in Figure 3-2. The location <strong>of</strong> tunnel<br />
No. 3 is shown in Figure 3-1. The intake tower for tunnel No. 2 is located on the west shore <strong>of</strong><br />
the lake near the spillway. The tower consists <strong>of</strong> a brick and stone masonry structure with a onestory<br />
reinforced concrete pavilion on top. Tunnel No. 2 is a masonry-lined conduit in rock<br />
through the west abutment, and is connected to a 36-inch raw water line, which in turn connects<br />
to a 30-inch blow-<strong>of</strong>f pipe and an outlet structure. Tunnel No. 3, about 1,500 feet in length, is<br />
located at the northwest end <strong>of</strong> the lake and connects to San Leandro Creek, as shown in<br />
Figure 3-1. Tunnel No. 1 is to the west <strong>of</strong> tunnel No. 2 and is no longer in service. The spillway<br />
is an uncontrolled chute type, founded on rock on the west abutment. It consists <strong>of</strong> a concrete<br />
approach, weir, chute, and stilling basin. The spillway crest and approach are about 70 feet<br />
wide. The stilling basin is about 100 feet long.<br />
3.4 CONSTRUCTION HISTORY<br />
Construction <strong>of</strong> the dam started in early 1874. The dam footprint area was reportedly stripped to<br />
a depth <strong>of</strong> up to 3 feet to remove vegetation, roots, and loose topsoil. A core trench 10 to 30 feet<br />
deep and 40 to 90 feet wide was excavated to bedrock along the dam axis. Wagon fill was<br />
placed during 1874 and 1875 to elevation 233 to form the main body <strong>of</strong> the dam. The materials<br />
were selected from nearby sources so as to have sufficient clay to “bind and pack”. The fill was<br />
placed in one-foot layers, sprinkled with water, and compacted by horses and wagons.<br />
Reportedly, the materials were placed selectively to form a clay core. Between 1875 and 1888,<br />
the downstream slope was flattened by the addition <strong>of</strong> a sluiced (i.e. hydraulically-placed) fill<br />
buttress up to elevation 185. The wagon fill was raised to a crest elevation <strong>of</strong> 243 between 1891<br />
and 1892. Around that same time, a berm was placed on the upstream face where a slide had<br />
apparently occurred during construction.<br />
X:\X_GEO\CHABOT DAM\TASK G -- ENGINEERING REPORT\DRAFT FINAL\DYNAMIC STABILITY ANALYSIS_R4.DOC\30-AUG-05\\OAK 3-1
SECTIONTHREE<br />
Project Description<br />
A fillet fill was placed on the downstream slope against the right abutment following<br />
recommendations <strong>of</strong> the 1965 stability evaluation by Shannon and Wilson. A substantial<br />
program <strong>of</strong> dam modifications was undertaken in 1980, after the 1977 stability evaluation by<br />
Woodward-Clyde Consultants. Engineered fill (referred to as “modern fill”) was placed along<br />
the downstream slope to raise the crest to the current elevation 250. A new spillway was also<br />
constructed during the dam modifications. Unsorted material from required excavations and<br />
construction demolition (referred to as “random fill”) was placed near the downstream toe and<br />
covered with topsoil.<br />
3.5 PERFORMANCE AND MONITORING<br />
The performance <strong>of</strong> <strong>Chabot</strong> <strong>Dam</strong> is monitored with piezometers, seepage measurement points,<br />
and survey monuments. The instruments are maintained and periodically read by EBMUD<br />
personnel. The piezometers are listed in Table 3-1. Some installations include two or three<br />
piezometers in a single boring. Seepage through the embankment is monitored at two locations.<br />
The spillway drain reading is typically between 0 and 2 gallons per minute (gpm). The toe drain<br />
readings are typically between 2 to 4 gpm. Nine survey monuments have been installed on the<br />
embankment: five on the crest, three on the downstream bench, and one at the downstream toe.<br />
The locations <strong>of</strong> the piezometers and survey monuments are shown in Figure 3-3.<br />
Overall, the dam has performed very well since its construction. No evidence <strong>of</strong> instability or<br />
apparent damage was reported after the great 1906 San Francisco earthquake. Monitoring data<br />
before and after the 1989 Loma Prieta earthquake showed no signs <strong>of</strong> excessive seepage,<br />
phreatic level changes within the dam, or permanent displacement <strong>of</strong> the embankment. The dam<br />
has also performed satisfactorily during several instances <strong>of</strong> complete drawdown <strong>of</strong> the reservoir.<br />
There is some indication that upstream slope instability may have occurred during construction<br />
in the 1890s, but it appears that the slope was reinforced and/or flattened afterwards and no<br />
subsequent instability has been reported.<br />
X:\X_GEO\CHABOT DAM\TASK G -- ENGINEERING REPORT\DRAFT FINAL\DYNAMIC STABILITY ANALYSIS_R4.DOC\30-AUG-05\\OAK 3-2
SECTIONTHREE<br />
Project Description<br />
Table 3-1<br />
Existing Piezometers at <strong>Chabot</strong> <strong>Dam</strong><br />
Boring No.<br />
Ground Surface<br />
Elevation, ft<br />
Piezometer A<br />
Tip Elevation, ft<br />
Piezometer B<br />
Tip Elevation, ft<br />
Piezometer C<br />
Tip Elevation, ft<br />
WI-15 181.9 128.9 - -<br />
WI-18 188.8 165.8 - -<br />
WI-25 250.0 201.2 166.3 146.0<br />
WI-28 250.5 186.9 129.2 101.2<br />
WI-51 250.4 235.0 - -<br />
WI-52 250.4 137.0 122.0 -<br />
WI-53 212.0 192.0 - -<br />
WI-54 211.5 186.5 169.5 -<br />
WI-55 210.1 129.0 104.0 -<br />
WI-56 210.7 113.7 97.7 -<br />
WI-57 169.7 125.7 102.7 -<br />
WI-58 162.1 106.8 80.3 -<br />
Note:<br />
All piezometers are manually read open standpipes.<br />
X:\X_GEO\CHABOT DAM\TASK G -- ENGINEERING REPORT\DRAFT FINAL\DYNAMIC STABILITY ANALYSIS_R4.DOC\30-AUG-05\\OAK 3-3
Tunnel #3<br />
Tunnels #1 and #2<br />
<strong>Chabot</strong> <strong>Dam</strong><br />
227.25<br />
Highway I-580<br />
Source: Terrain Navigator, Maptech Inc., 2001<br />
0 200 400 600<br />
Meters<br />
Project No.<br />
26814536<br />
<strong>Chabot</strong> <strong>Dam</strong><br />
Seismic <strong>Stability</strong><br />
Location <strong>of</strong> <strong>Chabot</strong> <strong>Dam</strong><br />
Figure<br />
3-1<br />
X:\x_geo\<strong>Chabot</strong> <strong>Dam</strong>\Task G - Engineering Report\Figures\Figure 3-1.grf
Tunnel No. 1<br />
Tunnel No. 2<br />
Source:<br />
EBMUD Drawing No. 6948-G-1.03, <strong>Chabot</strong> <strong>Dam</strong> & Spillway Modifications General Plan,<br />
dated May 14, 1979, last reivsed on December 7, 1982<br />
Project No.<br />
26814536<br />
<strong>Chabot</strong> <strong>Dam</strong><br />
Seismic <strong>Stability</strong><br />
Site Plan<br />
FIGURE<br />
3-2<br />
x:\x_geo\<strong>Chabot</strong> <strong>Dam</strong>\Task G - Engineering Report\Figures\Figure 3-2.grf
Legend<br />
Survey Monument<br />
Type I Piezometer<br />
Source:<br />
EBMUD Drawing No. 6948-G-4.01, <strong>Chabot</strong> <strong>Dam</strong> & Spillway Modifications Paving, Drainage & Instrumentation Plan,<br />
dated May 14, 1979, last revised on September 10, 1999<br />
Project No.<br />
26814536<br />
<strong>Chabot</strong> <strong>Dam</strong><br />
Seismic <strong>Stability</strong><br />
Instrument Locations<br />
FIGURE<br />
3-3<br />
x:\x_geo\<strong>Chabot</strong> <strong>Dam</strong>\Task G - Engineering Report\Figures\Figure 3-3.grf
SECTIONFOUR<br />
Field and Laboratory Investigations<br />
4. Section 4 FOUR Field and Laboratory Investigations<br />
The objective <strong>of</strong> the field and laboratory investigations was to supplement the available<br />
geotechnical data, to support the seismic stability re-evaluation <strong>of</strong> the dam. Previous studies <strong>of</strong><br />
the dam’s stability have also included field and laboratory investigations. The locations <strong>of</strong> the<br />
borings from previous studies are shown in Figure 4-1. Whereas a relatively extensive body <strong>of</strong><br />
data is available from the previous investigations, it was concluded that a reliable and robust<br />
dynamic stability study required additional high quality data and use <strong>of</strong> improved testing<br />
techniques to better characterize the materials in the dam. The investigation program that was<br />
carried out for this purpose is described below.<br />
4.1 FIELD INVESTIGATIONS<br />
The field investigation program included exploratory borings, Becker penetration testing,<br />
hammer energy measurements, and downhole geophysical surveys. The details <strong>of</strong> these<br />
elements <strong>of</strong> work are described in the following sections. The boring logs and data reports are<br />
presented in Appendices A through E. The boring depths and materials encountered are<br />
summarized in Table 4-1. The locations <strong>of</strong> the borings drilled for this study are shown in<br />
Figure 4-2, along with the locations <strong>of</strong> previous borings.<br />
The field investigations were carried out between May 3 and June 8, 2004. The drilling program<br />
included 9 rotary wash borings and 3 Becker hammer penetration test soundings. The rotary<br />
wash borings were drilled by Taber Consultants <strong>of</strong> Sacramento, California. The Becker hammer<br />
soundings were performed by Great West Drilling <strong>of</strong> Fontana, California. Downhole<br />
geophysical measurements were obtained by GEOVision Geophysical Services <strong>of</strong> Corona,<br />
California. Energy transfer measurements <strong>of</strong> hammer efficiency during SPT and BPT testing<br />
were obtained by Abe Engineering, Inc. <strong>of</strong> Walnut Creek, California. Robert Y. Chew<br />
Geotechnical supervised the drilling and logged the borings, under the direction <strong>of</strong> URS. URS<br />
reviewed the samples, conducted the laboratory testing, and prepared the final boring logs with<br />
assistance from Dot Dat, Inc.<br />
4.1.1 Rotary Wash Drilling<br />
Nine rotary-wash borings were drilled at selected locations between May 3 and May 29, 2004.<br />
These borings (designated WI-59 through 67) were numbered in the order drilled, using<br />
nomenclature consistent with borings previously drilled by the District at the site. Borings WI-<br />
61 and WI-64 were drilled from the crest <strong>of</strong> the dam. Borings WI-59 and WI-62 were drilled<br />
from the downstream bench and sloping access road. Borings WI-60, WI-63, and WI-65 were<br />
drilled in the downstream toe area. Borings WI-66 and WI-67 were drilled in the reservoir near<br />
the upstream toe <strong>of</strong> the dam. The land borings were drilled with a truck-mounted Diedrich D-<br />
128 drill rig and the reservoir borings were drilled with a CME-45 drill rig mounted on a barge.<br />
Both rigs used the same SPT hammer.<br />
The borings were initially located in the field by URS from available reference points. After<br />
drilling, a hand-held Trimble GPS receiver with built-in differential correction capability was<br />
used to record coordinates for each boring location. Comparison measurements taken at known<br />
reference points indicate a horizontal accuracy range for the GPS coordinates <strong>of</strong> about 5 feet.<br />
For the reservoir borings drilled from the barge, the GPS unit was first used to navigate the barge<br />
to within a few feet <strong>of</strong> the target boring locations. The boring coordinates were then recorded<br />
once the barge anchors and borehole casing were set in place.<br />
X:\X_GEO\CHABOT DAM\TASK G -- ENGINEERING REPORT\DRAFT FINAL\DYNAMIC STABILITY ANALYSIS_R4.DOC\30-AUG-05\\OAK 4-1
SECTIONFOUR<br />
Field and Laboratory Investigations<br />
The boring logs are presented in Appendix A. SPT blow counts were obtained using a Diedrich<br />
automatic hammer. Energy measurements were performed to calibrate the efficiency <strong>of</strong> the<br />
hammer.<br />
4.1.2 Becker Penetration Testing<br />
Based on the results <strong>of</strong> the drilling program, the potential effects <strong>of</strong> gravel on the measured SPT<br />
blow counts were determined to be significant. It was determined that such effects could<br />
introduce significant uncertainty in the evaluation <strong>of</strong> residual strength <strong>of</strong> the sluiced fill.<br />
Therefore, three BPT soundings (BPT-1 through 3) were performed in the downstream toe area,<br />
in close proximity to the SPT borings. The BPT soundings were advanced through the random<br />
fill and sluiced fill until they reached refusal.<br />
The soundings were performed on June 7 and 8, 2004 using the procedures recommended by<br />
Harder and Seed (1986). The Becker hammer drill is essentially a steel pipe casing driven by a<br />
diesel hammer. A truck-mounted AP-1000 drill rig and a 6.5-inch-OD closed crowd-out bit were<br />
used. The hammer was an ICE model 180 double acting hammer. Blow counts and bounce<br />
chamber pressures were recorded for every foot <strong>of</strong> penetration. Re-drive tests were performed at<br />
about 20 foot intervals to monitor casing friction during the tests. Logs <strong>of</strong> the BPT soundings are<br />
presented in Appendix B. Energy measurements were performed to calibrate the efficiency <strong>of</strong><br />
the Becker hammer during drilling.<br />
4.1.3 Hammer Energy Measurements<br />
The energy transferred from the hammer to the SPT sampler is an important factor in evaluating<br />
the liquefaction resistance <strong>of</strong> soils. The efficiency <strong>of</strong> energy transfer is measured by the energy<br />
ratio (ER), which is defined as the ratio <strong>of</strong> energy transferred to the drill rod to the theoretical<br />
“free fall” energy. Using the energy correction factor (C E = ER/60), the field SPT blow counts<br />
(N) are adjusted to standardized blow counts (N 60 ) corresponding to an average energy ratio <strong>of</strong><br />
60 percent.<br />
The SPT hammer energy measurements were obtained during sampling in boring WI-59 on May<br />
3, 2004. The measurements were obtained with a Pile Driving Analyzer. The measured average<br />
ER was 84%. The complete results <strong>of</strong> the SPT hammer energy measurements are presented in<br />
Appendix C.<br />
The BPT hammer energy measurements were obtained in all three BPT soundings. The energy<br />
measurements were digitally recorded for each foot <strong>of</strong> penetration. The measured average ER<br />
values were between 37 and 43%. The complete results <strong>of</strong> the BPT hammer energy<br />
measurements are presented in Appendix D.<br />
4.1.4 Downhole Geophysical Surveys<br />
Downhole seismic wave velocity measurements were made in borings WI-59 through 62<br />
immediately after drilling each boring. An OYO Model 170 suspension logging recorder and<br />
suspension logging probe were used to measure shear and compression wave (S- and P-wave)<br />
velocities at 0.5-meter (m) intervals (1.64 feet). The main purpose <strong>of</strong> the surveys was to obtain<br />
shear wave velocity data for the embankment and foundation materials for use in dynamic<br />
X:\X_GEO\CHABOT DAM\TASK G -- ENGINEERING REPORT\DRAFT FINAL\DYNAMIC STABILITY ANALYSIS_R4.DOC\30-AUG-05\\OAK 4-2
SECTIONFOUR<br />
Field and Laboratory Investigations<br />
analysis <strong>of</strong> the dam. A more detailed description <strong>of</strong> the geophysical survey program and results is<br />
presented in Appendix E.<br />
4.2 LABORATORY TESTING<br />
The laboratory test program was conducted at the URS Pleasant Hill laboratory. Prior to<br />
finalizing the test program, the soil and rock samples were carefully inspected in the laboratory<br />
by the URS team and representatives <strong>of</strong> the DSOD. Appropriate tests were selected to assist in<br />
subsequent evaluation <strong>of</strong> material properties for use in the dam dynamic stability analyses. The<br />
types <strong>of</strong> tests performed are listed below, along with their ASTM designations.<br />
• In-situ moisture-density (ASTM D2216, D2937)<br />
• Sieve analysis (ASTM D422)<br />
• Hydrometer analysis (ASTM D422)<br />
• Atterberg Limits (ASTM D4318)<br />
• Isotropically consolidated undrained (ICU) triaxial compression tests with pore pressure<br />
measurements (ASTM D4267).<br />
• Unconfined compression strength tests (ASTM D2166)<br />
The laboratory tests were conducted in general accordance with the noted ASTM standards.<br />
Consolidation pressures for the ICU tests were selected based on the estimated overburden<br />
pressure at each sample depth. The test results are tabulated in Appendix F. Summary plots <strong>of</strong><br />
the test results are also presented in Appendix F along with the laboratory reports for each test.<br />
Abbreviated test results for each sample are also included in the boring logs at the appropriate<br />
depths.<br />
X:\X_GEO\CHABOT DAM\TASK G -- ENGINEERING REPORT\DRAFT FINAL\DYNAMIC STABILITY ANALYSIS_R4.DOC\30-AUG-05\\OAK 4-3
SECTIONFOUR<br />
Field and Laboratory Investigations<br />
Boring<br />
No.<br />
Boring<br />
Type<br />
Location<br />
Table 4-1<br />
Summary <strong>of</strong> Borings<br />
Surface<br />
Elev.<br />
(feet)<br />
Depth<br />
(feet)<br />
WI-59 Rotary Wash Mid-bench, downstream face 210 99<br />
Materials Encountered<br />
(Approximate Depths/Remarks)<br />
90 feet (ft) embankment fill; rhyolite and serpentinite bedrock.<br />
(Geophysical survey).<br />
WI-60 “ Downstream toe 179 105<br />
55 ft embankment fill; 17 ft native soil; serpentinite, shale, and gabbro<br />
bedrock. (Geophysical survey).<br />
WI-61 “ Crest 250 166 140 ft embankment fill; rhyolite bedrock. (Geophysical survey).<br />
WI-62 “<br />
Downstream mid-slope<br />
access road<br />
224 140<br />
92 ft embankment fill; 20 ft native soil; basalt, rhyolite, and serpentinite<br />
bedrock. (Geophysical survey).<br />
WI-63 “ Downstream toe 172 68 50 ft embankment fill; serpentinite and gabbro bedrock.<br />
WI-64 “ Crest 250 140 128 ft embankment fill; rhyolite bedrock.<br />
WI-65 “ Downstream toe 168 65 54 ft embankment fill; 8 ft native soil; gabbro bedrock.<br />
WI-66 “ Upstream toe (barge) 179 66<br />
37 ft reservoir sediment and embankment fill; 19ft native soil; shale<br />
bedrock.<br />
WI-67 “ Upstream toe (barge) 174 67<br />
58 ft reservoir sediment and embankment fill; 2 ft native soil;<br />
shale/claystone/siltstone bedrock.<br />
BPT-1 Becker Hammer Downstream toe, near WI-60 179 80 No samples retrieved<br />
BPT-2 “ Downstream toe, near WI-63 172 65 No samples retrieved<br />
BPT-3 “ Downstream toe, near WI-65 170 63 No samples retrieved<br />
X:\X_GEO\CHABOT DAM\TASK G -- ENGINEERING REPORT\DRAFT FINAL\DYNAMIC STABILITY ANALYSIS_R4.DOC\30-AUG-05\\OAK 4-4
WI-41<br />
WI-29<br />
WI-50<br />
WI-42<br />
WI-23<br />
WI-51<br />
WI-48<br />
WI-47<br />
WI-22<br />
WI-2<br />
WI-32<br />
WI-30<br />
WI-46<br />
WI-45<br />
WI-43<br />
WI-49<br />
WI-44<br />
WI-44A<br />
WI-53<br />
WI-54<br />
WI-13<br />
WI-9<br />
WI-19<br />
Well #3<br />
WI-3<br />
WI-33<br />
WI-21<br />
WI-52<br />
WelI #1<br />
WI-45*<br />
WI-5<br />
WI-44*<br />
WI-10 WI-34 WI-41* WI-26<br />
WI-46*<br />
WI-42*<br />
WI-43* WI-35<br />
WI-11<br />
WI-56<br />
WI-55<br />
WI-20<br />
WI-4<br />
WI-27<br />
WI-28<br />
WelI #5<br />
WI-36<br />
WI-12<br />
WI-40<br />
WI-6<br />
WI-25<br />
WI-31<br />
WI-24<br />
WI-7<br />
WI-16<br />
WI-58<br />
WI-17<br />
WI-57<br />
WI-39<br />
WI-14<br />
WI-38<br />
Well #4<br />
WI-15<br />
WI-37<br />
WI-18<br />
0 80<br />
Approximate scale in feet<br />
1" ≅ 80'<br />
Boring Log Reliability*<br />
High<br />
Moderate<br />
Notes:<br />
1. Base topo map from EBMUD drawing "As Built Topography", No. 6948-G-1.03.1, dated December 1982<br />
2. Boring locations from :<br />
Shannon & Wilson Report "Review <strong>of</strong> <strong>Stability</strong>, <strong>Chabot</strong> <strong>Dam</strong>", Figure 2, dated September 1965<br />
WCC Report "Evaluation <strong>of</strong> Seismic <strong>Stability</strong> <strong>of</strong> <strong>Chabot</strong> <strong>Dam</strong> Modification", Figure 4-5, dated August 1977<br />
EBMUD Drawing "Existing Topography & Location <strong>of</strong> Borings", No. 6948-G-1.05, dated December 1982<br />
EBMUD Drawing "Paving, Drainage & Instrumentation Plan", No. 6948-G-4.01, dated September 1999<br />
Project No.<br />
26814536<br />
<strong>Chabot</strong> <strong>Dam</strong><br />
Seismic <strong>Stability</strong><br />
Low<br />
* For purposes <strong>of</strong> this study<br />
Location <strong>of</strong> Borings<br />
From Previous Studies<br />
FIGURE<br />
4-1<br />
x:\x_geo\<strong>Chabot</strong> <strong>Dam</strong>\Task G - Engieering Report\Figures\Figure 4-1.grf
1 inch equals 100 feet<br />
Feet<br />
0 50 100 200<br />
Boring_id Y x<br />
WI-59 37.729198 -122.122340<br />
WI-60 37.728865 -122.122282<br />
WI-63 37.728677 -122.122471<br />
WI-62 37.729285 -122.122020<br />
WI-61 37.729580 -122.122206<br />
WI-64 37.729501 -122.121813<br />
WI-65 37.728811 -122.122707<br />
WI-66 37.730143 -122.121654<br />
WI-67 37.730231 -122.122037<br />
BPT-1 37.728871 -122.122254<br />
BPT-2 37.728664 -122.122451<br />
BPT-3 37.728817 -122.122732<br />
Degrees, NAD83<br />
WI-46<br />
WI-45<br />
WI-43<br />
WI-49<br />
Stream Channel<br />
WI-50<br />
WI-44A<br />
130<br />
WI-41<br />
140<br />
WI-42<br />
WI-16<br />
WI-58<br />
WI-53<br />
WI-17<br />
150<br />
205<br />
195<br />
185<br />
175<br />
165<br />
155<br />
145<br />
235<br />
225<br />
215<br />
WI-13<br />
WI-57<br />
WI-48<br />
WI-23<br />
WI-47<br />
WI-51<br />
WI-22<br />
WI-54<br />
WI-19<br />
BPT-3<br />
WI-9<br />
WI-65<br />
WI-39<br />
WI-33<br />
WI-14<br />
WI-55<br />
160<br />
135<br />
WI-38<br />
125<br />
WI-21<br />
WI-10<br />
WELL#3<br />
WI-63<br />
WI-2<br />
WI-3<br />
WI-52<br />
WI-20<br />
WI-60<br />
BPT-2<br />
170<br />
115<br />
WI-32<br />
WELL#1<br />
WI-61<br />
WI-45*<br />
WI-15<br />
WI-37<br />
WI-29<br />
180<br />
190<br />
115<br />
WI-4<br />
WI-27<br />
WI-5<br />
WI-28<br />
125<br />
WI-40<br />
135<br />
WI-44*<br />
WI-26<br />
WI-34<br />
WI-42*<br />
WI-62<br />
WI-41*<br />
WI-46*<br />
WI-43*<br />
WI-35<br />
WI-59<br />
WI-11<br />
WI-36<br />
WI-56<br />
WI-12<br />
BPT-1<br />
WELL#4<br />
WI-18<br />
WI-67<br />
WI-64<br />
WELL#5<br />
200<br />
WI-66<br />
WI-31<br />
WI-30<br />
WI-6<br />
WI-24<br />
WI-7<br />
WI-25<br />
210<br />
220<br />
250<br />
175<br />
185<br />
240<br />
Legend<br />
<strong>Chabot</strong> <strong>Dam</strong><br />
<strong>Dynamic</strong> <strong>Stability</strong><br />
26814536<br />
145<br />
195<br />
155<br />
165<br />
215<br />
225<br />
230<br />
235<br />
245<br />
205<br />
255<br />
220<br />
175<br />
180<br />
215<br />
230<br />
240<br />
190<br />
200<br />
250<br />
210<br />
Borings for this study<br />
BPT soundings for this study<br />
Previous Borings<br />
Current ground surface contours (ft)<br />
Pre-dam ground surface contours (ft)<br />
Boring Locations<br />
Figure<br />
4-2<br />
URS Corporation L:\Projects\<strong>Chabot</strong>_<strong>Dam</strong>_26814536\MXD\Current Working Documents\Fig 1 Boring Locations for <strong>Dynamic</strong> <strong>Stability</strong>.mxd Date: 8/11/2004 10:53:40 AM Name: dhwrigh0
SECTIONFIVE<br />
Geological Setting<br />
5. Section 5 FIVE Geological Setting<br />
This study included a review <strong>of</strong> geologic mapping from previous studies, additional<br />
reconnaissance-level geologic mapping in the vicinity <strong>of</strong> the dam site, review <strong>of</strong> the<br />
seismotectonic environment <strong>of</strong> the <strong>East</strong> <strong>Bay</strong> hills, and updated characterization <strong>of</strong> the seismic<br />
sources that could affect the dam. This work was conducted by Dr. John Wakabayashi and<br />
William Lettis & Associates under subcontract to URS. Their reports are included in<br />
Appendices G and H and are summarized below and in Section 6.<br />
5.1 REGIONAL GEOLOGY<br />
<strong>Chabot</strong> <strong>Dam</strong> is located within the seismically active region between the Pacific plate on the west<br />
and the Sierra Nevada-Central Valley (“Sierran”) microplate on the east. Geodetic data<br />
demonstrate that net motion between the two plates is obliquely convergent. The oblique motion<br />
<strong>of</strong> the Sierran microplate relative to the strike <strong>of</strong> the San Andreas and Hayward faults results in a<br />
small component <strong>of</strong> net convergence normal to these structures, which is accommodated by both<br />
strike-slip and thrust faulting in the eastern San Francisco <strong>Bay</strong> area.<br />
The dam and reservoir are situated in a narrow canyon near the western edge <strong>of</strong> the <strong>East</strong> <strong>Bay</strong><br />
hills, which limit San Francisco <strong>Bay</strong> on the east. The <strong>East</strong> <strong>Bay</strong> hills region is within the central<br />
Coast Range geomorphic province <strong>of</strong> California and is bounded by the Hayward fault on the<br />
west and the Northern Calaveras fault on the east.<br />
5.2 SITE GEOLOGY<br />
The site geology in the vicinity <strong>of</strong> the dam is illustrated in Figure 5-1. In approximate upstream<br />
to downstream order, the bedrock at the dam site consists <strong>of</strong> the following units:<br />
• Upper Jurassic Knoxville Formation shale and sandstone north and east <strong>of</strong> the dam,<br />
• Jurassic Leona Rhyolite on both abutments, beneath the axis <strong>of</strong> the dam, and south and east<br />
<strong>of</strong> the canyon downstream <strong>of</strong> the dam, and<br />
• Jurassic basalt and gabbro west (downstream) <strong>of</strong> the dam, along with volcanic and intrusive<br />
rocks <strong>of</strong> the middle-to-upper Jurassic Coast Range ophiolite.<br />
Quaternary units present in the site area include alluvium and colluvium. Colluvium mantles<br />
most <strong>of</strong> the slopes in the area where bedrock outcrops are not seen, but its depth is difficult to<br />
assess, so colluvial deposits are not shown on Figure 5-1. Alluvium is present in the stream<br />
bottom downstream <strong>of</strong> the dam. No bedrock exposures were seen in the streambed, so the<br />
streambed probably consists <strong>of</strong> alluvium and colluvium. Beneath the dam embankment, several<br />
borings encountered alluvium or colluvium, which ranges in composition from gravelly sandy<br />
clay to gravelly sand and clayey gravel.<br />
The mapped bedrock contacts in the site area appear to include both depositional and tectonic<br />
features. However, faulted Quaternary deposits have not been identified along any <strong>of</strong> the<br />
contacts at the site. In approximate upstream to downstream order, the mapped geologic contacts<br />
are as follows:<br />
1) The contact between the northern exposure <strong>of</strong> Leona Rhyolite and the Knoxville Formation<br />
to the north. This contact may pass beneath the upstream toe <strong>of</strong> the dam and it is not clear<br />
whether it is tectonic or depositional. However, since the contact is folded, it is unlikely to<br />
X:\X_GEO\CHABOT DAM\TASK G -- ENGINEERING REPORT\DRAFT FINAL\DYNAMIC STABILITY ANALYSIS_R4.DOC\30-AUG-05\\OAK 5-1
SECTIONFIVE<br />
Geological Setting<br />
have been active in the late Quaternary time, if it is a fault. No geomorphic features<br />
suggestive <strong>of</strong> late Quaternary activity <strong>of</strong> this contact were observed.<br />
2) The serpentinite shear zone that is exposed in the spillway cut passes beneath the<br />
downstream toe <strong>of</strong> the dam. This zone is folded, so it is unlikely to have been active during<br />
the late Quaternary. Also, no geomorphic features suggestive <strong>of</strong> late Quaternary activity<br />
along this contact were noted in airphotos or during the field reconnaissance.<br />
3) The fault that locally follows the stream valley axis downstream <strong>of</strong> the dam separates gabbro<br />
from Leona Rhyolite. This feature may pass beneath the downstream toe <strong>of</strong> the dam. It is<br />
difficult to determine whether the serpentinite shear zone truncates this fault or whether this<br />
fault truncates and <strong>of</strong>fsets the serpentinite shear zone. In any case, the fault appears to have<br />
been inactive during the late Quaternary. Part <strong>of</strong> the stream valley segment occupied by this<br />
fault is fairly linear, but no geomorphic features consistent with late Quaternary fault<br />
movement were observed in airphotos or during field reconnaissance along the hypothetical<br />
projection <strong>of</strong> this feature southeast and east <strong>of</strong> the dam.<br />
4) Lienkaemper’s (1992) map <strong>of</strong> recently active traces <strong>of</strong> the Hayward fault shows an eastern<br />
splay <strong>of</strong> the Hayward fault zone passing through the western wall <strong>of</strong> a now-inactive quarry<br />
south <strong>of</strong> Lake <strong>Chabot</strong> dam. The extension <strong>of</strong> that splay projects northwestward to cross San<br />
Leandro Creek about 350 m downstream (west) <strong>of</strong> the dam (Figure 5-1). Detailed geologic<br />
review <strong>of</strong> previous investigations and review <strong>of</strong> airphotos confirms that this splay fault does<br />
not pass beneath Lake <strong>Chabot</strong> <strong>Dam</strong>.<br />
5.3 FAULT RUPTURE<br />
As noted above, no evidence <strong>of</strong> late Quaternary activity associated with any <strong>of</strong> the faults passing<br />
near the dam was found in this investigation. Bedrock structural relationships indicate that these<br />
faults are inactive. Accordingly, the likelihood for sympathetic movement on faults passing<br />
beneath the dam in response to a large earthquake on the Hayward fault is judged to be very low.<br />
Previous investigations have also addressed this question. Those studies concluded that if<br />
sympathetic movement were to occur on the faults at the dam site, such movement would be less<br />
than 1 foot (Marliave, 1978; WCC, 1978), and the dam would be able to safely withstand the<br />
effects <strong>of</strong> such movement (EBMUD, 1978). Those earlier conclusions are judged to be<br />
reasonable in view <strong>of</strong> the information obtained for the present investigation.<br />
X:\X_GEO\CHABOT DAM\TASK G -- ENGINEERING REPORT\DRAFT FINAL\DYNAMIC STABILITY ANALYSIS_R4.DOC\30-AUG-05\\OAK 5-2
Project No.<br />
<strong>Chabot</strong> <strong>Dam</strong><br />
26814536 Seismic <strong>Stability</strong><br />
Site Geological Map<br />
Figure<br />
5-1<br />
X:\x_geo\<strong>Chabot</strong> <strong>Dam</strong>\Task G - Engineering Report\Figures\Figure 5-1.grf
6. Section 6 SIX Site - Specific Earthquake Ground Motions<br />
SECTIONSIX<br />
Site - Specific Earthquake Ground Motions<br />
6.1 GENERAL APPROACH<br />
The approach used to develop the design acceleration response spectra for analysis <strong>of</strong> <strong>Chabot</strong><br />
<strong>Dam</strong> consisted <strong>of</strong> the following steps:<br />
• Identification <strong>of</strong> seismic sources that can generate significant earthquake ground motions at<br />
the dam site;<br />
• Estimation <strong>of</strong> the maximum earthquake magnitudes and the closest distances to the dam site<br />
for the identified seismic sources;<br />
• Identification <strong>of</strong> the controlling earthquake sources and the Maximum Credible Earthquake<br />
(MCE) on each source;<br />
• Assessment <strong>of</strong> site conditions for purpose <strong>of</strong> estimating earthquake ground motions;<br />
• Selection <strong>of</strong> appropriate attenuation relationships to estimate ground motions as a function <strong>of</strong><br />
earthquake magnitude, distance, faulting style, and site condition;<br />
• Development <strong>of</strong> design acceleration response spectra based on the results <strong>of</strong> the above steps;<br />
and<br />
• Adjustment <strong>of</strong> the design response spectra to include near-field effects.<br />
6.2 SEISMIC SOURCES<br />
The Hayward-Rodgers Creek fault is located about 0.5 kilometers (km) west <strong>of</strong> the dam site.<br />
This fault was the source <strong>of</strong> an estimated M6.8 earthquake on 21 October 1868. The Northern<br />
Calaveras fault, located about 13 km east <strong>of</strong> the dam, has a historical record <strong>of</strong> small<br />
earthquakes. However, paleoseismic trenching studies indicate that the fault has produced<br />
multiple surface ruptures during late Quaternary time. Other active faults within 50 km <strong>of</strong> the<br />
dam that are considered as potential sources <strong>of</strong> future large earthquakes include the San Andreas,<br />
San Gregorio-Seal Cove, Greenville, Mt. Diablo and Concord-Green Valley faults. The<br />
locations <strong>of</strong> potential seismic sources in the region are shown in Figure 6-1.<br />
Within the <strong>East</strong> <strong>Bay</strong> Hills region, potential seismic sources include the Moraga, Miller Creek and<br />
Palomares faults, the Contra Costa Shear Zone, which represents a complex system <strong>of</strong> strike-slip<br />
faults (Cull Canyon, Lafayette and Reliez Valley faults) and poorly integrated shear zones, and<br />
the Mt. Diablo Thrust fault, a 25-km long west-northwest trending fold north <strong>of</strong> Livermore<br />
Valley.<br />
The maximum magnitudes for each identified seismic source were estimated based on the<br />
potential rupture length and seismogenic depth, using an empirical relationship that relates<br />
earthquake magnitude and rupture area as proposed by Wells and Coppersmith (1994). Site-tosource<br />
distances were measured from the center <strong>of</strong> the dam to the main trace <strong>of</strong> each fault. The<br />
estimated maximum earthquake magnitudes and site-to-source distances for each fault are listed<br />
in Table 6-1. A more detailed description <strong>of</strong> the seismic sources is presented in Appendix H.<br />
Because <strong>of</strong> its magnitude and site-to-source distance, the Hayward-Rodgers Creek fault is likely<br />
to generate the strongest ground motions at the dam site. The estimated maximum magnitude for<br />
this fault is M w 7¼. The San Andreas fault, located about 30 km west <strong>of</strong> dam, is capable <strong>of</strong><br />
X:\X_GEO\CHABOT DAM\TASK G -- ENGINEERING REPORT\DRAFT FINAL\DYNAMIC STABILITY ANALYSIS_R4.DOC\30-AUG-05\\OAK 6-1
SECTIONSIX<br />
Site - Specific Earthquake Ground Motions<br />
generating long duration shaking due to its large maximum magnitude (M w 8.0). All other<br />
intermediate faults have estimated maximum magnitudes lower than the Hayward-Rodgers<br />
Creek fault. Therefore, the Hayward and San Andreas faults are considered as the controlling<br />
earthquake sources for analysis <strong>of</strong> the dam.<br />
6.3 DESIGN RESPONSE SPECTRA<br />
6.3.1 Site Conditions<br />
Because the dam is underlain predominantly by hard rhyolitic rock, the design ground motions<br />
were developed for a rock site condition. This required characterization <strong>of</strong> the bedrock shearwave<br />
velocity near the surface (top 30 m) and selection <strong>of</strong> appropriate ground motion attenuation<br />
models. Since measurements <strong>of</strong> the shear wave velocity (Vs) <strong>of</strong> the foundation rock at the site<br />
were not available at the time the ground motions were developed, a Vs value <strong>of</strong> 700<br />
meters/second (m/sec) was assumed based on shear wave velocities measured in similar bedrock<br />
formations (Fumal, 1978). This velocity was judged at the time to be somewhat conservative for<br />
use in developing ground motion estimates.<br />
The shear wave velocity <strong>of</strong> the bedrock was subsequently measured in the downhole geophysical<br />
surveys. The measured value is about 820 m/sec (or 2,700 fps), slightly higher than the assumed<br />
value. The difference is sufficiently small so that no change to the recommended design<br />
response spectra was judged necessary.<br />
6.3.2 Attenuation Relationships<br />
To characterize the ground motions at the dam site, empirical attenuation relationships were used<br />
to predict peak and spectral accelerations. Three independent relationships were used, to account<br />
for epistemic uncertainty. The relationships were selected on the basis <strong>of</strong> the site conditions and<br />
the tectonic environment.<br />
Table 6-2 lists the three selected relationships along with their magnitude and distance<br />
definitions and limits <strong>of</strong> applicability. The site conditions assumed for each relationship are also<br />
listed in the table. Use <strong>of</strong> the relationship by Boore et al. (1997) for the San Andreas fault MCE<br />
required slight extrapolation beyond the limits <strong>of</strong> applicability stated by its authors. The selected<br />
attenuation relationships were weighted equally for developing the design ground motions.<br />
6.3.3 Deterministic Ground Motion <strong>Analysis</strong><br />
A deterministic analysis was used to estimate the ground motions at the dam site for the MCEs<br />
on the two controlling seismic sources. This approach is consistent with current DSOD<br />
guidelines (Fraser and Howard, 2002).<br />
Given the estimated slip rates on the Hayward and San Andreas faults (about 9 and 24 mm/year,<br />
respectively) and the consequence class weight associated with the dam, the DSOD Consequence<br />
Hazard Matrix dictates the use <strong>of</strong> 84 th -percentile ground motions for deterministic analysis.<br />
Figure 6-2 shows the 84 th -percentile horizontal acceleration response spectra calculated using the<br />
three selected attenuation relationships for the MCE on the Hayward-Rodgers Creek fault. A<br />
similar plot for the MCE on the San Andreas fault is shown in Figure 6-3.<br />
X:\X_GEO\CHABOT DAM\TASK G -- ENGINEERING REPORT\DRAFT FINAL\DYNAMIC STABILITY ANALYSIS_R4.DOC\30-AUG-05\\OAK 6-2
SECTIONSIX<br />
Site - Specific Earthquake Ground Motions<br />
Figures 6-2 and 6-3 also show the arithmetic mean spectra calculated using the three selected<br />
models. The calculated horizontal peak ground accelerations are summarized in Table 6-3.<br />
Because <strong>of</strong> the short site-to-source distance for the Hayward Fault MCE, the vertical ground<br />
motions at the site are expected to be <strong>of</strong> similar (or possibly higher) intensity as the horizontal<br />
motions, at high frequencies. Strong vertical motions are also expected for the San Andreas fault<br />
MCE. However, vertical motions induce primarily normal stresses in the body <strong>of</strong> an<br />
embankment (as opposed to shear stresses) and so are not expected to result in development <strong>of</strong><br />
significant excess pore water pressures or shear deformations. For that reason, vertical motions<br />
are not usually input into the dynamic analysis <strong>of</strong> embankment dams.<br />
6.3.4 Fault Rupture Directivity Effects<br />
Because the dam is located in close proximity to the Hayward and San Andreas faults, the effects<br />
<strong>of</strong> fault rupture directivity were considered in selecting the design ground motions. Fault rupture<br />
directivity increases the intensity <strong>of</strong> long-period motions (periods > 0.6 seconds) when the<br />
rupture propagates toward the site (forward directivity), and decreases the intensity <strong>of</strong> motions<br />
when it propagates away from the site. Two types <strong>of</strong> effects are considered: a) average<br />
amplification due to forward directivity, and b) amplification due to orientation with respect to<br />
fault strike. The latter effect produces stronger long-period motions in the direction normal to<br />
fault strike.<br />
For this study, fault rupture directivity effects for strike-slip faults were accounted for in a<br />
manner consistent with DSOD’s guidelines (Fraser and Howard, 2002) as follows:<br />
• The directivity effects were applied to the average response spectrum (with no directivity)<br />
developed at the appropriate statistical level <strong>of</strong> design for the project;<br />
• The Somerville et al. (1997) near-source factors, as modified by Abrahamson (2000), were<br />
used to develop spectra for average directivity effects and for the fault-normal and faultparallel<br />
components. The portion <strong>of</strong> the fault that ruptures towards the site was assumed to be<br />
40% <strong>of</strong> the total rupture length.<br />
• The spectrum for the fault-parallel component was assumed to be no lower than the spectrum<br />
for the average component without directivity<br />
The effects <strong>of</strong> directivity on the duration <strong>of</strong> strong shaking were accounted for through the<br />
selection <strong>of</strong> time histories for analysis.<br />
6.3.5 Design Response Spectra<br />
The design response spectra for the dam were developed from the results <strong>of</strong> the deterministic<br />
analysis, modified for fault rupture directivity effects. Figures 6-4 and 6-5 show the mean 84 th -<br />
percentile horizontal acceleration response spectra for MCEs on the Hayward and San Andreas<br />
faults, respectively. These figures also show the response spectra modified for average, faultnormal,<br />
and fault-parallel directivity. Figure 6-4 illustrates that the fault-parallel response<br />
spectrum calculated for the MCE on the Hayward fault is similar to that without directivity<br />
effects. For the MCE on the San Andreas fault, however, the calculated fault-parallel response<br />
spectrum is higher than the average spectrum without directivity effects (see Figure 6-5).<br />
X:\X_GEO\CHABOT DAM\TASK G -- ENGINEERING REPORT\DRAFT FINAL\DYNAMIC STABILITY ANALYSIS_R4.DOC\30-AUG-05\\OAK 6-3
SECTIONSIX<br />
Site - Specific Earthquake Ground Motions<br />
Because the longitudinal axis <strong>of</strong> the dam is oriented at about 45° with respect to the strike <strong>of</strong> the<br />
Hayward and San Andreas faults, we recommend that the spectrum corresponding to the average<br />
directivity effects be used for dynamic stability analysis <strong>of</strong> the dam. The recommended spectral<br />
values are tabulated in Table 6-4. The recommended response spectra are applicable to a freefield<br />
rock condition and a damping value <strong>of</strong> 5 percent.<br />
The response spectrum for the MCE on the San Andreas fault is lower than that for the Hayward<br />
fault. However, the MCE on the San Andreas fault has a larger magnitude (M w 8.0) and will<br />
produce longer duration shaking.<br />
6.4 SPECTRUM-COMPATIBLE ACCELERATION TIME HISTORIES<br />
Acceleration time histories were developed for each recommended design response spectrum.<br />
The time histories were selected from a database <strong>of</strong> past earthquake records and then modified to<br />
match the recommended design response spectra.<br />
To evaluate the sensitivity <strong>of</strong> the dam’s dynamic analysis to the time history details, two<br />
acceleration time histories were developed for the Hayward fault MCE. The time histories were<br />
based on the 270-degree and the 0-degree components <strong>of</strong> the Lucerne Valley record <strong>of</strong> the 1992<br />
Landers earthquake. The 360-degree component <strong>of</strong> the Carlo record from the 2002 Denali<br />
earthquake was used for the San Andreas fault MCE. The key characteristics <strong>of</strong> the recorded<br />
time histories are shown in Table 6-5. The recorded acceleration, velocity and displacement time<br />
histories and the corresponding 5%-damped acceleration response spectra are plotted in<br />
Figures 6-6 through 6-11.<br />
The selected recorded time histories were modified so that their spectra after modification<br />
closely match the recommended spectra for each MCE. The records were modified using the<br />
procedures developed by Lilhanand and Tseng (1988), as modified by Abrahamson (1993).<br />
In matching the time histories to the target spectra, the following criteria were used:<br />
• For each time history, and over the period range <strong>of</strong> interest (0.2 to 1.0 seconds), the average<br />
<strong>of</strong> the ratios <strong>of</strong> the spectral accelerations for the modified time history to the corresponding<br />
target spectral accelerations should be approximately equal to 1.0.<br />
• The spectrum for each time history should not be more than about 15 percent lower than the<br />
target spectrum at any period over the period range <strong>of</strong> interest (0.2 to 1.0 seconds).<br />
The recommended time histories and comparisons between their response spectra and the target<br />
spectra are shown in Figures 6-12 through 6-16. Figures 6-12 and 6-13 show the two<br />
recommended time histories for the Hayward fault MCE. The spectra for those time histories are<br />
compared with the target spectrum in Figure 6-14. Figure 6-15 shows the recommended time<br />
history for the San Andreas fault MCE. Its spectrum is compared with the target spectrum in<br />
Figure 6-16. As shown in Figures 6-14 and 6-16, the spectra for the recommended time histories<br />
match the target spectra reasonably well.<br />
X:\X_GEO\CHABOT DAM\TASK G -- ENGINEERING REPORT\DRAFT FINAL\DYNAMIC STABILITY ANALYSIS_R4.DOC\30-AUG-05\\OAK 6-4
SECTIONSIX<br />
Site - Specific Earthquake Ground Motions<br />
Table 6-1<br />
Earthquake Sources Affecting <strong>Chabot</strong> <strong>Dam</strong><br />
Fault<br />
Maximum Magnitude,<br />
M w<br />
Site-to-source Distance,<br />
km Activity 3<br />
Hayward-Rodgers Creek 7 ¼ 0.5 Active<br />
Miller Creek 6 ¼ 4 Active<br />
Contra Costa Shear Zone 1 6 ½ 6 Conditionally Active<br />
Northern Calaveras 7 13 Active<br />
Mt. Diablo Thrust 6 ¾ 15 Active<br />
Contra Costa Shear Zone 2 6 ½ 17 Conditionally Active<br />
Concord-Green Valley 6 ¾ 24 Active<br />
San Andreas 8 30 Active<br />
Greenville 7 33 Active<br />
San Gregorio-Seal Cove 7 ½ 41 Active<br />
Note:<br />
(1) Cull Canyon-Lafayette-Reliz Valley Faults.<br />
(2) Lineament zones, northern <strong>East</strong> <strong>Bay</strong> hills.<br />
(3) Defined in accordance with DSOD guidelines.<br />
Table 6-2<br />
Selected Attenuation Relationships<br />
Definitions<br />
Limits <strong>of</strong> Applicability<br />
Site<br />
Attenuation Relationship Magnitude Distance Magnitude Distance Condition<br />
Abrahamson and Silva (1997)<br />
1<br />
M w<br />
2<br />
R rup (see note 4) (see note 4) Rock<br />
Sadigh et al. (1997) M w<br />
1<br />
R rup<br />
2<br />
4.0 ≤ M w ≤ 8+ R rup ≤ 100 km Rock<br />
Boore et al. (1997)<br />
1<br />
M w<br />
3<br />
R jb 5.5 ≤ M w ≤ 7.5 R jb ≤ 80 km V s =700 m/s<br />
Note:<br />
1 = Moment magnitude.<br />
2 = Closest distance to rupture surface.<br />
3 = Closest horizontal distance to vertical projection <strong>of</strong> rupture surface.<br />
4 = Not stated by the authors <strong>of</strong> the relationship; assumed applicable up to M W 8+, and to the site-to-source<br />
distances, based on range <strong>of</strong> data used for its development.<br />
X:\X_GEO\CHABOT DAM\TASK G -- ENGINEERING REPORT\DRAFT FINAL\DYNAMIC STABILITY ANALYSIS_R4.DOC\30-AUG-05\\OAK 6-5
SECTIONSIX<br />
Site - Specific Earthquake Ground Motions<br />
MCE<br />
Table 6-3<br />
Calculated Horizontal Peak Ground Acceleration<br />
M w<br />
Calculated 84 th -% Horizontal Peak Ground<br />
Distance,<br />
Acceleration, g<br />
km AS 97 SD 97 BR 97 Mean<br />
Hayward-Rodgers Creek 7¼ 0.5 1.25 1.09 0.81 1.05<br />
San Andreas 8.0 30 0.32 0.35 0.32 0.33<br />
Note:<br />
AS 97 = Abrahamson and Silva (1997)<br />
SD 97 = Sadigh et al. (1997)<br />
BR 97 = Boore et al. (1997)<br />
Table 6-4<br />
Recommended Design Response Spectral Values<br />
Recommended Design Response Spectral Values, g<br />
Period, seconds Hayward-Rodgers Creek Fault San Andreas Fault<br />
PGA 1.046 0.331<br />
0.02 1.046 0.331<br />
0.05 1.493 0.390<br />
0.075 1.779 0.444<br />
0.10 2.050 0.518<br />
0.15 2.411 0.644<br />
0.20 2.545 0.718<br />
0.30 2.442 0.751<br />
0.40 2.257 0.727<br />
0.50 2.037 0.680<br />
0.75 1.672 0.588<br />
1.0 1.404 0.528<br />
1.5 0.954 0.418<br />
2.0 0.696 0.344<br />
3.0 0.428 0.227<br />
4.0 0.295 0.164<br />
X:\X_GEO\CHABOT DAM\TASK G -- ENGINEERING REPORT\DRAFT FINAL\DYNAMIC STABILITY ANALYSIS_R4.DOC\30-AUG-05\\OAK 6-6
SECTIONSIX<br />
Site - Specific Earthquake Ground Motions<br />
Table 6-5<br />
Earthquake Records Used to Develop Time Histories<br />
for Hayward-Rodgers Creek Fault and San Andreas Fault MCEs<br />
Earthquake M w Station<br />
Recording Station<br />
Hayward fault MCE<br />
1992 Landers, California 7.3 Lucerne Valley 2<br />
2002 Denali, Alaska 7.9<br />
San Andreas fault MCE<br />
Carlo, Alaska<br />
Station<br />
Distance<br />
(km) Site Condition Component<br />
64<br />
6m Decomposed<br />
Granite<br />
Shallow<br />
Alluvium over<br />
Rock<br />
270-deg<br />
0-deg<br />
360-deg<br />
X:\X_GEO\CHABOT DAM\TASK G -- ENGINEERING REPORT\DRAFT FINAL\DYNAMIC STABILITY ANALYSIS_R4.DOC\30-AUG-05\\OAK 6-7
Project No. 26814536<br />
<strong>Chabot</strong> <strong>Dam</strong><br />
Seismic <strong>Stability</strong><br />
Seismic Sources Map<br />
Figure<br />
6-1<br />
x:\x_geo\chabot dam\Task G -- Engineering Report\Figures\Figure 6-1.grf
6<br />
M w<br />
= 7.25, R = 0.5 km<br />
5<br />
Spectral Acceleration, g<br />
4<br />
3<br />
2<br />
Abrahamson & Silva (1997) - Rock<br />
Sadigh et al. (1997) - Rock<br />
Boore et al. (1997) - V s<br />
= 700 m/s<br />
Mean<br />
1<br />
5% damping<br />
0<br />
0.01 0.1 1<br />
Period, seconds<br />
Project No. 26814536<br />
<strong>Chabot</strong> <strong>Dam</strong><br />
Seismic <strong>Stability</strong><br />
Calculated 84 th -percentile Acceleration Response<br />
Spectra for Hayward-Rodgers Creek Fault MCE<br />
Figure<br />
6-2<br />
x:\x_geo\chabot dam\Task G -Engineering Report\Figures\Figure 6-2.grf
3<br />
M w<br />
= 8.0, R = 30 km<br />
2.5<br />
Spectral Acceleration, g<br />
2<br />
1.5<br />
1<br />
Abrahamson & Silva (1997) - Rock<br />
Sadigh et al. (1997) - Rock<br />
Boore et al. (1997) - V s<br />
= 700 m/s<br />
Mean<br />
5% damping<br />
0.5<br />
0<br />
0.01 0.1 1<br />
Period, seconds<br />
Project No. 26814536<br />
<strong>Chabot</strong> <strong>Dam</strong><br />
Seismic <strong>Stability</strong><br />
Calculated 84 th -percentile Acceleration Response<br />
Spectra for San Andreas Fault MCE<br />
Figure<br />
6-3<br />
x:\x_geo\chabot dam\Task G - Engineering Report\Figure\Figure 6-3.grf
6<br />
M w<br />
= 7.25, R = 0.5 km<br />
5<br />
Spectral Acceleration, g<br />
4<br />
3<br />
2<br />
Fault-Normal Directivity<br />
Average Directivity (Recommended for dam analysis)<br />
Fault-Parallel Directivity<br />
No Directivity<br />
1<br />
5% damping<br />
0<br />
0.01 0.1 1<br />
Period, seconds<br />
Project No. 26814536<br />
<strong>Chabot</strong> <strong>Dam</strong><br />
Seismic <strong>Stability</strong><br />
Design Acceleration Response Spectra<br />
for Hayward-Rodgers Creek Fault MCE<br />
Figure<br />
6-4<br />
x:\x_geo\chabot dam\Task G - Engineering Report\Figures\Figure 6-4.grf
3<br />
M w<br />
= 8.0, R = 30 km<br />
Spectral Acceleration, g<br />
2.5<br />
2<br />
1.5<br />
1<br />
Fault-Normal Directivity<br />
Average Directivity (Recommended for dam analysis)<br />
Fault-Parallel Directivity<br />
No Directivity<br />
5% damping<br />
0.5<br />
0<br />
0.01 0.1 1<br />
Period, seconds<br />
Project No. 26814536<br />
<strong>Chabot</strong> <strong>Dam</strong><br />
Seismic <strong>Stability</strong><br />
Design Acceleration Response<br />
Spectra for San Andreas Fault MCE<br />
Figure<br />
6-5<br />
x:\x_geo\chabot dam\Task G - Engineering Report\Figures\Figure 6-5.grf
Displacement (cm)<br />
Velocity (cm/sec)<br />
16<br />
8<br />
0<br />
-8<br />
32<br />
16<br />
0<br />
-16<br />
-32<br />
0 10 20 30 40 50 60<br />
0.8<br />
1992 Landers, CA Earthquake Time History<br />
at Lucerne Valley Station,<br />
M w = 7.3, R = 2.0 km<br />
-16<br />
0 10 20 30 40 50 60<br />
Acceleration (g)<br />
0.4<br />
0<br />
-0.4<br />
-0.8<br />
0 10 20 30 40 50 60<br />
Time (s)<br />
Project No.<br />
26814536<br />
<strong>Chabot</strong> <strong>Dam</strong><br />
Seismic <strong>Stability</strong><br />
Recorded Time History<br />
1992 Landers, CA Earthquake<br />
at Lucerne Valley Station,<br />
Horizontal Component, 000 deg.<br />
Figure<br />
6-6<br />
X:\x_geo\<strong>Chabot</strong> <strong>Dam</strong>\Task G - Engineering Report\Figures\Figure 6-6.grf
100 10<br />
Frequency, Hz<br />
1 0.1<br />
3<br />
5% damping<br />
Spectral Acceleration in g<br />
2<br />
1<br />
0<br />
0.01 0.1 1 10<br />
Period in seconds<br />
Project No. 26814536<br />
<strong>Chabot</strong> <strong>Dam</strong><br />
Seismic <strong>Stability</strong><br />
x:\x_geo\chabot dam\Task G -- Engineering Report\Figures\Figure 6-7.grf<br />
Acceleration Response Spectra<br />
1992 Landers, CA Earthquake at Lucerne<br />
Valley Station, Horizontal Component 000 deg.<br />
Figure<br />
6-7
Displacement (cm)<br />
Velocity (cm/sec)<br />
72<br />
36<br />
0<br />
-36<br />
112<br />
56<br />
0<br />
-56<br />
-112<br />
0 10 20 30 40 50 60<br />
0.8<br />
1992 Landers, CA Earthquake Time History<br />
at Lucerne Valley Station,<br />
M w = 7.3, R = 2.0 km<br />
-72<br />
0 10 20 30 40 50 60<br />
Acceleration (g)<br />
0.4<br />
0<br />
-0.4<br />
-0.8<br />
0 10 20 30 40 50 60<br />
Time (s)<br />
Project No.<br />
26814536<br />
<strong>Chabot</strong> <strong>Dam</strong><br />
Seismic <strong>Stability</strong><br />
Recorded Time History<br />
1992 Landers, CA Earthquake<br />
at Lucerne Valley Station,<br />
Horizontal Component, 270 deg.<br />
Figure<br />
6-8<br />
X:\x_geo\<strong>Chabot</strong> <strong>Dam</strong>\Task G - Engineering Report\Figures\Figure 6-8.grf
100 10<br />
Frequency, Hz<br />
1 0.1<br />
3<br />
5% damping<br />
Spectral Acceleration in g<br />
2<br />
1<br />
0<br />
0.01 0.1 1 10<br />
Period in seconds<br />
Project No. 26814536<br />
<strong>Chabot</strong> <strong>Dam</strong><br />
Seismic <strong>Stability</strong><br />
x:\x_geo\chabot dam\Task G -- Engineering Report\Figures\Figure 6-9.grf<br />
Acceleration Response Spectra<br />
1992 Landers, CA Earthquake at Lucerne<br />
Valley Station, Horizontal Component 270 deg.<br />
Figure<br />
6-9
Displacement (cm)<br />
Velocity (cm/sec)<br />
16<br />
8<br />
0<br />
-8<br />
32<br />
16<br />
0<br />
-16<br />
-32<br />
0 10 20 30 40 50 60 70 80<br />
0.1<br />
2002 Denali, Alaska Earthquake Time History<br />
Recorded at Carlo, Alaska Station,<br />
M w = 7.9, R = 64 km<br />
-16<br />
0 10 20 30 40 50 60 70 80<br />
Acceleration (g)<br />
0.05<br />
0<br />
-0.05<br />
-0.1<br />
0 10 20 30 40 50 60 70 80<br />
Time (s)<br />
Project No.<br />
26814536<br />
<strong>Chabot</strong> <strong>Dam</strong><br />
Seismic <strong>Stability</strong><br />
Recorded Time History<br />
2002 Denali, Alaska Earthquake<br />
at Carlo, Alaska Station,<br />
Horizontal Component, 360 deg.<br />
Figure<br />
6-10<br />
X:\x_geo\<strong>Chabot</strong> <strong>Dam</strong>\Task G - Engineering Report\Figure\Figure 6-10.grf
100 10<br />
Frequency, Hz<br />
1 0.1<br />
0.5<br />
5% damping<br />
0.4<br />
Spectral Acceleration in g<br />
0.3<br />
0.2<br />
0.1<br />
0<br />
0.01 0.1 1 10<br />
Period in seconds<br />
Project No. 26814536<br />
<strong>Chabot</strong> <strong>Dam</strong><br />
Seismic <strong>Stability</strong><br />
x:\x_geo\chabot dam\Task G -- Engineering Report\Figures\Figure 6-11.grf<br />
Acceleration Response Spectra<br />
2002 Denali, Alaska Earthquake at Carlo,<br />
Alaska Station, Horizontal Component 360 deg.<br />
Figure<br />
6-11
Displacement (cm)<br />
Velocity (cm/sec)<br />
Acceleration (g)<br />
100<br />
50<br />
0<br />
-50<br />
-100<br />
0 10 20 30 40 50 60<br />
200<br />
100<br />
0<br />
-100<br />
-200<br />
0 10 20 30 40 50 60<br />
1<br />
0.5<br />
0<br />
-0.5<br />
Hayward - Rodgers Creek Fault Event - Recommended Time History No.1<br />
(Modified from 1992 Landers, CA Earthquake - Lucerne Valley Station,<br />
Horizontal Component, 270 deg.)<br />
-1<br />
0 10 20 30 40 50 60<br />
Time (s)<br />
Project No.<br />
<strong>Chabot</strong> <strong>Dam</strong><br />
26814536 Seismic <strong>Stability</strong> Hayward - Rodgers Creek Fault MCE<br />
Recommended Time History No.1<br />
Figure<br />
6-12<br />
X:\x_geo\<strong>Chabot</strong> <strong>Dam</strong>\Task G - Engineering Report\Figures\Figure 6-12.grf
Displacement (cm)<br />
Velocity (cm/sec)<br />
Acceleration (g)<br />
100<br />
50<br />
0<br />
-50<br />
-100<br />
0 10 20 30 40 50 60<br />
200<br />
100<br />
0<br />
-100<br />
-200<br />
0 10 20 30 40 50 60<br />
1<br />
0.5<br />
0<br />
-0.5<br />
Hayward - Rodgers Creek Fault Event - Recommended Time History No.2<br />
(Modified from 1992 Landers, CA Earthquake - Lucerne Valley Station,<br />
Horizontal Component, 000 deg.)<br />
-1<br />
0 10 20 30 40 50 60<br />
Time (s)<br />
Project No.<br />
<strong>Chabot</strong> <strong>Dam</strong><br />
26814536 Seismic <strong>Stability</strong> Hayward - Rodgers Creek Fault MCE<br />
Recommended Time History No.2<br />
Figure<br />
6-13<br />
X:\x_geo\<strong>Chabot</strong> <strong>Dam</strong>\Task G - Engineering Report\Figures\Figure 6-13.grf
100 10<br />
Frequency, Hz<br />
1 0.1<br />
3<br />
5% damping<br />
Spectral Acceleration in g<br />
2<br />
1<br />
Target<br />
Recommended Time History No. 1<br />
Recommended Time History No. 2<br />
0<br />
0.01 0.1 1 10<br />
Period in seconds<br />
Project No. 26814536<br />
<strong>Chabot</strong> <strong>Dam</strong><br />
Seismic <strong>Stability</strong><br />
x:\x_geo\chabot dam\Task G -- Engineering Report\Figures\Figure 6-14.grf<br />
Comparison <strong>of</strong> Acceleration Response<br />
Spectra for Hayward-Rodgers Creek Fault MCE<br />
Figure<br />
6-14
Displacement (cm)<br />
Velocity (cm/sec)<br />
40<br />
20<br />
0<br />
-20<br />
-40<br />
0 10 20 30 40 50 60<br />
64<br />
32<br />
0<br />
-32<br />
-64<br />
0 10 20 30 40 50 60<br />
0.4<br />
San Andreas Fault Event - Recommended Time History<br />
(Modified from 2002 Denali, Alaska Earthquake - Carlo, Alaska Station,<br />
Horizontal Component, 360 deg.)<br />
Acceleration (g)<br />
0.2<br />
0<br />
-0.2<br />
-0.4<br />
0 10 20 30 40 50 60<br />
Time (s)<br />
Project No.<br />
<strong>Chabot</strong> <strong>Dam</strong><br />
26814536 Seismic <strong>Stability</strong><br />
San Andreas Fault MCE<br />
Recommended Time History<br />
Figure<br />
6-15<br />
X:\x_geo\<strong>Chabot</strong> <strong>Dam</strong>\Task G - Engineering Report\Figures\Figure 6-15.grf
100 10<br />
Frequency, Hz<br />
1 0.1<br />
1<br />
5% damping<br />
0.8<br />
Spectral Acceleration in g<br />
0.6<br />
0.4<br />
0.2<br />
Target<br />
Recommended Time History<br />
0<br />
0.01 0.1 1 10<br />
Period in seconds<br />
Project No. 26814536<br />
<strong>Chabot</strong> <strong>Dam</strong><br />
Seismic <strong>Stability</strong><br />
x:\x_geo\chabot dam\Task G -- Engineering Report\Figures\Figure 6-16.grf<br />
Comparison <strong>of</strong> Acceleration Response<br />
Spectra for San Andreas Fault MCE<br />
Figure<br />
6-16
SECTIONSEVEN<br />
Embankment and Foundation Conditions<br />
7. Section 7 SEVEN Embankment and Foundation Conditions<br />
This section presents the geotechnical characterization <strong>of</strong> the embankment and foundation<br />
conditions. The characterization consisted <strong>of</strong> three main elements: 1) identifying the material<br />
zones that make up the embankment and foundation, 2) characterizing their engineering<br />
properties, and 3) defining the groundwater conditions and location <strong>of</strong> the phreatic surface for<br />
analysis. This work was based on the field and laboratory investigations conducted as part <strong>of</strong><br />
this study, and on the data from previous investigations <strong>of</strong> the dam. Piezometric data provided<br />
by EBMUD were used in characterizing the groundwater conditions within the dam. The<br />
locations <strong>of</strong> the borings and piezometers used to characterize the site conditions are shown in<br />
Figure 7-1, along with the locations <strong>of</strong> three cross-sections used to illustrate the dam conditions .<br />
As part <strong>of</strong> the geotechnical characterization work, the subsurface data were incorporated into a 3-<br />
D GIS model. The GIS model helped visualize the 3-D geometry <strong>of</strong> the dam, as well as the<br />
spatial distribution <strong>of</strong> the borings and SPT sampling, soil classifications, and foundation soil<br />
thickness. A graphical view <strong>of</strong> the model is presented in Figure 7-2. The electronic data for the<br />
model were previously submitted to EBMUD in the form <strong>of</strong> shape files. Additional details on<br />
the GIS model are presented in Appendix I.<br />
7.1 DAM MATERIALS AND ZONATION<br />
The dam consists mainly <strong>of</strong> the following materials: the wagon fill placed between 1874 and<br />
1875, the sluiced fill placed between 1875 and 1888, additional fill placed between 1890 and<br />
1892, and modern fill and random fill placed in 1980.<br />
In order to develop a model <strong>of</strong> the material zonation in the dam and foundation, three interpretive<br />
cross-sections were prepared based on data from selected borings in the GIS model and on<br />
topographic data obtained at various times in the dam’s history. These sections are shown in<br />
Figures 7-3, 7-4 and 7-5. Some zone boundaries cannot be located with certainty, for example<br />
the contact between the wagon fill and the sluiced fill in the downstream shell. As shown in<br />
Figure 7-3, boring WI-20 contains a significant portion <strong>of</strong> sandy and gravelly material that could<br />
potentially be sluiced fill. The interpretive sections shown in these figures present a best<br />
estimate <strong>of</strong> the zonation within the dam embankment and foundation. The uncertainty regarding<br />
the boundary between the sluiced fill and wagon fill is further discussed in Section 9.<br />
A small amount <strong>of</strong> reservoir silt was encountered in the upstream toe area <strong>of</strong> the embankment in<br />
the reservoir borings. However, since this material is light in weight and has very low shear<br />
strength, it was modeled as part <strong>of</strong> the reservoir. There is some uncertainty about the upstream<br />
boundary between the wagon fill and the reservoir silt, and the interpretive cross sections show<br />
the best estimate based on the available data. The dam foundation can be zoned into foundation<br />
soil and bedrock. The geotechnical characteristics and engineering properties <strong>of</strong> the<br />
embankment and foundation materials are described in the following sections and summarized in<br />
Tables 7-1 through 7-4.<br />
X:\X_GEO\CHABOT DAM\TASK G -- ENGINEERING REPORT\DRAFT FINAL\DYNAMIC STABILITY ANALYSIS_R4.DOC\30-AUG-05\\OAK 7-1
SECTIONSEVEN<br />
Embankment and Foundation Conditions<br />
7.2 EMBANKMENT CONDITIONS<br />
7.2.1 Wagon Fill<br />
General Characteristics<br />
The wagon fill materials were reportedly selected from nearby sources so as to have sufficient<br />
clay to “bind and pack” and were placed in one-foot layers, sprinkled with water, and compacted<br />
by horse and wagon traffic. The records suggest that the materials were placed selectively to<br />
form a clay core, and that a core trench 10 to 30 feet deep and 40 to 90 feet wide was excavated<br />
to bedrock along the dam axis. The wagon fill was placed in at last two separate phases, in the<br />
1870s and 1890s.<br />
As shown in Figures 7-3 and 7-4, the boring data suggest that clayey soils are in fact more<br />
predominant in the central portion <strong>of</strong> the wagon fill, at least in the upper part <strong>of</strong> the embankment<br />
above about Elevation 200. Thus, the wagon fill can be separated into three subzones, consisting<br />
<strong>of</strong> the upstream wagon fill, downstream wagon fill, and central wagon fill. However, the<br />
available data indicate that the overall material characteristics and engineering properties <strong>of</strong> the<br />
wagon fill are relatively similar from upstream to downstream.<br />
Gradation and Plasticity<br />
The wagon fill consists primarily <strong>of</strong> clayey sands and sandy clays, with gravel. The gradations<br />
<strong>of</strong> wagon fill samples obtained in the downstream shell, upstream shell and crest borings are<br />
shown in Figures 7-6 through 7-8, respectively. These figures show that the wagon fill materials<br />
have a broad range <strong>of</strong> gradations, with similar ranges for all locations.<br />
Pockets <strong>of</strong> gravels and sands and silty sands were also occasionally found in the wagon fill. The<br />
log <strong>of</strong> boring WI-20 suggests that there is a zone <strong>of</strong> gravelly sands present near the downstream<br />
limit <strong>of</strong> the wagon fill (Figure 7-3). However, no laboratory gradations were obtained on the<br />
materials to confirm the field logs. Based on the material descriptions in the field logs, it is<br />
possible that this boring encountered the sluiced fill. It is also possible that the boring<br />
encountered a granular pocket within the wagon fill, given the high densities measured in the soil<br />
samples.<br />
The gravel contents <strong>of</strong> the wagon fill materials are plotted against elevation in Figures 7-9 and<br />
7-10. Figure 7-9 shows the data from this investigation, whereas Figure 7-10 shows data from<br />
previous investigations. The wagon fill materials have gravel contents up to about 40%, and<br />
there is good agreement between the data from this and previous investigations. Although the<br />
observed gravel contents are not high enough to control the behavior <strong>of</strong> the materials under<br />
shear, they are sufficiently high to impact SPT blow counts.<br />
The fines contents <strong>of</strong> the wagon fill materials from current and previous investigations are<br />
plotted in Figures 7-11 and 7-12, respectively. The fines contents generally range from about<br />
15 to 70% and average about 40%. Because <strong>of</strong> the broadly graded nature <strong>of</strong> the materials, the<br />
fines contents are expected to control the overall material behavior under shear and cyclic<br />
loading. The results <strong>of</strong> Atterberg limits tests from this and previous investigations, shown in<br />
Figures 7-13 and 7-14, indicate that the fines typically are <strong>of</strong> medium plasticity. Figure 7-15<br />
indicates that the plasticity <strong>of</strong> the fines is about the same for the clayey sands and sandy clays.<br />
X:\X_GEO\CHABOT DAM\TASK G -- ENGINEERING REPORT\DRAFT FINAL\DYNAMIC STABILITY ANALYSIS_R4.DOC\30-AUG-05\\OAK 7-2
SECTIONSEVEN<br />
Embankment and Foundation Conditions<br />
Figures 7-16 and 7-17 show the plasticity index and liquid limit <strong>of</strong> the materials plotted against<br />
elevation. The plasticity index for the wagon fill generally ranges from about 10 to 25 and the<br />
liquid limit ranges from about 25 to 45. These ranges are roughly constant with elevation, and<br />
are consistent with the data from previous investigations.<br />
Density and Moisture Content<br />
Figures 7-18 and 7-19 present dry unit weight data for the wagon fill materials from this and<br />
previous investigations, respectively. The data from the current investigation show a relatively<br />
uniform range <strong>of</strong> dry densities with elevation whereas the data from previous investigations<br />
show a wider range, a lower average, and a trend <strong>of</strong> decreasing dry density above Elevation 200.<br />
These differences are probably associated with the following factors: 1) the data from previous<br />
investigations includes a larger number <strong>of</strong> samples taken at higher elevations near the spillway<br />
where predominantly clayey materials were placed at higher water contents, and 2) the data from<br />
previous investigations were mainly from 2-inch diameter samples while the data from the<br />
current investigation came from 2.8-inch and 2.5-inch diameter samples, which have less<br />
disturbance. Similar trends are illustrated in Figures 7-20 and 21, which present moisture<br />
content data. An apparent higher average moisture content above Elevation 200 is visible by<br />
comparing the data from previous investigations with the current investigation data. Figure 7-22<br />
shows that the total unit weight <strong>of</strong> the wagon fill materials ranges between about 120 and 145<br />
pounds per cubic foot (pcf) and is relatively uniform with elevation.<br />
Shear Strength<br />
As part <strong>of</strong> this investigation, 12 isotropically consolidated-undrained (ICU) triaxial strength tests<br />
with pore pressure measurements were performed on 2.8-inch-diameter Pitcher barrel samples <strong>of</strong><br />
the wagon fill. These data were combined with data from the previous investigations and were<br />
used to evaluate the shear strength <strong>of</strong> the wagon fill materials.<br />
Figure 7-23 shows the results <strong>of</strong> the tests from this investigation, plotted in terms <strong>of</strong> effective<br />
stress-path parameters at 10% axial strain. In the figure, the data are identified by sample<br />
location (C=crest, DS=downstream shell, US=upstream shell) and type <strong>of</strong> material. The data for<br />
clayey sands (SC) and sandy clays (CL) fall within a narrow range regardless <strong>of</strong> location. The<br />
data supports using the same effective shear strength parameters for the central, upstream, and<br />
downstream portions <strong>of</strong> the wagon fill. The test results are best represented by an effective stress<br />
friction angle <strong>of</strong> 30º.<br />
The results <strong>of</strong> the tests in terms <strong>of</strong> total stress-path parameters are shown in Figure 7-24. Again,<br />
the data supports using the same total strength parameters for the central, upstream, and<br />
downstream portions <strong>of</strong> the wagon fill. The test results can be represented by a total friction<br />
angle <strong>of</strong> 21.5º and a cohesion intercept <strong>of</strong> 200 pounds per square foot (psf).<br />
The results <strong>of</strong> the previous ICU and anisotropically consolidated-undrained (ACU) triaxial tests<br />
conducted on the wagon fill during the 1965 Shannon & Wilson study are compared with the<br />
results from the current ICU tests in Figures 7-25 and 7-26. The results <strong>of</strong> the previous tests are<br />
in good agreement with the data from this investigation. During the Shannon & Wilson study, a<br />
large number <strong>of</strong> ICU tests without pore pressure measurements were also conducted, using<br />
samples retrieved with a 2-inch modified California sampler driven by hammer blows. These<br />
tests are judged to be unreliable because <strong>of</strong> sample disturbance. Furthermore, the results can<br />
X:\X_GEO\CHABOT DAM\TASK G -- ENGINEERING REPORT\DRAFT FINAL\DYNAMIC STABILITY ANALYSIS_R4.DOC\30-AUG-05\\OAK 7-3
SECTIONSEVEN<br />
Embankment and Foundation Conditions<br />
only be interpreted in terms <strong>of</strong> total stresses because <strong>of</strong> the lack <strong>of</strong> pore pressure measurements.<br />
Nonetheless, the results <strong>of</strong> these tests are compared in Figure 7-27 with the representative total<br />
strength parameters selected based on the current tests. As shown, the selected total strength<br />
parameters fit reasonably well with the data for most <strong>of</strong> the CL samples tested, especially at<br />
lower confining pressures.<br />
Liquefaction Susceptibility<br />
The fines contents <strong>of</strong> the wagon fill are sufficiently high such that the behavior <strong>of</strong> the materials<br />
under monotonic shear and cyclic loading is expected to be controlled by the fines fraction.<br />
Because <strong>of</strong> the clayey nature <strong>of</strong> the fines along with moderate water contents and medium<br />
plasticity, the wagon-fill soils are judged not susceptible to liquefaction. This conclusion was<br />
reached by applying the modified Chinese criteria proposed by Seed and Idriss (1982) and the<br />
criteria recently proposed by Seed et al. (2003). The conclusion is also supported by the criteria<br />
recently proposed by Boulanger and Idriss (2004). The criteria proposed by Andrews and Martin<br />
(2000) were also considered, but given less weight since recent research (Bray et al., 2001) has<br />
shown the content <strong>of</strong> clay size particles to be an unreliable indicator <strong>of</strong> liquefaction<br />
susceptibility.<br />
As shown in Figure 7-28, the bulk <strong>of</strong> the sandy clays and clayey sands in the wagon fill are not<br />
susceptible to liquefaction, based on comparison <strong>of</strong> the water content and the liquid limit. On<br />
average, the water content <strong>of</strong> the materials (15 to 25%) is significantly lower than the liquid limit<br />
(25 to 45%). Although some pockets <strong>of</strong> sands and silty sands are present, they are <strong>of</strong> limited<br />
extent and thus, will not affect the overall strength <strong>of</strong> the wagon fill zone significantly.<br />
Although liquefaction is not expected, the wagon fill materials can develop excess pore pressures<br />
during strong earthquake shaking. Such excess pore pressures will result in a reduced undrained<br />
strength. The strength loss potential <strong>of</strong> the material as a result <strong>of</strong> cyclic loading is discussed in<br />
Section 11. The dynamic properties are discussed in Sections 10 and 12.<br />
7.2.2 Sluiced Fill<br />
General<br />
Relatively little information is available regarding the construction <strong>of</strong> the downstream sluiced fill<br />
zone. Reportedly, the sluiced materials were transported by water along a ditch and flume. The<br />
sluicing operation reportedly occurred only during the rainy seasons for a number <strong>of</strong> years. An<br />
EBMUD drawing dated 1937 indicates that a retaining dike was built in the stream channel a few<br />
hundred feet downstream from the dam to retain the sluicing water and fines.<br />
Gradation and Plasticity<br />
The sluiced fill consists primarily <strong>of</strong> silty and clayey sands with gravel. Pockets <strong>of</strong> cleaner sands<br />
and gravels and lenses <strong>of</strong> clays are also present. The gradations <strong>of</strong> the samples obtained from<br />
this investigation in the downstream toe area are shown in Figure 7-29. With exception <strong>of</strong> a few<br />
clay samples, the gradations fall within a relatively narrow band, consistent with placement by<br />
sluicing. Figures 7-30 and 7-31 show the fines contents measured in this and previous<br />
investigations, respectively. Figures 7-32 and 7-33 show the corresponding gravel contents, and<br />
X:\X_GEO\CHABOT DAM\TASK G -- ENGINEERING REPORT\DRAFT FINAL\DYNAMIC STABILITY ANALYSIS_R4.DOC\30-AUG-05\\OAK 7-4
SECTIONSEVEN<br />
Embankment and Foundation Conditions<br />
Figures 7-34 and 7-35 summarize the measured Atterberg limits <strong>of</strong> the fines fraction. In general,<br />
the data on the sluiced fill from this and previous investigations are consistent.<br />
The measured gravel content <strong>of</strong> the sluiced fill materials generally ranged from about 15 to 35%,<br />
based on the samples obtained. The actual gravel contents in-situ may be somewhat higher,<br />
since the samplers used cannot representatively sample larger gravels approaching the sampler<br />
diameter in size. In contrast with the wagon fill, the fines contents <strong>of</strong> the granular sluiced fill<br />
generally range between about 10 and 25%. Such fines contents are not high enough to control<br />
the behavior <strong>of</strong> the material under shear or cyclic loading. Thus, the sluiced fill is expected to<br />
behave predominantly as a granular cohesionless material.<br />
Density and Moisture Content<br />
Few measurements <strong>of</strong> the sliced fill density and moisture content were performed for this<br />
investigation because <strong>of</strong> sample disturbance. Figures 7-36 and 7-37 summarize the dry unit<br />
weights and moisture contents measured in previous investigations. The corresponding total unit<br />
weights are shown in Figure 7-38. The dry unit weight <strong>of</strong> the sluiced fill generally ranges from<br />
about 100 to 125 pcf while the moisture content ranges from about 10 to 40% and the total unit<br />
weight ranges from about 110 to 145 pcf.<br />
Shear Strength<br />
Because it is difficult to obtain undisturbed samples <strong>of</strong> the sluiced fill materials, little or no<br />
reliable laboratory test data are available on the shear strength <strong>of</strong> the sluiced fill. A significant<br />
number <strong>of</strong> ICU tests without pore pressure measurements were performed on driven 2-inch<br />
modified California samples for the 1965 S&W study. As noted, those tests are <strong>of</strong> questionable<br />
reliability because <strong>of</strong> sample disturbance. Also, the tests lacked pore pressure measurements and<br />
thus do not provide effective strength data.<br />
The insitu test data indicate that the sluiced fill materials are generally loose to medium dense,<br />
which is consistent with their method <strong>of</strong> placement. Based on an average standard penetration<br />
test (SPT) blow count N 60 <strong>of</strong> about 8, and considering the fines contents, an effective friction<br />
angle <strong>of</strong> about 33º was estimated for the sluiced fill materials. For monotonic loading, total<br />
strength parameters corresponding to a cohesion <strong>of</strong> 350 psf and a friction angle <strong>of</strong> 32º were<br />
estimated based on the S&W tests.<br />
Liquefaction Susceptibility<br />
In view <strong>of</strong> their granular nature and relatively low fines contents, the sluiced fill materials are<br />
considered susceptible to liquefaction when saturated. The liquefaction resistance <strong>of</strong> the<br />
materials and their residual strength after liquefaction are best assessed based on available<br />
empirical correlations with SPT resistance (e.g. Seed et al., 2003; Seed and Harder, 1990). The<br />
liquefaction potential and residual strength <strong>of</strong> the sluiced fill are discussed in Section 11. The<br />
dynamic properties <strong>of</strong> the sluiced fill are discussed in Sections 10 and 12.<br />
X:\X_GEO\CHABOT DAM\TASK G -- ENGINEERING REPORT\DRAFT FINAL\DYNAMIC STABILITY ANALYSIS_R4.DOC\30-AUG-05\\OAK 7-5
SECTIONSEVEN<br />
Embankment and Foundation Conditions<br />
7.2.3 Modern Fill<br />
Compacted fill was placed on the downstream slope <strong>of</strong> the embankment to raise the crest during<br />
the 1980 dam modifications. The material was obtained primarily from the excavation for the<br />
new spillway, and was specified to be free <strong>of</strong> organics and rocks larger than 6 inches. The<br />
specifications also called for at least 89% relative compaction as determined by ASTM D 698<br />
modified to a compaction energy <strong>of</strong> 20,000 ft-lb/ft 3 . The results <strong>of</strong> field control tests indicate<br />
that the material was placed at an average dry unit weight <strong>of</strong> about 122 pcf and a moisture<br />
content <strong>of</strong> 10 percent. The fill consists mainly <strong>of</strong> medium dense to dense gravelly clayey sand.<br />
Laboratory tests on selected samples from this investigation indicate that the fines content is<br />
between about 30 and 40% and the gravel content is between about 10 and 20%. The effective<br />
stress friction angle <strong>of</strong> the material is estimated to be about 35º based on the compaction effort<br />
and the SPT resistance <strong>of</strong> the materials. This value agrees reasonably well with published data<br />
for similar materials.<br />
The fill placed on the upstream portion <strong>of</strong> the crest during the 1980 modifications was specified<br />
to be relatively impervious material, e.g. clayey silt or sandy clay, and was specified to be<br />
compacted to at least 94% relative compaction. For the purposes <strong>of</strong> this study, this material was<br />
assumed to have the same properties as the fill placed on the downstream slope.<br />
The fillet fill placed on the downstream slope after the 1965 S&W study was also compacted.<br />
Because <strong>of</strong> its small volume, this fill does not play a key role in the stability <strong>of</strong> the dam. For<br />
analysis, it was assumed to have the same engineering properties as the fill placed in 1980.<br />
7.2.4 Random Fill<br />
Random fill was placed in a designated disposal area near the downstream toe during the 1980<br />
dam modifications. The bulk <strong>of</strong> the random fill reportedly consists <strong>of</strong> materials similar to those<br />
placed in the modern fill. The random fill was specified to be placed in 10-inch maximum lifts<br />
and compacted to at least 85% relative compaction as determined by ASTM D 698. The fill<br />
reportedly also includes broken concrete, masonry rubble, and other materials removed for the<br />
dam modifications. Voids were reportedly filled with sluiced or jetted soil, and the disposal area<br />
was covered with a minimum 3-foot-thick cover <strong>of</strong> soil. Because <strong>of</strong> its location and thickness,<br />
this zone is not expected to play a key role in the stability <strong>of</strong> the dam. Its properties were<br />
assumed to be the same as those <strong>of</strong> the sluiced fill. The random fill is located entirely above the<br />
measured phreatic surface and, therefore, is not considered susceptible to liquefaction.<br />
7.3 FOUNDATION CONDITIONS<br />
7.3.1 Foundation Soils<br />
The dam site was reportedly stripped about 2 to 3 feet deep to remove vegetation and loose soil<br />
during original construction. However, except for the core trench, it appears that the existing<br />
foundation soils were mostly left in place. The field investigations conducted for this and<br />
previous studies encountered significant depths <strong>of</strong> foundation soils consisting primarily <strong>of</strong><br />
alluvium and colluvium deposits.<br />
As shown in Figure 7-3, the thickness <strong>of</strong> foundation soils along the main section <strong>of</strong> the dam, near<br />
the former stream channel, is estimated to be generally less than about 10 feet. In some areas <strong>of</strong><br />
X:\X_GEO\CHABOT DAM\TASK G -- ENGINEERING REPORT\DRAFT FINAL\DYNAMIC STABILITY ANALYSIS_R4.DOC\30-AUG-05\\OAK 7-6
SECTIONSEVEN<br />
Embankment and Foundation Conditions<br />
the channel there appears to be little or no foundation soil. At the location <strong>of</strong> cross-section B-B’<br />
(Figure 7-4) the foundation soils are estimated to be up to about 20 to 25 feet thick. This<br />
estimate is based on the thickness <strong>of</strong> colluvium/alluvium logged in borings WI-62 and 66, the<br />
approximate contours <strong>of</strong> the pre-dam ground surface, and the average estimated top <strong>of</strong> bedrock<br />
elevations. The pre-dam contours in Figure 7-1 appear to show a terrace in this area, which<br />
could correspond with the greater foundation soil thickness. A similar terrace appears to be<br />
present on the west side <strong>of</strong> the stream channel in the area <strong>of</strong> boring WI-65.<br />
The depths <strong>of</strong> foundation soil logged in the borings drilled for this investigation agree relatively<br />
well (to within ±10 feet) with the values inferred from the difference in elevation between the<br />
pre-dam ground surface contours and the estimated top <strong>of</strong> bedrock. That comparison indicates<br />
that the greatest thickness <strong>of</strong> foundation soil is present in the area <strong>of</strong> boring WI-13 and that the<br />
foundation soils thin down considerably on the steep slopes <strong>of</strong> the abutments.<br />
The boring data from this and previous investigations indicate that the foundation soils consist<br />
primarily <strong>of</strong> medium dense clayey sands and stiff sandy clays with gravel, similar to the wagon<br />
fill materials. Pockets <strong>of</strong> relatively clean alluvial sands and gravels were encountered in some <strong>of</strong><br />
the borings. However, the extent <strong>of</strong> these materials appears to be primarily confined to locations<br />
near the original stream channel. Because <strong>of</strong> their limited extent, the presence <strong>of</strong> these materials,<br />
which are potentially liquefiable, is judged unlikely to significantly affect the stability <strong>of</strong> the<br />
dam.<br />
Figure 7-39 shows the gradations <strong>of</strong> samples <strong>of</strong> the foundation soils obtained during the current<br />
investigation. Comparison <strong>of</strong> this figure with Figures 7-6, 7-7, and 7-8 shows that the range <strong>of</strong><br />
gradations <strong>of</strong> the foundation soils is very similar to that <strong>of</strong> the wagon fill materials. The<br />
laboratory test data from this and previous investigations indicate that other engineering<br />
characteristics <strong>of</strong> the foundation soils are also very similar to those <strong>of</strong> the wagon fill. This is<br />
shown in the plots <strong>of</strong> index and strength properties <strong>of</strong> the wagon fill, which also show results for<br />
the foundation soils (Figures 7-9 through 7-37). On this basis, the material properties <strong>of</strong> the<br />
foundation soils for analysis are assumed to be the same as those <strong>of</strong> the wagon fill.<br />
7.3.2 Bedrock<br />
Shales and siltstones <strong>of</strong> the Knoxville formation, were encountered in borings WI-66 and 67,<br />
beneath the upstream shell <strong>of</strong> the dam. The central portion <strong>of</strong> the dam is underlain by Leona<br />
Rhyolite, which was encountered in borings WI-59, 61, 62, and 64. Rock types beneath the<br />
downstream shell include basalt (encountered in boring WI-62), serpentinite (encountered in<br />
borings WI-60 and 63), and gabbro (encountered in boring WI-65) . Based on the available<br />
information and mapping, the foundation bedrock appears to be free <strong>of</strong> major weaknesses or<br />
discontinuities that could affect the stability <strong>of</strong> the dam. For the purposes <strong>of</strong> analysis, the rock<br />
mass is judged to be much stronger than the embankment and foundation soils.<br />
Data from previous investigations indicate that the total density <strong>of</strong> the rock ranges between about<br />
130 and 150 pcf, with a representative average <strong>of</strong> about 140 pcf. The downhole seismic surveys<br />
conducted for this investigation indicate that the shear wave velocity <strong>of</strong> the rock immediately<br />
beneath the dam ranges between about 1,500 and 5,000 feet per second (fps), with a<br />
representative average <strong>of</strong> about 2,700 fps.<br />
X:\X_GEO\CHABOT DAM\TASK G -- ENGINEERING REPORT\DRAFT FINAL\DYNAMIC STABILITY ANALYSIS_R4.DOC\30-AUG-05\\OAK 7-7
SECTIONSEVEN<br />
Embankment and Foundation Conditions<br />
7.4 GROUNDWATER CONDITIONS<br />
The piezometric data obtained by EBMUD were reviewed to assess the groundwater conditions<br />
within the dam and to estimate the location <strong>of</strong> the phreatic line for analysis. These data are<br />
recorded in piezometers located as shown in Figure 7-1. Some <strong>of</strong> the piezometer locations<br />
include multiple installations with up to three piezometers in one boring. The installations in<br />
borings WI-51 to 58 consist <strong>of</strong> up to two piezometers, an upper and a lower piezometer (A and<br />
B), in each boring.<br />
The interpreted phreatic surface through the dam was developed based on piezometric data<br />
corresponding to a full reservoir level at spillway Elevation 227. The result is shown in the<br />
cross-sections in Figures 7-3 through 7-5. The piezometric data indicate a moderate gradient in<br />
the upstream shell with water levels decreasing gradually from the reservoir level to about<br />
Elevation 190 beneath the dam crest. With exception <strong>of</strong> the upper piezometer (A) in WI-55<br />
(Figure 7-3), all other piezometers indicate a gentle gradient downstream, with water levels at<br />
about Elevation 155 in the toe area decreasing to about Elevation 135 in the valley downstream.<br />
The cause for the high reading in upper piezometer WI-55A within the embankment has not been<br />
determined. This piezometer was recently tested by the District (along with piezometer WI-15A)<br />
and found to be in working order. Because the piezometer tip appears to be located within the<br />
embankment fill materials, it is unlikely that the elevated level reflects water levels in the<br />
foundation. It is possible, however, that the piezometer intercepts a permeable layer within the<br />
embankment that is affected by high natural groundwater levels. The piezometric level reported<br />
in WI-55A is at approximately the same elevation as in the crest piezometers and is higher than<br />
WI-56, located further upstream. If accurate, this would indicate a flat or slightly upward<br />
gradient from WI-56 to WI-55A,which does not make sense. Thus, the high piezometric level<br />
observed in WI-55A appears likely to represent only a localized condition rather than a large<br />
zone <strong>of</strong> the embankment. On this basis, a level intermediate between piezometers WI-55A and<br />
B was used to define the phreatic surface through the embankment, as shown in Figures 7-3<br />
through 7-5. This phreatic surface was used in the stability analysis <strong>of</strong> the dam.<br />
X:\X_GEO\CHABOT DAM\TASK G -- ENGINEERING REPORT\DRAFT FINAL\DYNAMIC STABILITY ANALYSIS_R4.DOC\30-AUG-05\\OAK 7-8
SECTIONSEVEN<br />
Embankment and Foundation Conditions<br />
Table 7-1<br />
Representative Index Properties <strong>of</strong> Embankment and Foundation Materials (1)<br />
Material<br />
Dry Unit<br />
Weight<br />
(pcf)<br />
Total Unit<br />
Weight<br />
(pcf)<br />
Liquid<br />
Limit (%)<br />
Plasticity<br />
Index (%)<br />
Fines<br />
Content<br />
(%)<br />
Gravel<br />
Content<br />
(%)<br />
Modern Fill 122 134 - - (35 - 40) (15 – 20)<br />
Random Fill (2) 109 130 - - - -<br />
Wagon Fill<br />
Sluiced Fill<br />
Foundation Soils<br />
115<br />
(90 - 120)<br />
109<br />
(80 - 125)<br />
115<br />
(90 - 120)<br />
133<br />
(120 - 145)<br />
130<br />
(110 - 140)<br />
133<br />
(120 - 145)<br />
38<br />
(27 - 45)<br />
18<br />
(10 - 25)<br />
40<br />
(20 - 60)<br />
36 (3) 18 (3) 15<br />
(10 - 95)<br />
33<br />
(25 - 45)<br />
13<br />
(10 - 20)<br />
40<br />
(25 - 60)<br />
Bedrock - 140 - - - -<br />
Notes:<br />
(1). Typical range shown in parentheses.<br />
(2). Random fill placed at the downstream toe as a part <strong>of</strong> the 1980’s modification.<br />
(3). Values represent only the fines fraction <strong>of</strong> the sluiced fill.<br />
15<br />
(0 - 30)<br />
25<br />
(0 - 45)<br />
10<br />
(0 - 30)<br />
Table 7-2<br />
Strength Parameters for Embankment and Foundation Soils<br />
Total Unit<br />
Weight<br />
Total Strength<br />
Parameters<br />
Effective Strength<br />
Parameters<br />
Residual<br />
Strength<br />
γ t c φ c’ φ’ S r<br />
Material (Zone) (pcf) (psf) (°) (psf) (°) (psf)<br />
Modern Fill 134 - - 0 35 -<br />
Random Fill 130 - - 0 33 -<br />
Wagon Fill (D/S and U/S) 133 200 21.5 0 30 -<br />
Wagon Fill (Core) 133 200 21.5 0 30 -<br />
Sluiced Fill 130 350 32 0 33 150<br />
Foundation Soils 133 200 21.5 0 30 -<br />
X:\X_GEO\CHABOT DAM\TASK G -- ENGINEERING REPORT\DRAFT FINAL\DYNAMIC STABILITY ANALYSIS_R4.DOC\30-AUG-05\\OAK 7-9
SECTIONSEVEN<br />
Embankment and Foundation Conditions<br />
Table 7-3<br />
Comparison <strong>of</strong> Effective Stress Strength Parameters Between This and Previous Studies<br />
This Study S&W, 1965 DSOD, 2003<br />
c’ φ’ c’ φ’ c’ φ’<br />
DSOD Zone<br />
Material (Zone) (psf) (°) (psf) (°) (psf) (°)<br />
Designation<br />
Modern Fill 0 35 - - - - Embankment Fill 2<br />
Wagon Fill 0 30 0 35 - -<br />
Embankment Fill<br />
Wagon Fill Upper<br />
Wagon Fill Lower<br />
Sluiced Fill 0 33 0 35 - - Hydraulic Fill Lower<br />
Random Fill 0 33 - - - - Hydraulic Fill Upper<br />
Foundation Soils 0 30 0 35 - - Foundation<br />
Table 7-4<br />
Comparison <strong>of</strong> Total Stress Strength Parameters Between This and Previous Studies<br />
This Study S&W, 1965 DSOD, 2003<br />
c φ c φ c φ<br />
Material (Zone) (psf) (°) (psf) (°) (psf) (°) DSOD Zone Designation<br />
Modern Fill - - - - 0 37 Embankment Fill 2<br />
Wagon Fill 200 21.5 800 16.5<br />
0<br />
550<br />
375<br />
37<br />
20<br />
30<br />
Embankment Fill<br />
Wagon Fill Upper<br />
Wagon Fill Lower<br />
Sluiced Fill 350 32 800 16.5 450 34 Hydraulic Fill Lower<br />
Random Fill - - - - 450 34 Hydraulic Fill Upper<br />
Foundation Soils 200 21.5 800 16.5 375 30 Foundation<br />
X:\X_GEO\CHABOT DAM\TASK G -- ENGINEERING REPORT\DRAFT FINAL\DYNAMIC STABILITY ANALYSIS_R4.DOC\30-AUG-05\\OAK 7-10
1 inch equals 100 feet<br />
Feet<br />
0 50 100 200<br />
WI-45<br />
WI-43<br />
Stream Channel<br />
WI-49<br />
WI-50<br />
WI-44A<br />
130<br />
WI-41<br />
SPILLWAY<br />
140<br />
WI-42<br />
WI-53<br />
WI-16<br />
WI-58<br />
C'<br />
150<br />
205<br />
195<br />
185<br />
175<br />
165<br />
155<br />
145<br />
235<br />
225<br />
215<br />
WI-17<br />
WI-57<br />
BPT-3<br />
WI-23<br />
WI-47<br />
WI-54<br />
WI-13<br />
WI-51<br />
WI-48<br />
WI-9<br />
WI-19<br />
WI-65<br />
WI-39<br />
160<br />
WI-22<br />
WI-63<br />
A'<br />
135<br />
C<br />
WI-55<br />
125<br />
WI-38<br />
WI-3<br />
WI-60<br />
WI-2<br />
170<br />
WI-61<br />
115<br />
WI-37<br />
WI-32<br />
180<br />
B'<br />
WI-67<br />
A<br />
WI-29<br />
WI-4<br />
190<br />
115<br />
WI-5<br />
WI-28<br />
125<br />
WI-64<br />
WI-44* WI-62<br />
WI-33 WI-21<br />
WI-34 WI-42* WI-26<br />
WI-46*<br />
WI-41*<br />
WI-43* WI-35<br />
WI-10<br />
WI-59<br />
WI-11<br />
WI-56<br />
WI-14<br />
WELL#3<br />
BPT-2<br />
WI-52<br />
WI-20<br />
BPT-1<br />
WI-15<br />
WELL#1<br />
WI-45*<br />
WELL#4<br />
WI-18<br />
WI-27<br />
WI-40<br />
135<br />
200<br />
WI-66<br />
WI-6<br />
WI-36<br />
WI-12<br />
210<br />
B<br />
WI-31<br />
WI-7<br />
WELL#5<br />
WI-25<br />
WI-30<br />
WI-24<br />
220<br />
250<br />
175<br />
185<br />
240<br />
145<br />
195<br />
155<br />
165<br />
215<br />
225<br />
230<br />
235<br />
245<br />
205<br />
255<br />
220<br />
175<br />
180<br />
215<br />
230<br />
240<br />
190<br />
200<br />
250<br />
210<br />
Legend<br />
Borings shown on Section A-A'<br />
Borings shown on Section B-B'<br />
Borings shown on Section C-C'<br />
Other borings, not shown<br />
on sections<br />
Piezometer<br />
Current ground surface contours (ft)<br />
Pre-dam ground surface contours (ft)<br />
URS Corporation L:\Projects\<strong>Chabot</strong>_<strong>Dam</strong>_26814536\MXD\Current Working Documents\081904\Cross-section data with xsec members plus remainder.mxd Date: 9/13/2004 5:19:30 PM Name: dhwrigh0<br />
<strong>Chabot</strong> <strong>Dam</strong><br />
Seismic <strong>Stability</strong><br />
26814536<br />
Plan View <strong>of</strong> <strong>Dam</strong> and<br />
Cross-sections<br />
Figure<br />
7-1
175<br />
190<br />
210<br />
230<br />
250<br />
250<br />
130<br />
150<br />
170<br />
190<br />
Legend<br />
210<br />
<strong>Chabot</strong> <strong>Dam</strong><br />
Seismic <strong>Stability</strong><br />
26814536<br />
230<br />
Clays<br />
(CH; CL; CL-OL; CL/GC; CL/GP; CL/SC; CL/SC/GC; CL/SP; CL/CH; CL-ML )<br />
Silts<br />
(MH; MH/CH; ML; ML/SM; ML/CH )<br />
Clean Sands and Gravels<br />
(GP; GP/GW; GW; GW-GC; GP-GC; SP; SP-SC; SP-SM; SP/SW<br />
Silty Sands<br />
(SM; SM/GM; SM/SC)<br />
Clayey Sands<br />
(GC; SC/GC; SC/CL; SC; SC/Fm; SC-SM)<br />
Boring extent<br />
GIS Model - Distribution <strong>of</strong> Soil Types<br />
in Embankment and Foundation<br />
Figure<br />
7-2<br />
URS Corporation L:\Projects\<strong>Chabot</strong>_<strong>Dam</strong>_26814536\MXD\Current Working Documents\081904\Distribution <strong>of</strong> soil types.mxd Date: 3/11/2005 3:54:32 PM Name: dhwrigh0
300<br />
250<br />
Spillway Crest EL. 227.25 ft.<br />
MODERN FILL (1980)<br />
Elevation, Feet (MSL)<br />
200<br />
150<br />
100<br />
RESERVOIR SILT<br />
Est. Top <strong>of</strong> Bedrock<br />
Fill (1891 - 1892)<br />
WAGON FILL<br />
FOUNDATION SOIL<br />
Fill (1890 ~ 1892)<br />
Approx. Line <strong>of</strong> Pre-1890 Fill<br />
(see note 2)<br />
WAGON FILL<br />
Approx. Line <strong>of</strong><br />
Core Trench<br />
Pre-<strong>Dam</strong> Ground Surface<br />
(see note 1)<br />
Est. Top <strong>of</strong> Foundation Soil<br />
FOUNDATION SOIL<br />
RANDOM FILL (1980)<br />
SLUICED<br />
FILL (1875 - 1888)<br />
50<br />
0<br />
-300 -200 -100 0 100 200 300 400 500<br />
Offset from Centerline, Feet<br />
Notes:<br />
1. Pre-<strong>Dam</strong> Ground Surface is taken from Reference Drawing (1) and is considered approximate. Surface is used as a<br />
guide in estimating the top <strong>of</strong> foundation soil and is shown for reference purposes only.<br />
2. Approx. Line <strong>of</strong> Pre-1890 Fill is taken from Reference Drawing (3) and is considered approximate.<br />
3. Contact between Fill (1890-1892) and Modern Fill/Random Fill is taken from Reference Drawings (4) and (5).<br />
4. Current Ground Surface is taken from Reference Drawings (2) and (6).<br />
Reference Drawings:<br />
(1) EBMUD Drawing No. 1497-R-1, Topography - 1934 Survey, dated 1934;<br />
(2) EBMUD Drawing No. 1487-R-1, Topography, dated March 10, 1967;<br />
(3) EBMUD Drawing No. 41D, Cross Section <strong>of</strong> <strong>Dam</strong> Showing Various Stages <strong>of</strong> Construction, dated April 26, 1937;<br />
(4) EBMUD Drawing No. 6948-G-2.04, Earthwork Sections, dated December 7, 1982;<br />
(5) EBMUD Drawing No. 6948-G-1.05, Existing Topography & Location <strong>of</strong> Borings, dated December 7, 1982;<br />
(6) EBMUD Drawing No. 6948-G-1.03.1, As Built Topography, dated December 7, 1982.<br />
Top <strong>of</strong> bedrock<br />
Project No.<br />
26814536<br />
<strong>Chabot</strong> <strong>Dam</strong><br />
Seismic <strong>Stability</strong><br />
Cross Section A - A'<br />
FIGURE<br />
7-3<br />
x:\x_geo\<strong>Chabot</strong> <strong>Dam</strong>\Task G - Engineering Report\Figures\Figure 7-3.grf
300<br />
250<br />
Spillway Crest EL. 227.25 ft.<br />
MODERN FILL (1980)<br />
Elevation, Feet (MSL)<br />
200<br />
150<br />
100<br />
RESERVOIR SILT<br />
Est. Top <strong>of</strong> Foundation Soil<br />
Est. Top <strong>of</strong> Bedrock<br />
Fill (1891 - 1892)<br />
WAGON FILL<br />
FOUNDATION SOIL<br />
Approx. Line <strong>of</strong><br />
Core Trench<br />
Fill (1890 - 1892)<br />
Approx. Line <strong>of</strong> Pre-1890<br />
Fill (see note 2)<br />
WAGON FILL<br />
Pre-<strong>Dam</strong> Ground Surface<br />
(see note 1)<br />
FOUNDATION SOIL<br />
SLUICED FILL<br />
(1875 - 1888)<br />
50<br />
0<br />
-300 -200 -100 0 100 200 300 400 500<br />
Offset from Centerline, Feet<br />
Notes:<br />
1. Pre-<strong>Dam</strong> Ground Surface is taken from Reference Drawing (1) and is considered approximate. Surface is used as a<br />
guide in estimating the top <strong>of</strong> foundation soil and is shown for reference purposes only.<br />
2. Approx. Line <strong>of</strong> Pre-1890 Fill is taken from Reference Drawing (3) and is considered approximate.<br />
3. Contact between Fill (1890-1892) and Modern Fill/Random Fill is taken from Reference Drawings (4) and (5).<br />
4. Current Ground Surface is taken from Reference Drawings (2) and (6).<br />
Reference Drawings:<br />
(1) EBMUD Drawing No. 1497-R-1, Topography - 1934 Survey, dated 1934;<br />
(2) EBMUD Drawing No. 1487-R-1, Topography, dated March 10, 1967;<br />
(3) EBMUD Drawing No. 41D, Cross Section <strong>of</strong> <strong>Dam</strong> Showing Various Stages <strong>of</strong> Construction, dated April 26, 1937;<br />
(4) EBMUD Drawing No. 6948-G-2.04, Earthwork Sections, dated December 7, 1982;<br />
(5) EBMUD Drawing No. 6948-G-1.05, Existing Topography & Location <strong>of</strong> Borings, dated December 7, 1982;<br />
(6) EBMUD Drawing No. 6948-G-1.03.1, As Built Topography, dated December 7, 1982.<br />
Top <strong>of</strong> bedrock<br />
Project No.<br />
26814536<br />
<strong>Chabot</strong> <strong>Dam</strong><br />
Seismic <strong>Stability</strong><br />
Cross Section B - B'<br />
FIGURE<br />
7-4<br />
x:\x_geo\<strong>Chabot</strong> <strong>Dam</strong>\Task G - Engineeering Report\Figures\Figure 7-4.grf
300<br />
250<br />
Spillway Crest EL. 227.25 ft.<br />
MODERN FILL (1980)<br />
Elevation, Feet (MSL)<br />
200<br />
150<br />
100<br />
RESERVOIR SILT<br />
Approx. Line <strong>of</strong> Pre-1890<br />
Fill (see note 2)<br />
WAGON FILL<br />
Fill (1891 ~ 1892)<br />
Pre-dam Ground Surface<br />
(see note 1)<br />
Approx. Line <strong>of</strong><br />
Core Trench<br />
Fill (1890 ~ 1892)<br />
FOUNDATION SOIL<br />
Est. Top <strong>of</strong> Bedrock<br />
FOUNDATION SOIL<br />
RANDOM<br />
FILL (1980)<br />
SLUICED FILL<br />
(1875 - 1888)<br />
Est. Top <strong>of</strong> Foundation Soil<br />
50<br />
0<br />
-300 -200 -100 0 100 200 300 400 500<br />
Offset from Centerline, Feet<br />
Notes:<br />
1. Pre-<strong>Dam</strong> Ground Surface is taken from Reference Drawing (1) and is considered approximate. Surface is used as a<br />
guide in estimating the top <strong>of</strong> foundation soil and is shown for reference purposes only.<br />
2. Approx. Line <strong>of</strong> Pre-1890 Fill is taken from Reference Drawing (3) and is considered approximate.<br />
3. Contact between Fill (1890-1892) and Modern Fill/Random Fill is taken from Reference Drawings (4) and (5).<br />
4. Current Ground Surface is taken from Reference Drawings (2) and (6).<br />
Reference Drawings:<br />
(1) EBMUD Drawing No. 1497-R-1, Topography - 1934 Survey, dated 1934;<br />
(2) EBMUD Drawing No. 1487-R-1, Topography, dated March 10, 1967;<br />
(3) EBMUD Drawing No. 41D, Cross Section <strong>of</strong> <strong>Dam</strong> Showing Various Stages <strong>of</strong> Construction, dated April 26, 1937;<br />
(4) EBMUD Drawing No. 6948-G-2.04, Earthwork Sections, dated December 7, 1982;<br />
(5) EBMUD Drawing No. 6948-G-1.05, Existing Topography & Location <strong>of</strong> Borings, dated December 7, 1982;<br />
(6) EBMUD Drawing No. 6948-G-1.03.1, As Built Topography, dated December 7, 1982.<br />
Top <strong>of</strong> bedrock<br />
Project No.<br />
26814536<br />
<strong>Chabot</strong> <strong>Dam</strong><br />
Seismic <strong>Stability</strong><br />
Cross Section C - C'<br />
FIGURE<br />
7-5<br />
x:\x_geo\<strong>Chabot</strong> <strong>Dam</strong>\Task G - Engineering Report\Figures\Figure 7-5'.grf
0<br />
10<br />
20<br />
30<br />
40<br />
50<br />
60<br />
70<br />
80<br />
90<br />
100<br />
0.001<br />
<strong>Dynamic</strong> <strong>Stability</strong> <strong>of</strong> <strong>Chabot</strong> <strong>Dam</strong> GRADATION OF WAGON FILL<br />
Lake <strong>Chabot</strong> <strong>Dam</strong>, San Leandro, California<br />
IN DOWNSTREAM SHELL BORINGS<br />
26814536.C0000 FIGURE 7-6<br />
PERCENT PASSING<br />
PERCENT RETAINED<br />
SIEVE_LANDSCAPE_30_PT_TABLE OAK_CHABOTDAM.GPJ 8/31/04<br />
100<br />
90<br />
80<br />
70<br />
60<br />
50<br />
40<br />
30<br />
20<br />
10<br />
COBBLES<br />
0<br />
200<br />
BORING<br />
NUMBER<br />
WI-59<br />
WI-59<br />
WI-59<br />
WI-59<br />
WI-59<br />
WI-59<br />
WI-59<br />
WI-59<br />
WI-59<br />
WI-59<br />
WI-59<br />
WI-59<br />
WI-62<br />
WI-62<br />
WI-62<br />
6" 3" 2" 1.5"<br />
100<br />
DEPTH<br />
(FT)<br />
17.5-18<br />
22.5-25<br />
31.5-33<br />
43-44.5<br />
48-48.5<br />
52.5-53.5<br />
53.5-54.5<br />
60-61.5<br />
67-68<br />
72.5-74<br />
78-79<br />
86-86.5<br />
10-10.5<br />
21.5-23<br />
26-27.5<br />
coarse fine coarse medium fine<br />
50 20<br />
8B<br />
10<br />
13<br />
15<br />
16B<br />
18T<br />
18B<br />
21<br />
23B<br />
25<br />
26B<br />
29B<br />
3C<br />
7<br />
8<br />
GRAVEL<br />
1<br />
SAMPLE SYMBOL<br />
NUMBER<br />
3/4" 3/8"<br />
10<br />
DESCRIPTION<br />
5 2<br />
Clayey Sand with Gravel (SC)<br />
Clayey Sand (SC)<br />
Clayey Sand (SC)<br />
Silty Clayey Sand with Gravel (SC-SM)<br />
Silty Clayey Sand with Gravel (SC-SM)<br />
Sandy Clay (CL)<br />
Clayey Sand (SC)<br />
Clayey Sand (SC)<br />
4<br />
Clayey Sand with Gravel (SC)<br />
Silty Sand with Gravel (SM)<br />
Sandy Clay (CL/CH)<br />
Sandy Clay (CL)<br />
Silty Sand with Gravel (SM)<br />
Clayey Sand with Gravel (SC)<br />
Clayey Sand with Gravel (SC)<br />
U.S. STANDARD SIEVE SIZES<br />
10 16 30<br />
1<br />
SAND<br />
0.5<br />
50 100 200<br />
0.2<br />
0.1<br />
PARTICLE SIZES IN MILLIMETERS<br />
BORING<br />
NUMBER<br />
WI-62<br />
WI-62<br />
WI-62<br />
WI-62<br />
WI-62<br />
WI-62<br />
WI-62<br />
WI-62<br />
WI-62<br />
WI-62<br />
WI-62<br />
WI-62<br />
WI-62<br />
DEPTH<br />
(FT)<br />
33-33.5<br />
37-37.5<br />
37.5-38<br />
38.5-39<br />
45-46.5<br />
49-50.5<br />
61-61.5<br />
65-66<br />
66.5-67.5<br />
73-73.5<br />
81.5-82<br />
83-84.5<br />
88.5-90<br />
SILT AND CLAY<br />
0.05 0.02 0.01 0.005 0.002<br />
SAMPLE<br />
NUMBER<br />
10B<br />
11B<br />
12A<br />
12C<br />
14<br />
15<br />
18B<br />
20T<br />
20B<br />
22B<br />
25C<br />
26<br />
28<br />
SYMBOL<br />
DESCRIPTION<br />
Sandy Clay (CL)<br />
Sandy Clay (CL)<br />
Clay (CL)<br />
Clayey Sand (SC)<br />
Sandy Clay (CL)<br />
Clayey Sand (SC)<br />
Clayey Sand with Gravel (SC)<br />
Sandy Clay (CL)<br />
Clayey Sand with Gravel (SC)<br />
Clayey Sand with Gravel (SC)<br />
Clayey Sand (SC)<br />
Clayey Sand (SC)<br />
Sandy Clay (CL)
0<br />
10<br />
20<br />
30<br />
40<br />
50<br />
60<br />
70<br />
80<br />
90<br />
100<br />
0.001<br />
<strong>Dynamic</strong> <strong>Stability</strong> <strong>of</strong> <strong>Chabot</strong> <strong>Dam</strong>GRADATION OF WAGON FILL<br />
Lake <strong>Chabot</strong> <strong>Dam</strong>, San Leandro, California<br />
IN UPSTREAM SHELL BORINGS<br />
26814536.C0000 FIGURE 7-7<br />
PERCENT PASSING<br />
PERCENT RETAINED<br />
SIEVE_LANDSCAPE_30_PT_TABLE OAK_CHABOTDAM.GPJ 8/31/04<br />
100<br />
90<br />
80<br />
70<br />
60<br />
50<br />
40<br />
30<br />
20<br />
10<br />
COBBLES<br />
0<br />
200<br />
BORING<br />
NUMBER<br />
WI-66<br />
WI-66<br />
WI-66<br />
WI-66<br />
WI-66<br />
WI-67<br />
WI-67<br />
WI-67<br />
WI-67<br />
WI-67<br />
WI-67<br />
6" 3" 2" 1.5"<br />
100<br />
DEPTH<br />
(FT)<br />
7-7.5<br />
15.5-16.5<br />
24-25<br />
25-26<br />
33-34.5<br />
10-12.5<br />
19.5-21<br />
21.5-23<br />
26.5-27.5<br />
41-41.5<br />
50.5-51<br />
coarse fine coarse medium fine<br />
50 20<br />
2B<br />
5B<br />
8T<br />
8B<br />
13<br />
2<br />
6A<br />
7<br />
9A<br />
14B<br />
18A<br />
GRAVEL<br />
1<br />
SAMPLE SYMBOL<br />
NUMBER<br />
3/4" 3/8"<br />
10<br />
DESCRIPTION<br />
Clayey Sand (SC)<br />
Clay with Sand (CL)<br />
5 2<br />
Sandy Clay (CL)<br />
Clayey Sand with Gravel (SC)<br />
Clayey Sand with Gravel (SC)<br />
Clay with Sand (CL)<br />
Sandy Clay (CL)<br />
Clayey Sand with Gravel (SC)<br />
Clayey Sand with Gravel (SC)<br />
Clayey Sand with Gravel (SC)<br />
Sandy Clay (CL)<br />
4<br />
U.S. STANDARD SIEVE SIZES<br />
10 16 30<br />
1<br />
SAND<br />
0.5<br />
50 100 200<br />
0.2<br />
0.1<br />
PARTICLE SIZES IN MILLIMETERS<br />
BORING<br />
NUMBER<br />
DEPTH<br />
(FT)<br />
SILT AND CLAY<br />
0.05 0.02 0.01 0.005 0.002<br />
SAMPLE<br />
NUMBER<br />
SYMBOL<br />
DESCRIPTION
0<br />
10<br />
20<br />
30<br />
40<br />
50<br />
60<br />
70<br />
80<br />
90<br />
100<br />
0.001<br />
<strong>Dynamic</strong> <strong>Stability</strong> <strong>of</strong> <strong>Chabot</strong> <strong>Dam</strong>GRADATION OF WAGON FILL<br />
Lake <strong>Chabot</strong> <strong>Dam</strong>, San Leandro, California<br />
IN CREST BORINGS<br />
26814536.C0000 FIGURE 7-8<br />
PERCENT PASSING<br />
PERCENT RETAINED<br />
SIEVE_LANDSCAPE_30_PT_TABLE OAK_CHABOTDAM.GPJ 8/31/04<br />
100<br />
90<br />
80<br />
70<br />
60<br />
50<br />
40<br />
30<br />
20<br />
10<br />
COBBLES<br />
0<br />
200<br />
BORING<br />
NUMBER<br />
WI-61<br />
WI-61<br />
WI-61<br />
WI-61<br />
WI-61<br />
WI-61<br />
WI-61<br />
WI-61<br />
WI-61<br />
WI-61<br />
WI-64<br />
WI-64<br />
WI-64<br />
WI-64<br />
WI-64<br />
6" 3" 2" 1.5"<br />
100<br />
DEPTH<br />
(FT)<br />
26-56.5<br />
41-42.5<br />
61-62.5<br />
71-71.5<br />
81-81.5<br />
85-86.5<br />
95-96.5<br />
111-111.5<br />
115-116.5<br />
125-126.5<br />
20-22.5<br />
40-42.5<br />
55-56.5<br />
71-71.5<br />
75-76.5<br />
coarse fine coarse medium fine<br />
50 20<br />
8B<br />
11B<br />
15B<br />
17B<br />
20B<br />
21<br />
23<br />
26C<br />
27<br />
29<br />
5B<br />
9B<br />
12<br />
15C<br />
16<br />
GRAVEL<br />
1<br />
SAMPLE SYMBOL<br />
NUMBER<br />
3/4" 3/8"<br />
10<br />
DESCRIPTION<br />
Sandy Clay (CL)<br />
Sandy Clay (CL)<br />
5 2<br />
Clayey Sand with Gravel (SC)<br />
Clayey Sand with Gravel (SC)<br />
Sandy Clay (CL)<br />
Clayey Sand (SC)<br />
Clayey Sand with Gravel (SC)<br />
Clayey Sand with Gravel (SC)<br />
Clayey Sand with Gravel (SC)<br />
Clayey Sand with Gravel (SC)<br />
Sandy Clay (CL)<br />
Clayey Sand (SC)<br />
4<br />
Clayey Sand with Gravel (SC)<br />
Clayey Sand with Gravel (SC)<br />
Clayey Sand with Gravel (SC)<br />
U.S. STANDARD SIEVE SIZES<br />
10 16 30<br />
1<br />
SAND<br />
0.5<br />
50 100 200<br />
0.2<br />
0.1<br />
PARTICLE SIZES IN MILLIMETERS<br />
BORING<br />
NUMBER<br />
WI-64<br />
WI-64<br />
WI-64<br />
WI-64<br />
WI-64<br />
DEPTH<br />
(FT)<br />
90.5-91<br />
95-96.5<br />
111-111.5<br />
115.5-116<br />
125-126.5<br />
SILT AND CLAY<br />
0.05 0.02 0.01 0.005 0.002<br />
SAMPLE<br />
NUMBER<br />
19B<br />
20<br />
23C<br />
24B<br />
27<br />
SYMBOL<br />
DESCRIPTION<br />
Clayey Sand with Gravel (SC)<br />
Clayey Sand (SC)<br />
Clayey Sand with Gravel (SC)<br />
Clayey Sand with Gravel (SC)<br />
Silty Clayey Sand (SC-SM)
260<br />
<strong>Chabot</strong> <strong>Dam</strong> - Gravel Content <strong>of</strong> Different Soil Types<br />
260<br />
Modern Fill<br />
Wagon Fill<br />
Foundation Soil<br />
240<br />
240<br />
220<br />
220<br />
200<br />
200<br />
Elevation, ft<br />
180<br />
180<br />
160<br />
160<br />
140<br />
140<br />
120<br />
120<br />
100<br />
100<br />
0 20 40 60 80 100<br />
Gravel Content, %<br />
Project No. 26814536<br />
<strong>Chabot</strong> <strong>Dam</strong><br />
Seismic <strong>Stability</strong><br />
Gravel Content<br />
From Borings WI-59, 61, 62, 64, 66 and 67<br />
Wagon Fill Zone<br />
x:\x_geo\chabot dam\Task E -- <strong>Stability</strong> and Performance <strong>Analysis</strong>\Soil Characterization\GC in WF 2(new borings).grf<br />
Figure<br />
7-9
240<br />
<strong>Chabot</strong> <strong>Dam</strong> - Gravel Content <strong>of</strong> Different Soil Types<br />
Embankment Fill<br />
Foundation Soil<br />
240<br />
220<br />
220<br />
200<br />
200<br />
Elevation, ft<br />
180<br />
160<br />
180<br />
160<br />
140<br />
140<br />
120<br />
120<br />
100<br />
100<br />
0 20 40 60 80 100<br />
Gravel Content, %<br />
Project No. 26814536<br />
<strong>Chabot</strong> <strong>Dam</strong><br />
Seismic <strong>Stability</strong><br />
Gravel Content<br />
From Previous Borings in Wagon Fill Zone<br />
Figure<br />
7-10<br />
x:\x_geo\chabot dam\Task I -- DSOD meetings\plots by FS and EF\GC in WF.grf
260<br />
240<br />
<strong>Chabot</strong> <strong>Dam</strong> - Fines Content <strong>of</strong> Different Soil Types<br />
Modern Fill<br />
Wagon Fill<br />
Foundation Soil<br />
260<br />
240<br />
220<br />
220<br />
200<br />
200<br />
Elevation, ft<br />
180<br />
180<br />
160<br />
160<br />
140<br />
140<br />
120<br />
120<br />
100<br />
100<br />
0 20 40 60 80 100<br />
Fines Content, %<br />
Project No. 26814536<br />
<strong>Chabot</strong> <strong>Dam</strong><br />
Seismic <strong>Stability</strong><br />
Fines Content<br />
From Borings WI-59, 61, 62, 64, 66 and 67<br />
Wagon Fill Zone<br />
Figure<br />
7-11<br />
x:\x_geo\chabot dam\Task E -- <strong>Stability</strong> and Performance <strong>Analysis</strong>\Soil Characterization\FC in WF 2(new borings).grf
240<br />
<strong>Chabot</strong> <strong>Dam</strong> - Fines Content <strong>of</strong> Different Soil Types<br />
Embankment Fill<br />
Foundation Soil<br />
240<br />
220<br />
220<br />
200<br />
200<br />
Elevation, ft<br />
180<br />
160<br />
180<br />
160<br />
140<br />
140<br />
120<br />
120<br />
100<br />
100<br />
0 20 40 60 80 100<br />
Fines Content, %<br />
Project No. 26814536<br />
<strong>Chabot</strong> <strong>Dam</strong><br />
Seismic <strong>Stability</strong><br />
Fines Content<br />
From Previous Borings in Wagon Fill Zone<br />
Figure<br />
7-12<br />
x:\x_geo\chabot dam\Task I -- DSOD meetings\plots by FS and EF\FC in WF.grf
60<br />
50<br />
Plasticity Chart<br />
CH or OH<br />
"U" LINE<br />
"A" LINE<br />
Plasticity Index (PI)<br />
40<br />
30<br />
20<br />
CL or OL<br />
MH or OH<br />
10<br />
CL-ML<br />
ML or OL<br />
0<br />
0 10 20 30 40 50 60 70 80 90 100 110<br />
Liquid Limit (LL)<br />
Modern Fill<br />
Wagon Fill<br />
Foundation Soil<br />
x:x_geo\chabot dam\Task E --<strong>Stability</strong> and Deformation <strong>Analysis</strong>\Plasticity in WF 2(new borings).grf<br />
Project No. <strong>Chabot</strong> <strong>Dam</strong><br />
Figure<br />
26814536 Seismic <strong>Stability</strong><br />
Plasticity from Borings<br />
WI-59, 61, 62, 64, 66 and 67<br />
Wagon Fill Zone (by Material Zone)<br />
7-13
60<br />
50<br />
Plasticity Chart<br />
CH or OH<br />
"U" LINE<br />
"A" LINE<br />
Plasticity Index (PI)<br />
40<br />
30<br />
20<br />
CL or OL<br />
MH or OH<br />
10<br />
CL-ML<br />
ML or OL<br />
0<br />
0 10 20 30 40 50 60 70 80 90 100 110<br />
Liquid Limit (LL)<br />
Foundation Soil<br />
Embankment Fill<br />
x:x_geo\chabot dam\Task I -- DSOD meetings\plots by FS and EF\Plasticity in WF.grf<br />
Project No. <strong>Chabot</strong> <strong>Dam</strong><br />
26814536 Seismic <strong>Stability</strong><br />
Figure<br />
Plasticity from Previous Borings<br />
in Wagon Fill Zone<br />
7-14
60<br />
50<br />
Plasticity Chart<br />
CH or OH<br />
"U" LINE<br />
"A" LINE<br />
Plasticity Index (PI)<br />
40<br />
30<br />
20<br />
CL or OL<br />
MH or OH<br />
10<br />
CL-ML<br />
ML or OL<br />
0<br />
0 10 20 30 40 50 60 70 80 90 100 110<br />
Liquid Limit (LL)<br />
SM<br />
SC<br />
CL<br />
x:x_geo\chabot dam\Task E --<strong>Stability</strong> and Deformation <strong>Analysis</strong>\Plasticity in WF(new borings).grf<br />
Project No. <strong>Chabot</strong> <strong>Dam</strong><br />
26814536 Figure<br />
Seismic <strong>Stability</strong><br />
Plasticity from Borings<br />
WI-59, 61, 62, 64, 66 and 67<br />
Wagon Fill Zone (by Soil Classification)<br />
7-15
260<br />
240<br />
<strong>Chabot</strong> <strong>Dam</strong> - Plasticity Index <strong>of</strong> Different Soil Types<br />
Modern Fill<br />
Wagon Fill<br />
Foundation Soil<br />
260<br />
240<br />
220<br />
220<br />
200<br />
200<br />
Elevation, ft<br />
180<br />
180<br />
160<br />
160<br />
140<br />
140<br />
120<br />
120<br />
100<br />
100<br />
0 20 40 60<br />
Plasticity Index (PI), %<br />
Project No. 26814536<br />
<strong>Chabot</strong> <strong>Dam</strong><br />
Seismic <strong>Stability</strong><br />
Plasticity Index<br />
From Borings WI-59, 61, 62, 64, 66 and 67<br />
Wagon Fill Zone<br />
Figure<br />
7-16<br />
x:\x_geo\chabot dam\Task E -- <strong>Stability</strong> and Performance <strong>Analysis</strong>\Soil Characterization\PI in WF 2(new borings).grf
260<br />
240<br />
<strong>Chabot</strong> <strong>Dam</strong> - Liquid Limit <strong>of</strong> Different Soil Types<br />
Modern Fill<br />
Wagon Fill<br />
Foundation Soil<br />
260<br />
240<br />
220<br />
220<br />
200<br />
200<br />
Elevation, ft<br />
180<br />
180<br />
160<br />
160<br />
140<br />
140<br />
120<br />
120<br />
100<br />
100<br />
0 20 40 60 80<br />
Liquid Limit (LL), %<br />
Project No. 26814536<br />
<strong>Chabot</strong> <strong>Dam</strong><br />
Seismic <strong>Stability</strong><br />
Liquid Limit<br />
From Borings WI-59, 61, 62, 64, 66 and 67<br />
Wagon Fill Zone<br />
Figure<br />
7-17<br />
x:\x_geo\chabot dam\Task E -- <strong>Stability</strong> and Performance <strong>Analysis</strong>\Soil Characterization\LL in WF 2(new borings).grf
260<br />
240<br />
<strong>Chabot</strong> <strong>Dam</strong> - Dry Unit Weight <strong>of</strong> Different Soil Types<br />
Modern Fill<br />
Wagon Fill<br />
Foundation Soil<br />
260<br />
240<br />
220<br />
220<br />
200<br />
200<br />
Elevation, ft<br />
180<br />
180<br />
160<br />
160<br />
140<br />
140<br />
120<br />
120<br />
100<br />
100<br />
0 40 80 120 160<br />
Dry Unit Weight, pcf<br />
Project No. 26814536<br />
<strong>Chabot</strong> <strong>Dam</strong><br />
Seismic <strong>Stability</strong><br />
Dry Unit Weight<br />
From Borings WI-59, 61, 62, 64, 66 and 67<br />
Wagon Fill Zone<br />
Figure<br />
7-18<br />
x:\x_geo\chabot dam\Task E -- <strong>Stability</strong> and Performance <strong>Analysis</strong>\Soil Characterization\DD in WF 2(new borings).grf
240<br />
<strong>Chabot</strong> <strong>Dam</strong> - Dry Unit Weight <strong>of</strong> Different Soil Types<br />
Embankment Fill<br />
Foundation Soil<br />
240<br />
220<br />
220<br />
200<br />
200<br />
Elevation, ft<br />
180<br />
160<br />
180<br />
160<br />
140<br />
140<br />
120<br />
120<br />
100<br />
100<br />
0 40 80 120 160<br />
Dry Unit Weight, pcf<br />
Project No. 26814536<br />
<strong>Chabot</strong> <strong>Dam</strong><br />
Seismic <strong>Stability</strong><br />
Dry Unit Weight<br />
From Previous Borings in Wagon Fill Zone<br />
Figure<br />
7-19<br />
x:\x_geo\chabot dam\Task I -- DSOD meetings\plots by FS and EF\DD in WF.grf
<strong>Chabot</strong> <strong>Dam</strong> - Moisture Content <strong>of</strong> Different Soil Types<br />
260<br />
260<br />
Modern Fill<br />
Wagon Fill<br />
Foundation Soil<br />
240<br />
240<br />
220<br />
220<br />
200<br />
200<br />
Elevation, ft<br />
180<br />
180<br />
160<br />
160<br />
140<br />
140<br />
120<br />
120<br />
100<br />
100<br />
0 20 40 60 80 100<br />
Moisture Content, %<br />
Project No. 26814536<br />
<strong>Chabot</strong> <strong>Dam</strong><br />
Seismic <strong>Stability</strong><br />
Moisture Content<br />
From Borings WI-59, 61, 62, 64, 66 and 67<br />
Wagon Fill Zone<br />
Figure<br />
7-20<br />
x:\x_geo\chabot dam\Task E -- <strong>Stability</strong> and Performance <strong>Analysis</strong>\Soil Characterization\MC in WF2 (new borings).grf
240<br />
<strong>Chabot</strong> <strong>Dam</strong> - Moisture Content <strong>of</strong> Different Soil Types<br />
Embankment Fill<br />
Foundation Soil<br />
240<br />
220<br />
220<br />
200<br />
200<br />
Elevation, ft<br />
180<br />
160<br />
180<br />
160<br />
140<br />
140<br />
120<br />
120<br />
100<br />
100<br />
0 20 40 60 80 100<br />
Moisture Content, %<br />
Project No. 26814536<br />
<strong>Chabot</strong> <strong>Dam</strong><br />
Seismic <strong>Stability</strong><br />
Moisture Content<br />
From Previous Borings in Wagon Fill Zone<br />
Figure<br />
7-21<br />
x:\x_geo\chabot dam\Task I -- DSOD meetings\plots by FS and EF\MC in WF.grf
260<br />
240<br />
<strong>Chabot</strong> <strong>Dam</strong> - Total Unit Weight <strong>of</strong> Different Soil Types<br />
Modern Fill<br />
Wagon Fill<br />
Foundation Soil<br />
260<br />
240<br />
220<br />
220<br />
200<br />
200<br />
Elevation, ft<br />
180<br />
180<br />
160<br />
160<br />
140<br />
140<br />
120<br />
120<br />
100<br />
100<br />
0 40 80 120 160<br />
Total Unit Weight, pcf<br />
Project No. 26814536<br />
<strong>Chabot</strong> <strong>Dam</strong><br />
Seismic <strong>Stability</strong><br />
Total Unit Weight<br />
From Borings WI-59, 61, 62, 64, 66 and 67<br />
Wagon Fill Zone<br />
Figure<br />
7-22<br />
x:\x_geo\chabot dam\Task E -- <strong>Stability</strong> and Performance <strong>Analysis</strong>\Soil Characterization\TD in WF (new borings).grf
(σ1'-σ3')/2, psi<br />
100<br />
80<br />
60<br />
40<br />
20<br />
Sample ID<br />
1: 61-11B<br />
2: 64-5B<br />
3: 61-15B<br />
4: 64-9B<br />
5: 59-18T<br />
6: 59-26B<br />
7: 62-20T<br />
8: 59-18B<br />
9: 62-20B<br />
10: 62-31B<br />
11: 66-8T<br />
12: 67-6A<br />
13: 66-8B<br />
2<br />
1<br />
12<br />
11 13<br />
5<br />
7<br />
3<br />
4<br />
0<br />
0 20 40 60 80 100 120 140 160 180 200<br />
(σ1'+σ3')/2, psi<br />
8<br />
9<br />
6<br />
Selected for <strong>Analysis</strong><br />
(c' = 0, φ' = 30 o )<br />
10<br />
At 10% axial strain<br />
C WF CL<br />
C WF SC<br />
DS WF CL<br />
DS WF SC<br />
US WF CL<br />
US WF SC<br />
Foundation Soil<br />
x:x_geo\chabot dam\Task G - Engineering Report\Figures\Figure 7-23.grf<br />
Project No. <strong>Chabot</strong> <strong>Dam</strong><br />
26814536<br />
Figure<br />
Seismic <strong>Stability</strong><br />
Wagon Fill<br />
Effective Shear Strength from<br />
ICU Triaxial Compression Tests<br />
7-23
100<br />
Sample ID<br />
At 10% axial strain<br />
(σ1-σ3)/2, psi<br />
80<br />
60<br />
40<br />
20<br />
1: 61-11B<br />
2: 64-5B<br />
3: 61-15B<br />
4: 64-9B<br />
5: 59-18T<br />
6: 59-26B<br />
7: 62-20T<br />
8: 59-18B<br />
9: 62-20B<br />
10: 62-31B<br />
11: 66-8T<br />
12: 67-6A<br />
13: 66-8B<br />
2<br />
11<br />
1<br />
13<br />
5<br />
12<br />
Selected for <strong>Analysis</strong><br />
(c = 200 psf, φ = 21.5 o )<br />
7<br />
3<br />
0<br />
0 20 40 60 80 100 120 140 160 180 200<br />
(σ1+σ3)/2, psi<br />
4<br />
10<br />
8<br />
6<br />
C WF CL<br />
C WF SC<br />
DS WF CL<br />
DS WF SC<br />
US WF CL<br />
US WF SC<br />
Foundation Soil<br />
9<br />
Project No.<br />
26814536<br />
<strong>Chabot</strong> <strong>Dam</strong><br />
Seismic <strong>Stability</strong><br />
Wagon Fill<br />
Total Shear Strength from<br />
ICU Triaxial Compression Tests<br />
Figure<br />
7-24<br />
x:x_geo\chabot dam\Task G - Engineering Report\Figures\Figure 7-24.grf
100<br />
At maximum obliquity<br />
Sample ID<br />
80<br />
14: 21-6 (401)<br />
15: 21-6 (402)<br />
16: 21-12 (301)<br />
17: 21-12 (302)<br />
(σ1'-σ3')/2, psi<br />
60<br />
40<br />
17<br />
14<br />
16<br />
Selected for <strong>Analysis</strong><br />
(c' = 0, φ' = 30 o )<br />
20<br />
15<br />
This study<br />
S&W 1965<br />
0<br />
0 20 40 60 80 100 120 140 160 180 200<br />
(σ1'+σ3')/2, psi<br />
Project No.<br />
26814536<br />
<strong>Chabot</strong> <strong>Dam</strong><br />
Seismic <strong>Stability</strong><br />
Wagon Fill<br />
Effective Shear Strength from<br />
ICU Triaxial Compression Tests<br />
Comparison with Prior Data<br />
Figure<br />
7-25<br />
x:x_geo\chabot dam\Task G - Engineering Report\Figures\Figure 7-25.grf
100<br />
At maximum deviator stress<br />
80<br />
Sample ID<br />
14: 21-6 (401)<br />
15: 21-6 (402)<br />
16: 21-12 (301)<br />
17: 21-12 (302)<br />
(σ1-σ3)/2, psi<br />
60<br />
40<br />
Selected for <strong>Analysis</strong><br />
(c = 200psf, φ = 21.5 o )<br />
16<br />
20<br />
17<br />
14<br />
15<br />
This study<br />
S&W 1965<br />
0<br />
0 20 40 60 80 100 120 140 160 180 200<br />
x:x_geo\chabot dam\Task G - Engieering Report\Figures\Figure 7-26.grf<br />
(σ1+σ3)/2, psi<br />
Wagon Fill<br />
Total Shear Strength from<br />
ICU Triaxial Compression Tests<br />
Comparison with Prior Data<br />
Project No. <strong>Chabot</strong> <strong>Dam</strong><br />
26814536 Figure<br />
Seismic <strong>Stability</strong><br />
7-26
100<br />
At maximum deviator stress<br />
80<br />
(σ1-σ3)/2, psi<br />
60<br />
40<br />
Selected for <strong>Analysis</strong><br />
(c = 200psf, φ = 21.5 o )<br />
20<br />
0<br />
0 20 40 60 80 100 120 140 160 180 200<br />
(σ1+σ3)/2, psi<br />
S&W 1965 CU Triaxial tests<br />
without pore pressure measurements<br />
C WF CL<br />
DS WF CL<br />
DS WF SC<br />
US WF CL<br />
Native<br />
Project No.<br />
26814536<br />
<strong>Chabot</strong> <strong>Dam</strong><br />
Seismic <strong>Stability</strong><br />
Wagon Fill<br />
Total Shear Strength from<br />
S&W CU Triaxial Compression Tests<br />
on Modified California Samples<br />
Figure<br />
7-27<br />
x:x_geo\chabot dam\Task G - Engineering Report\Figures\Figure 7-27.grf
Plasticity Chart<br />
60<br />
50<br />
Reference: Seed et al., 2003<br />
Zone B: Test if wc > 0.85(LL)<br />
Zone A: Potentially liquefiable if wc > 0.8(LL)<br />
Applicable for a) FC > 20% if PI > 12, or b) FC >35%, if PI < 12<br />
CH or OH<br />
"U" LINE<br />
"A" LINE<br />
Plasticity Index (PI)<br />
40<br />
30<br />
20<br />
Zone B<br />
CL or OL<br />
MH or OH<br />
12<br />
10<br />
7<br />
4<br />
Zone A<br />
CL-ML<br />
ML or OL<br />
0<br />
37 47<br />
0 10 20 30 40 50 60 70 80 90 100 110<br />
Liquid Limit (LL)<br />
Liquefiable (WC > 0.8LL)<br />
Test (WC > 0.85LL)<br />
Nonliquefiable<br />
x:x_geo\<strong>Chabot</strong> dam\Task G - Engineering Report\Figures\Figure 7-28.grf<br />
Project No. <strong>Chabot</strong> <strong>Dam</strong><br />
26814536 Figure<br />
Seismic <strong>Stability</strong><br />
Liquefaction Susceptibility Chart<br />
WI-59, 61, 62, 64, 66 and 67<br />
Wagon Fill Zone<br />
7-28
0<br />
10<br />
20<br />
30<br />
40<br />
50<br />
60<br />
70<br />
80<br />
90<br />
100<br />
0.001<br />
<strong>Dynamic</strong> <strong>Stability</strong> <strong>of</strong> <strong>Chabot</strong> <strong>Dam</strong> GRADATION OF SLUICED FILL<br />
Lake <strong>Chabot</strong> <strong>Dam</strong>, San Leandro, California<br />
IN DOWNSTREAM TOE BORINGS<br />
26814536.C0000 FIGURE 7-29<br />
PERCENT PASSING<br />
PERCENT RETAINED<br />
SIEVE_LANDSCAPE_30_PT_TABLE OAK_CHABOTDAM.GPJ 8/31/04<br />
100<br />
90<br />
80<br />
70<br />
60<br />
50<br />
40<br />
30<br />
20<br />
10<br />
COBBLES<br />
0<br />
200<br />
BORING<br />
NUMBER<br />
WI-60<br />
WI-60<br />
WI-60<br />
WI-60<br />
WI-60<br />
WI-60<br />
WI-63<br />
WI-63<br />
WI-63<br />
WI-63<br />
WI-63<br />
WI-63<br />
WI-63<br />
WI-65<br />
WI-65<br />
6" 3" 2" 1.5"<br />
100<br />
DEPTH<br />
(FT)<br />
12.5-13<br />
17-18.5<br />
22-23.5<br />
29.5-31<br />
39.5-41<br />
44.5-46<br />
10.5-12<br />
18-19.5<br />
24-24.5<br />
28-29.5<br />
35.5-37<br />
38-39.5<br />
40-42.5<br />
10-11.5<br />
17.5-19<br />
coarse fine coarse medium fine<br />
50 20<br />
5B<br />
7<br />
9<br />
12<br />
16<br />
18<br />
4<br />
7<br />
9B<br />
11<br />
14<br />
15<br />
16<br />
5<br />
8<br />
GRAVEL<br />
1<br />
SAMPLE SYMBOL<br />
NUMBER<br />
3/4" 3/8"<br />
10<br />
DESCRIPTION<br />
5 2<br />
Silty Clayey Sand with Gravel (SC-SM)<br />
Clayey Gravel with Sand (GC)<br />
Clayey Sand with Gravel (SC)<br />
Clayey Sand with Gravel (SC)<br />
Clayey Sand with Gravel (SC)<br />
Clayey Sand (SC)<br />
Clayey Sand with Gravel (SC)<br />
Clayey Sand with Gravel (SC)<br />
Clayey Sand with Gravel (SC)<br />
Clayey Sand with Gravel (SC)<br />
Clayey Sand with Gravel (SC)<br />
Clay with Sand (CH)<br />
Clayey Sand (SC)<br />
Clayey Sand (SC)<br />
Clay (CH)<br />
4<br />
U.S. STANDARD SIEVE SIZES<br />
10 16 30<br />
1<br />
SAND<br />
0.5<br />
50 100 200<br />
0.2<br />
0.1<br />
PARTICLE SIZES IN MILLIMETERS<br />
BORING<br />
NUMBER<br />
DEPTH<br />
(FT)<br />
SILT AND CLAY<br />
0.05 0.02 0.01 0.005 0.002<br />
SAMPLE<br />
NUMBER<br />
SYMBOL<br />
WI-65 22.5-24.5 10 Clay (CL)<br />
DESCRIPTION
<strong>Chabot</strong> <strong>Dam</strong> - Fines Content <strong>of</strong> Different Soil Types<br />
240<br />
220<br />
Modern Fill<br />
Sluiced Fill<br />
Wagon Fill<br />
Foundation Soil<br />
240<br />
220<br />
200<br />
200<br />
Elevation, ft<br />
180<br />
160<br />
180<br />
160<br />
140<br />
140<br />
120<br />
120<br />
100<br />
100<br />
0 20 40 60 80 100<br />
Fines Content, %<br />
Project No. 26814536<br />
<strong>Chabot</strong> <strong>Dam</strong><br />
Seismic <strong>Stability</strong><br />
Fines Content<br />
From Borings WI-60, 63 and 65<br />
Sluiced Fill Zone<br />
Figure<br />
7-30<br />
x:\x_geo\chabot dam\Task E -- <strong>Stability</strong> and Performance <strong>Analysis</strong>\Soil Characterization\FC in HF 2(new borings).grf
240<br />
<strong>Chabot</strong> <strong>Dam</strong> - Fines Content <strong>of</strong> Different Soil Types<br />
Embankment Fill<br />
Foundation Soil<br />
240<br />
220<br />
220<br />
200<br />
200<br />
Elevation, ft<br />
180<br />
160<br />
180<br />
160<br />
140<br />
140<br />
120<br />
120<br />
100<br />
100<br />
0 20 40 60 80 100<br />
Fines Content, %<br />
Project No. 26814536<br />
<strong>Chabot</strong> <strong>Dam</strong><br />
Seismic <strong>Stability</strong><br />
Fines Content<br />
From Previous Borings in Sluiced Fill Zone<br />
Figure<br />
7-31<br />
x:\x_geo\chabot dam\Task I -- DSOD meetings\plots by FS and EF\FC in HF.grf
<strong>Chabot</strong> <strong>Dam</strong> - Gravel Content <strong>of</strong> Different Soil Types<br />
240<br />
220<br />
Modern Fill<br />
Sluiced Fill<br />
Wagon Fill<br />
Foundation Soil<br />
240<br />
220<br />
200<br />
200<br />
Elevation, ft<br />
180<br />
160<br />
180<br />
160<br />
140<br />
140<br />
120<br />
120<br />
100<br />
100<br />
0 20 40 60 80 100<br />
Gravel Content, %<br />
Project No. 26814536<br />
<strong>Chabot</strong> <strong>Dam</strong><br />
Seismic <strong>Stability</strong><br />
Gravel Content<br />
From Borings WI-60, 63 and 65<br />
Sluiced Fill Zone<br />
Figure<br />
7-32<br />
x:\x_geo\chabot dam\Task E -- <strong>Stability</strong> and Performance <strong>Analysis</strong>\Soil Characterization\GC in HF 2(new borings).grf
240<br />
<strong>Chabot</strong> <strong>Dam</strong> - Gravel Content <strong>of</strong> Different Soil Types<br />
240<br />
Embankment Fill<br />
Foundation Soil<br />
220<br />
220<br />
200<br />
200<br />
Elevation, ft<br />
180<br />
160<br />
180<br />
160<br />
140<br />
140<br />
120<br />
120<br />
100<br />
100<br />
0 20 40 60 80 100<br />
Gravel Content, %<br />
Project No. 26814536<br />
<strong>Chabot</strong> <strong>Dam</strong><br />
Seismic <strong>Stability</strong><br />
Gravel Content<br />
From Previous Borings in Sluiced Fill Zone<br />
Figure<br />
7-33<br />
x:\x_geo\chabot dam\Task I -- DSOD meetings\plots by FS and EF\GC in HF.grf
60<br />
50<br />
Plasticity Chart<br />
CH or OH<br />
"U" LINE<br />
"A" LINE<br />
Plasticity Index (PI)<br />
40<br />
30<br />
20<br />
CL or OL<br />
MH or OH<br />
10<br />
CL-ML<br />
ML or OL<br />
0<br />
0 10 20 30 40 50 60 70 80 90 100 110<br />
Liquid Limit (LL)<br />
Modern Fill<br />
Sluiced Fill<br />
Foundation Soil<br />
Project No.<br />
26814536<br />
<strong>Chabot</strong> <strong>Dam</strong><br />
Seismic <strong>Stability</strong><br />
Plasticity from Borings<br />
WI-60, 63 and 65<br />
Sluiced Fill Zone<br />
Figure<br />
7-34<br />
x:x_geo\chabot dam\TaskE --<strong>Stability</strong> and Deformation <strong>Analysis</strong>\Soil Characterization\Plasticity in HF2 (new borings).grf
60<br />
50<br />
Plasticity Chart<br />
CH or OH<br />
"U" LINE<br />
"A" LINE<br />
Plasticity Index (PI)<br />
40<br />
30<br />
20<br />
CL or OL<br />
MH or OH<br />
10<br />
CL-ML<br />
ML or OL<br />
0<br />
0 10 20 30 40 50 60 70 80 90 100 110<br />
Liquid Limit (LL)<br />
Foundation Soil<br />
Embankment Fill<br />
Project No.<br />
26814536<br />
<strong>Chabot</strong> <strong>Dam</strong><br />
Seismic <strong>Stability</strong><br />
Plasticity from Previous Borings<br />
in Sluiced Fill Zone<br />
Figure<br />
7-35<br />
x:x_geo\chabot dam\Task I -- DSOD meetings\plots by FS and EF\Plasticity in HF.grf
240<br />
<strong>Chabot</strong> <strong>Dam</strong> - Dry Unit Weight <strong>of</strong> Different Soil Types<br />
Embankment Fill<br />
Foundation Soil<br />
240<br />
220<br />
220<br />
200<br />
200<br />
Elevation, ft<br />
180<br />
160<br />
180<br />
160<br />
140<br />
140<br />
120<br />
120<br />
100<br />
100<br />
0 40 80 120 160<br />
Dry Unit Weight, pcf<br />
Project No. 26814536<br />
<strong>Chabot</strong> <strong>Dam</strong><br />
Seismic <strong>Stability</strong><br />
Dry Unit Weight<br />
From Previous Borings in Sluiced Fill Zone<br />
Figure<br />
7-36<br />
x:\x_geo\chabot dam\Task I -- DSOD meetings\plots by FS and EF\DD in HF.grf
240<br />
<strong>Chabot</strong> <strong>Dam</strong> - Moisture Content <strong>of</strong> Different Soil Types<br />
240<br />
Embankment Fill<br />
Foundation Soil<br />
220<br />
220<br />
200<br />
200<br />
Elevation, ft<br />
180<br />
160<br />
180<br />
160<br />
140<br />
140<br />
120<br />
120<br />
100<br />
100<br />
0 20 40 60 80 100<br />
Moisture Content, %<br />
Project No. 26814536<br />
<strong>Chabot</strong> <strong>Dam</strong><br />
Seismic <strong>Stability</strong><br />
Moisture Content<br />
From Previous Borings in Sluiced Fill Zone<br />
Figure<br />
7-37<br />
x:\x_geo\chabot dam\Task I -- DSOD meetings\plots by FS and EF\MC in HF.grf
240<br />
220<br />
<strong>Chabot</strong> <strong>Dam</strong> - Total Unit Weight <strong>of</strong> Different Soil Types<br />
GP/GW<br />
SP/SW<br />
SM<br />
SC<br />
ML<br />
CH<br />
CL<br />
240<br />
220<br />
200<br />
200<br />
Elevation, ft<br />
180<br />
160<br />
180<br />
160<br />
140<br />
140<br />
120<br />
120<br />
100<br />
100<br />
0 40 80 120 160<br />
Total Unit Weight, pcf<br />
Project No. 26814536<br />
<strong>Chabot</strong> <strong>Dam</strong><br />
Seismic <strong>Stability</strong><br />
Total Unit Weight<br />
From Previous Borings in Sluiced Fill Zone<br />
Figure<br />
7-38<br />
x:\x_geo\chabot dam\Task E -- <strong>Stability</strong> <strong>Analysis</strong>\Soil Characterization\TD in HF.grf
0<br />
10<br />
20<br />
30<br />
40<br />
50<br />
60<br />
70<br />
80<br />
90<br />
100<br />
0.001<br />
<strong>Dynamic</strong> <strong>Stability</strong> <strong>of</strong> <strong>Chabot</strong> <strong>Dam</strong>GRADATION OF FOUNDATION SOIL<br />
Lake <strong>Chabot</strong> <strong>Dam</strong>, San Leandro, California<br />
PERCENT PASSING<br />
PERCENT RETAINED<br />
26814536.C0000 FIGURE 7-39<br />
SIEVE_LANDSCAPE_30_PT_TABLE OAK_CHABOTDAM.GPJ 9/16/04<br />
100<br />
90<br />
80<br />
70<br />
60<br />
50<br />
40<br />
30<br />
20<br />
10<br />
COBBLES<br />
0<br />
200<br />
BORING<br />
NUMBER<br />
WI-60<br />
WI-60<br />
WI-60<br />
WI-62<br />
WI-62<br />
WI-62<br />
WI-62<br />
WI-65<br />
WI-65<br />
WI-66<br />
WI-66<br />
6" 3" 2" 1.5"<br />
100<br />
DEPTH<br />
(FT)<br />
59.5-61<br />
67.5-68.5<br />
69.5-71<br />
93.5-95<br />
97.5-100<br />
100-101.5<br />
105.5-107<br />
55-56.5<br />
57.5-59<br />
39-40<br />
46-47.5<br />
coarse fine coarse medium fine<br />
50 20<br />
24<br />
27B<br />
28<br />
30<br />
31B<br />
32<br />
34<br />
23<br />
25<br />
16B<br />
18<br />
GRAVEL<br />
1<br />
SAMPLE SYMBOL<br />
NUMBER<br />
3/4" 3/8"<br />
10<br />
DESCRIPTION<br />
5 2<br />
Clayey Sand with Gravel (SC)<br />
Clayey Sand with Gravel (SC)<br />
Poorly Graded Gravel with Clay (GP-GC)<br />
Clayey Sand (SC)<br />
Silty Sand (SM)<br />
Sandy Clay (CL)<br />
Clayey Sand (SC)<br />
Clayey Sand (SC)<br />
Clayey Sand with Gravel (SC)<br />
Sandy Clay (CL)<br />
Sandy Clay (CL)<br />
4<br />
U.S. STANDARD SIEVE SIZES<br />
10 16 30<br />
1<br />
SAND<br />
0.5<br />
50 100 200<br />
0.2<br />
0.1<br />
PARTICLE SIZES IN MILLIMETERS<br />
BORING<br />
NUMBER<br />
DEPTH<br />
(FT)<br />
SILT AND CLAY<br />
0.05 0.02 0.01 0.005 0.002<br />
SAMPLE<br />
NUMBER<br />
SYMBOL<br />
DESCRIPTION
SECTIONEIGHT<br />
General <strong>Analysis</strong> Approach<br />
8. Section 8 EIGHT General <strong>Analysis</strong> Approach<br />
The general approach to assessing the seismic stability <strong>of</strong> the dam consisted <strong>of</strong> evaluating its<br />
dynamic response to the design earthquake motions, evaluating the potential for strength loss <strong>of</strong><br />
the embankment and foundation materials under the earthquake shaking, estimating the<br />
deformations likely to be induced by the earthquake, and assessing the post-earthquake stability<br />
<strong>of</strong> the dam and its overall condition after the earthquake. This general approach is known as the<br />
Seed-Lee-Idriss approach (Seed, 1979).<br />
The design earthquake was defined as the MCE on the Hayward-Rodgers Creek Fault since this<br />
earthquake is likely to generate the strongest ground motions at the site. Because the MCE on<br />
the San Andreas fault could result in strong shaking <strong>of</strong> long duration, the seismic stability <strong>of</strong> the<br />
dam was also evaluated for that earthquake. As a check <strong>of</strong> the analysis procedures, the dynamic<br />
response and deformations <strong>of</strong> the dam were also analyzed for motions representative <strong>of</strong> the 1989<br />
Loma Prieta earthquake, for which the general performance <strong>of</strong> the dam is known.<br />
Prior to the dynamic analyses, the dam’s static stability was analyzed for comparison with the<br />
known long-term stability <strong>of</strong> the dam. The static stability was analyzed for several idealized<br />
cross-sections using limit-equilibrium procedures. The results <strong>of</strong> the limit-equilibrium analyses<br />
were used to select the dam cross-section for dynamic analysis. The limit-equilibrium analyses<br />
are described in Section 9.<br />
The dynamic response, potential for strength loss, and seismic deformations <strong>of</strong> the dam were<br />
evaluated using the following two approaches:<br />
• In the first approach, the dynamic response <strong>of</strong> the dam to the earthquake motions is analyzed<br />
initially. The earthquake-induced shear stresses calculated from that analysis are then<br />
compared with the cyclic strength <strong>of</strong> the embankment and foundation materials. From this<br />
comparison, the excess pore pressures, liquefaction potential, and strength loss in the<br />
materials are evaluated. The estimated strength loss in the materials is used in limit<br />
equilibrium analyses to calculate yield accelerations <strong>of</strong> potential sliding blocks within the<br />
dam. Together with the earthquake-induced accelerations calculated from the dynamic<br />
response analyses, the yield accelerations are used to calculate deformations <strong>of</strong> the blocks.<br />
Because the dam’s dynamic response, potential for strength loss, and deformations are<br />
evaluated in separate analyses, this is referred to as a decoupled approach.<br />
• In the second approach, referred to as a coupled approach, the dam’s dynamic response,<br />
excess pore pressures and strength loss, and earthquake-induced deformations are calculated<br />
in a single analysis. The analytical procedure is based on nonlinear models capable <strong>of</strong><br />
tracking the accumulation <strong>of</strong> deformations and development <strong>of</strong> excess pore pressures in the<br />
dam with time during the earthquake.<br />
The analyses <strong>of</strong> the dam’s dynamic response in the decoupled approach are discussed in<br />
Section 10. Those analyses were performed using two-dimensional finite element procedures<br />
with the computer program QUAD4M (Hudson et al. 1994). The evaluation <strong>of</strong> liquefaction<br />
potential, excess pore pressures, and strength loss, and the seismic stability and deformation<br />
analyses are presented in Section 11. The timing <strong>of</strong> liquefaction <strong>of</strong> the sluiced fill and <strong>of</strong> the<br />
development <strong>of</strong> excess pore pressures and strength degradation in the wagon fill and foundation<br />
soils were evaluated first. The residual strength <strong>of</strong> the liquefied sluiced fill and the degraded<br />
undrained strength <strong>of</strong> the wagon fill and foundation soils were then used in slope stability<br />
analyses to calculate yield accelerations and post-earthquake stability. Seismically induced<br />
X:\X_GEO\CHABOT DAM\TASK G -- ENGINEERING REPORT\DRAFT FINAL\DYNAMIC STABILITY ANALYSIS_R4.DOC\30-AUG-05\\OAK 8-1
SECTIONEIGHT<br />
General <strong>Analysis</strong> Approach<br />
deformations <strong>of</strong> the dam were evaluated with Newmark-type procedures using the calculated<br />
yield accelerations and the results <strong>of</strong> the dynamic response analyses.<br />
The non-linear dynamic analyses <strong>of</strong> the coupled approach were carried out with the twodimensional<br />
finite difference computer code FLAC (Itasca, 2000). The analyses are presented in<br />
Section 12.<br />
X:\X_GEO\CHABOT DAM\TASK G -- ENGINEERING REPORT\DRAFT FINAL\DYNAMIC STABILITY ANALYSIS_R4.DOC\30-AUG-05\\OAK 8-2
9. Section 9 NINE Limit Equilibrium <strong>Stability</strong> Analyses<br />
SECTIONNINE<br />
Limit Equilibrium <strong>Stability</strong> Analyses<br />
9.1 ANALYTICAL PROCEDURES<br />
The static stability <strong>of</strong> the dam was analyzed using the limit-equilibrium method <strong>of</strong> slices. The<br />
computer program UTEXAS3 was used for the limit-equilibrium stability analyses. Spencer’s<br />
method, which satisfies static equilibrium for each slice and overall equilibrium <strong>of</strong> the slide<br />
mass, was used in the UTEXAS analysis.<br />
9.2 CROSS SECTIONS<br />
We performed analyses on two basic idealized cross-sections, labeled A-A’ and B-B’ in<br />
Figure 9-1. These sections are shown in Figures 9-2 and 9-3. They were developed based on the<br />
subsurface information shown in Figures 7-3 and 7-4. Modified versions <strong>of</strong> these sections were<br />
also analyzed to consider uncertainty in the geometry <strong>of</strong> some <strong>of</strong> the dam zones. A modified<br />
section A-A' is shown in Figure 9-4. This modification reflects uncertainty in the location <strong>of</strong> the<br />
boundary between the wagon fill and the sluiced fill (WF/SF boundary).<br />
Composite section A-A”, shown in Figure 9-5, was developed to evaluate the effects on dam<br />
stability <strong>of</strong> the curved stream channel downstream <strong>of</strong> the dam. In composite section A-A”, the<br />
top <strong>of</strong> the sluiced fill is obtained from District drawing No. 6948-G-1.05, which shows the<br />
topography prior to the 1980 dam modification, and the surface <strong>of</strong> the random fill is obtained<br />
from District drawing No. 6948-G-1.03.1, which shows the as-built topography after the dam<br />
modification. In addition, we assumed that the bedrock elevation remains constant and that the<br />
phreatic surface is essentially parallel to the top surface <strong>of</strong> the sluiced fill in the downstream<br />
direction. The WF/SF boundary was adopted from modified section A-A’, which is more<br />
conservative than the preferred section A-A’.<br />
9.3 MATERIAL PROPERTIES<br />
The analyses were performed for long-term static and pseudo-static loading conditions (with<br />
both pre-earthquake and post-earthquake strengths). For the long-term condition, drained<br />
strengths obtained from the effective-stress strength parameters were used for all materials. For<br />
pseudo-static loading, undrained strengths were used for all saturated soils while drained<br />
strengths were used for soils above the phreatic surface.<br />
Pseudo-static analyses were performed to evaluate the yield accelerations <strong>of</strong> potential sliding<br />
blocks within the dam for various assumed levels <strong>of</strong> undrained strength degradation induced by<br />
the earthquake shaking. Those analyses are discussed in Section 11.0. The analyses assuming<br />
no strength degradation correspond to the pre-earthquake condition and are presented in this<br />
section.<br />
The undrained strengths <strong>of</strong> the saturated wagon fill and foundation soils for the pre-earthquake<br />
condition were obtained by direct fitting <strong>of</strong> the strength envelope to the values <strong>of</strong> shear stress on<br />
the failure plane at the time <strong>of</strong> failure versus normal stress on the failure plane after consolidation<br />
(τ ff versus σ’ fc envelope). Thus, it is assumed that the undrained strength is a function <strong>of</strong> the<br />
effective normal stresses and the effective principal stress ratio (K c ) acting on the failure surface<br />
prior to seismic loading. This strength formulation was proposed by Duncan et al. (1990) and is<br />
incorporated in the UTEXAS3 program. The pre-earthquake undrained strength <strong>of</strong> the sluiced<br />
X:\X_GEO\CHABOT DAM\TASK G -- ENGINEERING REPORT\DRAFT FINAL\DYNAMIC STABILITY ANALYSIS_R4.DOC\30-AUG-05\\OAK 9-1
SECTIONNINE<br />
Limit Equilibrium <strong>Stability</strong> Analyses<br />
fill was assumed equal to the drained strength. After liquefaction, its undrained strength was<br />
assumed equal to the residual strength.<br />
The strength parameters used in the limit-equilibrium analyses are summarized in Tables 9-1 and<br />
9-2. The slope stability analyses for the post-earthquake condition and pseudo-static loading with<br />
post-earthquake strength parameters are discussed in Section 11.<br />
9.4 ANALYSIS RESULTS<br />
The analysis results for sections A-A’ and modified A-A’ are presented in Figures 9-6 through<br />
9-11. Under long-term static loading, the results for sections A-A’ and modified A-A’ are very<br />
similar. This is expected since the drained strengths <strong>of</strong> the sluiced fill and wagon fill materials<br />
are similar. As shown in Figures 9-6 and 9-7, the computed factors <strong>of</strong> safety (FS) against slope<br />
instability for deep-seated sliding surfaces are greater than 2.5 for the upstream and downstream<br />
slopes. For sliding surfaces passing through the crest and the upstream toe, the computed FS<br />
values are between 1.5 and 1.7. A relatively low FS <strong>of</strong> 1.2 is computed for a shallow sliding<br />
surface through the upstream toe. For sliding surfaces within the downstream shell, the<br />
computed FS values range between 2.2 and 2.4.<br />
For the pre-earthquake loading condition, the computed FS values for deep-seated sliding<br />
surfaces are between 2.5 and 3.0 for the upstream and downstream slopes (Figures 9-8 and 9-9).<br />
For sliding surfaces passing through the crest and the upstream toe, the computed FS values are<br />
about 2.2 (Figure 9-8). For Section A-A’ under pseudo-static loading, the computed yield<br />
acceleration coefficients (K y ) are equal to or greater than 0.35 for the downstream slope when<br />
pre-earthquake strengths are used (Figure 9-10). For the upstream slope, the computed values <strong>of</strong><br />
K y for a deep-seated sliding surface and a sliding surface through the crest and the upstream toe<br />
are 0.37 and 0.28, respectively. For modified section A-A’, the computed values <strong>of</strong> FS and K y<br />
are similar to those for Section A-A’ under pre-earthquake loading (Figure 9-11).<br />
The analysis results for Section B-B’ are presented in Figures 9-12 and 9-13. Since the static<br />
analyses showed that Section B-B’ is less critical than sections A-A’ or modified A-A’, pseudostatic<br />
analyses were not performed for Section B-B’.<br />
The analysis results for composite section A-A” are presented in Figure 9-14. As expected, the<br />
computed FS for the downstream slope under pre-earthquake conditions are generally similar to<br />
those computed for modified section A-A’. Pseudo-static analyses were not performed for<br />
Section A-A” because the yield acceleration coefficients should be similar to those computed for<br />
modified section A-A’.<br />
The analysis results indicate adequate factors <strong>of</strong> safety (1.5 or greater) in both upstream and<br />
downstream directions under long-term static conditions. This conclusion agrees well with the<br />
known long-term stability <strong>of</strong> the dam. The results also indicate that the dam should perform<br />
satisfactorily during minor earthquakes that do not trigger liquefaction <strong>of</strong> the sluiced fill or<br />
generate high pore pressures within the wagon fill. Furthermore, the analyses results indicate<br />
that Section B-B’ is less critical than Section A-A’. Accordingly, the latter was used in the<br />
dynamic analysis <strong>of</strong> the dam.<br />
X:\X_GEO\CHABOT DAM\TASK G -- ENGINEERING REPORT\DRAFT FINAL\DYNAMIC STABILITY ANALYSIS_R4.DOC\30-AUG-05\\OAK 9-2
SECTIONNINE<br />
Limit Equilibrium <strong>Stability</strong> Analyses<br />
Table 9-1<br />
UTEXAS3 Input Parameters for Static <strong>Stability</strong> <strong>Analysis</strong> - Long Term Condition<br />
Total Unit Weight<br />
Effective Strength Parameters<br />
γ t c’ φ’<br />
Material (pcf) (psf) (°)<br />
Modern Fill 134 0 35<br />
Random Fill 130 0 33<br />
Wagon Fill 133 0 30<br />
Sluiced Fill 130 0 33<br />
Foundation Soils 133 0 30<br />
Reservoir Silt 90 200 0<br />
Table 9-2<br />
UTEXAS3 Input Parameters for Seismic <strong>Stability</strong> <strong>Analysis</strong> - Pre-Earthquake Condition<br />
Total Unit<br />
Weight<br />
Undrained Strength<br />
Envelope<br />
(K c = 1) (1) Effective Strength<br />
Parameters<br />
γ t d R Ψ R c’ φ’<br />
Material (pcf) (psf) (°) (psf) (°)<br />
Modern Fill 134 - - 0 35<br />
Random Fill 130 - - 0 33<br />
Wagon Fill 133 1075 22.6 0 30<br />
Sluiced Fill 130 - - 0 33<br />
Foundation Soils 133 1075 22.6 0 30<br />
Reservoir Silt 90 - - 200 0<br />
Note:<br />
(1) K c = Consolidation principal stress ratio<br />
X:\X_GEO\CHABOT DAM\TASK G -- ENGINEERING REPORT\DRAFT FINAL\DYNAMIC STABILITY ANALYSIS_R4.DOC\30-AUG-05\\OAK 9-3
1 inch equals 100 feet<br />
Feet<br />
0 50 100 200<br />
WI-45<br />
WI-43<br />
Stream Channel<br />
WI-49<br />
WI-50<br />
WI-44A<br />
130<br />
WI-41<br />
SPILLWAY<br />
140<br />
WI-42<br />
WI-53<br />
WI-16<br />
WI-58<br />
C'<br />
150<br />
205<br />
195<br />
185<br />
175<br />
165<br />
155<br />
145<br />
235<br />
225<br />
215<br />
WI-17<br />
WI-57<br />
BPT-3<br />
WI-23<br />
WI-47<br />
WI-54<br />
WI-13<br />
WI-51<br />
WI-48<br />
WI-9<br />
WI-19<br />
WI-65<br />
WI-39<br />
160<br />
WI-22<br />
WI-63<br />
A'<br />
135<br />
C<br />
WI-55<br />
125<br />
WI-38<br />
WI-3<br />
WI-60<br />
WI-2<br />
170<br />
WI-61<br />
115<br />
WI-37<br />
WI-32<br />
180<br />
B'<br />
WI-67<br />
A<br />
WI-29<br />
WI-4<br />
190<br />
115<br />
WI-5<br />
WI-28<br />
125<br />
WI-64<br />
WI-44* WI-62<br />
WI-33 WI-21<br />
WI-34 WI-42* WI-26<br />
WI-46*<br />
WI-41*<br />
WI-43* WI-35<br />
WI-10<br />
WI-59<br />
WI-11<br />
WI-56<br />
WI-14<br />
WELL#3<br />
BPT-2<br />
WI-52<br />
WI-20<br />
BPT-1<br />
WI-15<br />
WELL#1<br />
WI-45*<br />
WELL#4<br />
WI-18<br />
WI-27<br />
WI-40<br />
135<br />
200<br />
WI-66<br />
WI-6<br />
WI-36<br />
WI-12<br />
210<br />
B<br />
WI-31<br />
WI-7<br />
WELL#5<br />
WI-25<br />
WI-30<br />
WI-24<br />
220<br />
250<br />
175<br />
185<br />
240<br />
145<br />
195<br />
155<br />
165<br />
215<br />
225<br />
230<br />
235<br />
245<br />
205<br />
255<br />
220<br />
175<br />
180<br />
215<br />
230<br />
240<br />
190<br />
200<br />
250<br />
210<br />
Legend<br />
Borings shown on Section A-A'<br />
Borings shown on Section B-B'<br />
Borings shown on Section C-C'<br />
Other borings, not shown<br />
on sections<br />
Piezometer<br />
Current ground surface contours (ft)<br />
Pre-dam ground surface contours (ft)<br />
URS Corporation L:\Projects\<strong>Chabot</strong>_<strong>Dam</strong>_26814536\MXD\Current Working Documents\081904\Cross-section data with xsec members plus remainder.mxd Date: 9/13/2004 5:19:30 PM Name: dhwrigh0<br />
<strong>Chabot</strong> <strong>Dam</strong><br />
Seismic <strong>Stability</strong><br />
26814536<br />
Plan View <strong>of</strong> <strong>Dam</strong> and<br />
<strong>Analysis</strong> Cross-sections<br />
Figure<br />
9-1
300<br />
250<br />
Spillway Crest EL. 227.25 ft.<br />
Elevation, Feet (MSL)<br />
200<br />
150<br />
100<br />
RESERVOIR SILT<br />
FOUNDATION SOIL<br />
WAGON FILL<br />
UPSTREAM<br />
WAGON FILL<br />
CORE<br />
BEDROCK<br />
WAGON FILL<br />
DOWNSTREAM<br />
FOUNDATION SOIL<br />
SLUICED FILL<br />
RANDOM FILL<br />
50<br />
0<br />
-300 -200 -100 0 100 200 300 400 500<br />
Offset from Centerline, Feet<br />
Project No.<br />
<strong>Chabot</strong> <strong>Dam</strong><br />
26814536 Seismic <strong>Stability</strong> <strong>Analysis</strong> Idealized Cross Section A-A'<br />
for <strong>Stability</strong> <strong>Analysis</strong><br />
Figure<br />
9-2<br />
X:\x_geo\<strong>Chabot</strong> <strong>Dam</strong>\Task G - Engineering Report\Figures\Figure 9-2.grf
300<br />
250<br />
Spillway Crest EL. 227.25 ft.<br />
MODERN FILL<br />
Elevation, Feet (MSL)<br />
200<br />
150<br />
100<br />
RESERVOIR SILT<br />
WAGON FILL<br />
UPSTREAM<br />
FOUNDATION SOIL<br />
WAGON FILL<br />
CORE<br />
BEDROCK<br />
WAGON FILL<br />
DOWNSTREAM<br />
FOUNDATION SOIL<br />
SLUICED FILL<br />
50<br />
0<br />
-300 -200 -100 0 100 200 300 400 500<br />
Offset from Centerline, Feet<br />
Project No.<br />
<strong>Chabot</strong> <strong>Dam</strong><br />
26814536 Seismic <strong>Stability</strong> <strong>Analysis</strong> Idealized Cross Section B-B'<br />
for <strong>Stability</strong> <strong>Analysis</strong><br />
Figure<br />
9-3<br />
X:\x_geo\<strong>Chabot</strong> <strong>Dam</strong>\Task G - Engineering Report\Figures\Figure 9-3.grf
300<br />
250<br />
Spillway Crest EL. 227.25 ft.<br />
MODERN FILL<br />
Elevation, Feet (MSL)<br />
200<br />
150<br />
100<br />
RESERVOIR SILT<br />
WAGON FILL<br />
UPSTREAM<br />
FOUNDATION SOIL<br />
WAGON FILL<br />
CORE<br />
BEDROCK<br />
WAGON FILL<br />
DOWNSTREAM<br />
FOUNDATION SOIL<br />
SLUICED FILL<br />
RANDOM FILL<br />
50<br />
0<br />
-300 -200 -100 0 100 200 300 400 500<br />
Offset from Centerline, Feet<br />
Project No.<br />
<strong>Chabot</strong> <strong>Dam</strong><br />
26814536 Seismic <strong>Stability</strong> <strong>Analysis</strong> Modified Cross Section A - A'<br />
for <strong>Stability</strong> <strong>Analysis</strong><br />
Figure<br />
9-4<br />
X:\x_geo\<strong>Chabot</strong> <strong>Dam</strong>\Task G - Engineering Report\Figures\Figure 9-4.grf
300<br />
250<br />
Spillway Crest EL. 227.25 ft.<br />
Elevation, Feet (MSL)<br />
200<br />
150<br />
100<br />
RESERVOIR SILT<br />
WAGON FILL<br />
UPSTREAM<br />
FOUNDATION SOIL<br />
WAGON FILL<br />
CORE<br />
BEDROCK<br />
MODERN FILL<br />
WAGON FILL<br />
DOWNSTREAM<br />
FOUNDATION SOIL<br />
SLUICED FILL<br />
RANDOM FILL<br />
50<br />
0<br />
-300 -200 -100 0 100 200 300 400 500 600 700<br />
Offset from Centerline, Feet<br />
Project No.<br />
26814536<br />
<strong>Chabot</strong> <strong>Dam</strong><br />
Seismic <strong>Stability</strong> <strong>Analysis</strong><br />
Composite<br />
Downstream Section A - A"<br />
for <strong>Stability</strong> <strong>Analysis</strong><br />
Figure<br />
9-5<br />
X:\x_geo\<strong>Chabot</strong> <strong>Dam</strong>\Task G - Engineering Report\Figures\Figure 9-5.grf
300<br />
250<br />
Spillway Crest EL. 227.25 ft.<br />
Elevation, Feet (MSL)<br />
200<br />
150<br />
100<br />
RESERVOIR SILT<br />
FS = 1.22<br />
FOUNDATION SOIL<br />
WAGON FILL<br />
UPSTREAM<br />
FS = 2.86<br />
FS = 1.52<br />
FS = 1.69<br />
WAGON FILL<br />
CORE<br />
BEDROCK<br />
FS = 2.21<br />
WAGON FILL<br />
DOWNSTREAM<br />
FS = 2.27<br />
FS = 2.38<br />
FS = 2.62<br />
FOUNDATION SOIL<br />
SLUICED FILL<br />
RANDOM FILL<br />
50<br />
0<br />
-300 -200 -100 0 100 200 300 400 500<br />
Offset from Centerline, Feet<br />
Project No.<br />
26814536<br />
<strong>Chabot</strong> <strong>Dam</strong><br />
Seismic <strong>Stability</strong> <strong>Analysis</strong><br />
Static <strong>Stability</strong> <strong>Analysis</strong><br />
Long-Term Condition<br />
Cross Section A-A'<br />
Figure<br />
9-6<br />
X:\x_geo\<strong>Chabot</strong> <strong>Dam</strong>\Task G - Engineering Report\Figures\Figure 9-6.grf
300<br />
250<br />
Spillway Crest EL. 227.25 ft.<br />
FS = 2.21<br />
MODERN FILL<br />
Elevation, Feet (MSL)<br />
200<br />
150<br />
100<br />
RESERVOIR SILT<br />
WAGON FILL<br />
UPSTREAM<br />
FOUNDATION SOIL<br />
WAGON FILL<br />
CORE<br />
BEDROCK<br />
WAGON FILL<br />
DOWNSTREAM<br />
FS = 2.30<br />
FS = 2.61<br />
FS = 2.39<br />
FOUNDATION SOIL<br />
FS = 2.56<br />
SLUICED FILL<br />
RANDOM FILL<br />
50<br />
0<br />
-300 -200 -100 0 100 200 300 400 500<br />
Offset from Centerline, Feet<br />
Project No.<br />
26814536<br />
<strong>Chabot</strong> <strong>Dam</strong><br />
Seismic <strong>Stability</strong> <strong>Analysis</strong><br />
Static <strong>Stability</strong> <strong>Analysis</strong><br />
Long-Term Condition<br />
Modified Cross Section A - A'<br />
Figure<br />
9-7<br />
X:\x_geo\<strong>Chabot</strong> <strong>Dam</strong>\Task G - Engineering Report\Figures\Figure 9-7.grf
300<br />
250<br />
Spillway Crest EL. 227.25 ft.<br />
Elevation, Feet (MSL)<br />
200<br />
150<br />
100<br />
RESERVOIR SILT<br />
FOUNDATION SOIL<br />
WAGON FILL<br />
UPSTREAM<br />
FS = 2.98<br />
FS = 2.20<br />
FS = 2.17<br />
WAGON FILL<br />
CORE<br />
BEDROCK<br />
FS = 2.97<br />
WAGON FILL<br />
DOWNSTREAM<br />
FS = 2.56<br />
FOUNDATION SOIL<br />
FS = 5.20<br />
FS = 2.45<br />
SLUICED FILL<br />
RANDOM FILL<br />
50<br />
0<br />
-300 -200 -100 0 100 200 300 400 500<br />
Offset from Centerline, Feet<br />
Project No.<br />
26814536<br />
<strong>Chabot</strong> <strong>Dam</strong><br />
Seismic <strong>Stability</strong> <strong>Analysis</strong><br />
Seismic <strong>Stability</strong> <strong>Analysis</strong><br />
Pre-Earthquake Condition<br />
Cross Section A-A'<br />
Figure<br />
9-8<br />
X:\x_geo\<strong>Chabot</strong> <strong>Dam</strong>\Task G - Engineering Report\Figures\Figure 9-8.grf
300<br />
250<br />
Spillway Crest EL. 227.25 ft.<br />
FS = 2.21<br />
MODERN FILL<br />
Elevation, Feet (MSL)<br />
200<br />
150<br />
100<br />
RESERVOIR SILT<br />
WAGON FILL<br />
UPSTREAM<br />
FOUNDATION SOIL<br />
WAGON FILL<br />
CORE<br />
BEDROCK<br />
WAGON FILL<br />
DOWNSTREAM<br />
FS = 2.30<br />
FS = 2.43<br />
FS = 2.58<br />
FOUNDATION SOIL<br />
FS = 2.53<br />
SLUICED FILL<br />
RANDOM FILL<br />
50<br />
0<br />
-300 -200 -100 0 100 200 300 400 500<br />
Offset from Centerline, Feet<br />
Project No.<br />
26814536<br />
<strong>Chabot</strong> <strong>Dam</strong><br />
Seismic <strong>Stability</strong> <strong>Analysis</strong><br />
Seismic <strong>Stability</strong> <strong>Analysis</strong><br />
Pre-Earthquake Condition<br />
Modified Cross Section A - A'<br />
Figure<br />
9-9<br />
X:\x_geo\<strong>Chabot</strong> <strong>Dam</strong>\Task G - Engineering Report\Figures\Figure 9-9.grf
300<br />
250<br />
Spillway Crest EL. 227.25 ft.<br />
Elevation, Feet (MSL)<br />
200<br />
150<br />
100<br />
RESERVOIR SILT<br />
FOUNDATION SOIL<br />
FS = 2.20<br />
Ky = 0.29<br />
WAGON FILL<br />
UPSTREAM<br />
FS = 2.98<br />
Ky = 0.37<br />
FS = 2.17<br />
Ky = 0.28<br />
WAGON FILL<br />
CORE<br />
BEDROCK<br />
FS = 2.97<br />
Ky = 0.39<br />
WAGON FILL<br />
DOWNSTREAM<br />
FS = 2.56<br />
Ky = 0.40<br />
FOUNDATION SOIL<br />
FS = 5.20<br />
Ky = 0.50+<br />
FS = 2.45<br />
Ky = 0.37<br />
SLUICED FILL<br />
RANDOM FILL<br />
50<br />
0<br />
-300 -200 -100 0 100 200 300 400 500<br />
Offset from Centerline, Feet<br />
Project No.<br />
26814536<br />
<strong>Chabot</strong> <strong>Dam</strong><br />
Seismic <strong>Stability</strong> <strong>Analysis</strong><br />
Seismic <strong>Stability</strong> <strong>Analysis</strong><br />
Pseudo-Static Loading<br />
(Pre-Earthquake Strengths)<br />
Cross Section A-A'<br />
Figure<br />
9-10<br />
X:\x_geo\<strong>Chabot</strong> <strong>Dam</strong>\Task G - Engineering Report\Figures\Figure 9-10.grf
300<br />
250<br />
Spillway Crest EL. 227.25 ft.<br />
FS = 2.21<br />
Ky = 0.32<br />
MODERN FILL<br />
Elevation, Feet (MSL)<br />
200<br />
150<br />
100<br />
RESERVOIR SILT<br />
WAGON FILL<br />
UPSTREAM<br />
FOUNDATION SOIL<br />
WAGON FILL<br />
CORE<br />
BEDROCK<br />
WAGON FILL<br />
DOWNSTREAM<br />
FS = 2.30<br />
Ky = 0.31<br />
FS = 2.43<br />
Ky = 0.37<br />
FOUNDATION SOIL<br />
FS = 2.53<br />
Ky = 0.40<br />
SLUICED FILL<br />
RANDOM FILL<br />
FS = 2.58<br />
Ky = 0.40<br />
50<br />
0<br />
-300 -200 -100 0 100 200 300 400 500<br />
Offset from Centerline, Feet<br />
Project No.<br />
26814536<br />
<strong>Chabot</strong> <strong>Dam</strong><br />
Seismic <strong>Stability</strong> <strong>Analysis</strong><br />
Seismic <strong>Stability</strong> <strong>Analysis</strong><br />
Pseudo-Static Loading<br />
(Pre-Earthquake Strengths)<br />
Modified Cross Section A - A'<br />
Figure<br />
9-11<br />
X:\x_geo\<strong>Chabot</strong> <strong>Dam</strong>\Task G - Engineering Report\Figures\Figure 9-11.grf
300<br />
250<br />
Spillway Crest EL. 227.25 ft.<br />
MODERN FILL<br />
FS = 2.32<br />
FS = 1.16<br />
Elevation, Feet (MSL)<br />
200<br />
150<br />
100<br />
RESERVOIR SILT<br />
FS = 1.83<br />
FS = 2.65<br />
FS = 1.62<br />
WAGON FILL<br />
UPSTREAM<br />
FOUNDATION SOIL<br />
FS = 1.51<br />
WAGON FILL<br />
CORE<br />
BEDROCK<br />
WAGON FILL<br />
DOWNSTREAM<br />
FS = 3.52<br />
FS = 2.36<br />
FOUNDATION SOIL<br />
FS = 3.02<br />
SLUICED FILL<br />
50<br />
0<br />
-300 -200 -100 0 100 200 300 400 500<br />
Offset from Centerline, Feet<br />
Project No.<br />
26814536<br />
<strong>Chabot</strong> <strong>Dam</strong><br />
Seismic <strong>Stability</strong> <strong>Analysis</strong><br />
Static <strong>Stability</strong> <strong>Analysis</strong><br />
Long-Term Condition<br />
Cross Section B-B'<br />
Figure<br />
9-12<br />
X:\x_geo\<strong>Chabot</strong> <strong>Dam</strong>\Task G - Engineering Report\Figures\Figure 9-12.grf
300<br />
250<br />
Spillway Crest EL. 227.25 ft.<br />
MODERN FILL<br />
FS = 2.32<br />
FS = 5.99<br />
Elevation, Feet (MSL)<br />
200<br />
150<br />
100<br />
RESERVOIR SILT<br />
FS = 2.65<br />
FS = 2.87<br />
FS = 2.25<br />
WAGON FILL<br />
UPSTREAM<br />
FOUNDATION SOIL<br />
FS = 2.11<br />
WAGON FILL<br />
CORE<br />
BEDROCK<br />
WAGON FILL<br />
DOWNSTREAM<br />
FS = 3.37<br />
FS = 2.36<br />
FOUNDATION SOIL<br />
FS = 2.99<br />
SLUICED FILL<br />
50<br />
0<br />
-300 -200 -100 0 100 200 300 400 500<br />
Offset from Centerline, Feet<br />
Project No.<br />
26814536<br />
<strong>Chabot</strong> <strong>Dam</strong><br />
Seismic <strong>Stability</strong> <strong>Analysis</strong><br />
Seismic <strong>Stability</strong> <strong>Analysis</strong><br />
Pre-Earthquake Condition<br />
Cross Section B-B'<br />
Figure<br />
9-13<br />
X:\x_geo\<strong>Chabot</strong> <strong>Dam</strong>\Task G - Engineering Report\Figures\Figure 9-13.grf
300<br />
250<br />
Spillway Crest EL. 227.25 ft.<br />
Elevation, Feet (MSL)<br />
200<br />
150<br />
100<br />
RESERVOIR SILT<br />
WAGON FILL<br />
UPSTREAM<br />
FOUNDATION SOIL<br />
WAGON FILL<br />
CORE<br />
BEDROCK<br />
MODERN FILL<br />
FS = 2.30<br />
FS = 2.44<br />
WAGON FILL<br />
DOWNSTREAM<br />
FS = 2.42<br />
FOUNDATION SOIL<br />
SLUICED FILL<br />
FS = 2.50<br />
FS = 2.54<br />
FS = 6.62<br />
RANDOM FILL<br />
50<br />
0<br />
-300 -200 -100 0 100 200 300 400 500 600 700<br />
Offset from Centerline, Feet<br />
Project No.<br />
26814536<br />
<strong>Chabot</strong> <strong>Dam</strong><br />
Seismic <strong>Stability</strong> <strong>Analysis</strong><br />
Seismic Stabilty <strong>Analysis</strong><br />
Pre-Earthquake Condition<br />
Downstream Section A - A"<br />
Figure<br />
9-14<br />
X:\x_geo\<strong>Chabot</strong> <strong>Dam</strong>\Task G - Engineering Report\Figures\Figure 9-14.grf
10. Section 10 TEN <strong>Dynamic</strong> Response Analyses<br />
SECTIONTEN<br />
<strong>Dynamic</strong> Response Analyses<br />
10.1 METHODOLOGY<br />
Two-dimensional dynamic response analyses were performed to estimate the stresses and<br />
accelerations induced by the design earthquake within the dam. The results <strong>of</strong> the analyses were<br />
used to evaluate the liquefaction potential in the sluiced fill and the potential for strength loss in<br />
the wagon fill and foundation soils. The results were also used to evaluate the earthquakeinduced<br />
average mass accelerations <strong>of</strong> selected potential sliding blocks within the dam. Together<br />
with the yield accelerations obtained from the limit equilibrium analyses, the average mass<br />
accelerations were used to calculate seismic displacements <strong>of</strong> the sliding blocks using a<br />
Newmark-type deformation analysis.<br />
The computer program QUAD4M was used for the dynamic response analyses. QUAD4M<br />
(Hudson et al. 1994) is a dynamic, time-domain, equivalent-linear, two-dimensional, finite<br />
element program. The dynamic stress-strain behavior <strong>of</strong> the materials is assumed to be<br />
viscoelastic. The elastic modulus and viscous damping <strong>of</strong> the materials are calculated iteratively<br />
until they are compatible with the computed shear strains.<br />
The dynamic response analyses were performed on idealized Section A-A’, which corresponds<br />
to the maximum section <strong>of</strong> the dam. This section was shown to be the most critical section <strong>of</strong> the<br />
planar sections studied in the static and pseudo-static analyses. This section was also judged to<br />
be the most representative for assessing the seismic deformations <strong>of</strong> the dam. The section was<br />
discretized using the finite element mesh shown in Figure 10-1. A transmitting boundary was<br />
specified along the base <strong>of</strong> the model to simulate the unbounded extent <strong>of</strong> the foundation<br />
bedrock beneath the dam. The mesh was extended in the upstream and downstream directions to<br />
minimize the effects <strong>of</strong> side boundary reflections on the dam response, and “horizontal roller”<br />
supports were specified for the side boundaries to allow free movement in the horizontal<br />
direction. The calculated site response near the boundaries was compared with the free-field<br />
response computed with computer program SHAKE (Schnabel et al, 1972), to confirm that the<br />
boundary effects are small.<br />
The analyses were performed for the Hayward-Rodgers Creek and San Andreas fault MCEs<br />
using the time histories developed to represent those earthquakes. The acceleration, velocity,<br />
and displacement time histories for those earthquakes are presented in Figures 6-12, 6-13 and<br />
6-15. The acceleration time histories were input so that they would represent bedrock outcrop<br />
motions in the upstream-downstream direction.<br />
The response <strong>of</strong> the dam was also analyzed for the estimated motions during the 1989 Loma<br />
Prieta earthquake. Based on the ground motion records obtained during that earthquake, the<br />
motions recorded at the California State University at Hayward Stadium were assumed to be<br />
reasonably representative <strong>of</strong> the motions that occurred at the dam site during the earthquake.<br />
The time history used in the analyses to represent the earthquake motions is shown in<br />
Figure 10-2. The calculated performance was compared against the known performance <strong>of</strong> the<br />
dam during that earthquake as a check <strong>of</strong> the analysis procedures and models.<br />
A rough check on the analysis models was also made by analyzing the response <strong>of</strong> the dam to the<br />
ground motions expected to have occurred at the site during the 1906 San Francisco earthquake.<br />
This check confirmed that the analysis model is reasonable. However, it does not constitute a<br />
robust check because there is major uncertainty regarding the ground motions at the site during<br />
X:\X_GEO\CHABOT DAM\TASK G -- ENGINEERING REPORT\DRAFT FINAL\DYNAMIC STABILITY ANALYSIS_R4.DOC\30-AUG-05\\OAK 10-1
SECTIONTEN<br />
<strong>Dynamic</strong> Response Analyses<br />
that earthquake, and because <strong>of</strong> changes in the dam configuration after the earthquake.<br />
Therefore, those results are not presented herein.<br />
10.2 DYNAMIC MATERIAL PROPERTIES<br />
Table 1 summarizes the material properties used in the QUAD4M analyses. These parameters<br />
include total unit weight (γ), maximum shear modulus (G max ), Poisson’s ratio (ν), and the<br />
modulus reduction (G/ G max ) and damping ratio (λ) relationships with shear strain. The<br />
maximum shear modulus <strong>of</strong> the materials was obtained from their shear wave velocity. The<br />
shear wave velocities throughout the dam were expressed as a function <strong>of</strong> the mean effective<br />
stress as shown in Table 10-1. These expressions were derived from measured shear wave<br />
velocities at the dam. The mean effective stresses were obtained from a static stress analysis <strong>of</strong><br />
the dam performed using the computer program FLAC. The FLAC analyses are discussed in<br />
Section 12.<br />
10.2.1 Shear Wave Velocities<br />
Down-hole geophysical surveys were performed in several borings drilled for this investigation.<br />
The measured seismic wave velocities are shown in Figures 10-3 through 10-6. The figures also<br />
show the values <strong>of</strong> Poisson’s ratio calculated from the measured shear and compression<br />
velocities (V s and V p ) using the following equation:<br />
ν = (3٠K-2٠G) / (6٠K+2٠G),<br />
where: G = shear modulus, and K = bulk modulus. The shear and bulk moduli are obtained<br />
from:<br />
G = γ٠V 2 s /g<br />
K = γ٠V 2 p /g – 2٠G<br />
Figure 10-3 shows that, on the average, the shear wave velocity in the central wagon fill<br />
increases gradually with depth from about 900 fps at Elevation 230 to about 1500 fps at the<br />
bottom <strong>of</strong> the fill. Similar trends are observed in the measurements made in the downstream<br />
wagon fill and were used to develop a model <strong>of</strong> the seismic shear wave velocities <strong>of</strong> those<br />
materials.<br />
Figure 10-6 shows the seismic velocities measured in boring WI-60 through the sluiced fill. The<br />
figure shows that the shear wave velocity <strong>of</strong> the materials increases gradually with depth from<br />
about 500 fps near the surface to 1000 fps at the bottom <strong>of</strong> the fill.<br />
The seismic surveys also indicate that the shear wave velocity <strong>of</strong> the rock immediately below the<br />
dam ranges between about 1,500 and 5,000 fps. A representative average value <strong>of</strong> 2,700 fps was<br />
assigned to the bedrock. Similarly, average shear wave velocities <strong>of</strong> 1,200 and 1,300 fps were<br />
assigned to the modern fill and the foundation soils, respectively.<br />
10.2.2 Modulus Reduction and <strong>Dam</strong>ping Relationships<br />
The average modulus reduction relationship for sands proposed by Seed and Idriss (1970) was<br />
used to represent the variation in normalized shear modulus (G/G max ) with effective shear strain.<br />
This relationship was selected based on the characteristics <strong>of</strong> the materials, the results <strong>of</strong> cyclic<br />
X:\X_GEO\CHABOT DAM\TASK G -- ENGINEERING REPORT\DRAFT FINAL\DYNAMIC STABILITY ANALYSIS_R4.DOC\30-AUG-05\\OAK 10-2
SECTIONTEN<br />
<strong>Dynamic</strong> Response Analyses<br />
triaxial and resonant column tests performed by Woodward-Clyde (1977), and on past<br />
experience with similar materials. It is also the same relationship used by Woodward-Clyde for<br />
their dynamic response analyses <strong>of</strong> the dam.<br />
The lower bound damping curve for sands (Seed and Idriss, 1970) was selected for the<br />
embankment and foundation soils. In our experience, this relationship is suitable for many<br />
compacted, silty and clayey sand materials. The rock was assigned a constant shear modulus<br />
(G/G max = 1) and a constant damping ratio <strong>of</strong> 0.5 percent.<br />
10.3 ANALYSIS RESULTS<br />
The results <strong>of</strong> the QUAD4M analyses are presented in terms <strong>of</strong>: a) time histories <strong>of</strong> shear stress<br />
at the elements shown in Figure 10-7, b) acceleration outputs for the nodal points shown in<br />
Figure 10-8, and c) time histories <strong>of</strong> average mass acceleration for the sliding blocks shown in<br />
Figure 10-9. In addition, peak horizontal shear stresses were output throughout the model.<br />
Those shear stresses were used to calculate the earthquake-induced cyclic stress ratio (CSR) in<br />
the embankment and foundation materials. CSR is defined as the ratio <strong>of</strong> the average cyclic<br />
shear stress to the initial effective overburden stress.<br />
CSR = τ ave / σ vo ’ = 0.65٠τ peak / σ vo ’<br />
where: τ ave = average cyclic shear stress<br />
τ peak = peak shear stress<br />
σ vo ’ = effective overburden stress.<br />
These stress ratios were compared with the cyclic strength <strong>of</strong> the wagon fill and sluiced fill to<br />
evaluate the potential for liquefaction and strength loss <strong>of</strong> those materials, as will be discussed in<br />
Section 11.<br />
The dynamic response analysis results are presented in Figures 10-10 through 10-24. The results<br />
<strong>of</strong> the analyses for the Loma Prieta earthquake are presented first, followed by the results for the<br />
Hayward and San Andreas events.<br />
10.3.1 1989 Loma Prieta Earthquake<br />
The analysis results for the 1989 Loma Prieta Earthquake are presented in Figures 10-10 through<br />
10-14. Figure 10-10 shows the calculated peak accelerations at the selected points within the<br />
dam during the earthquake. The calculated peak acceleration at the crest <strong>of</strong> the dam is<br />
approximately 0.22g. The calculated cyclic stress ratios (CSR) are shown in Figure 10-11.<br />
Figures 10-12 through 10-14 show the time histories <strong>of</strong> average mass acceleration for the sliding<br />
blocks shown in Figure 10-9.<br />
10.3.2 Hayward-Rogers Creek Fault MCE<br />
Two time histories were developed to represent the design ground motions for the Hayward–<br />
Rogers Creek fault MCE (Section 6.0) and were used in the dynamic response analyses. The<br />
analyses results indicated that time history No. 1 induced a slightly stronger dam response than<br />
time history No. 2. Accordingly, only the results for time history No. 1 are presented herein.<br />
The analysis results for the Hayward event are presented in Figures 10-15 through 10-21.<br />
X:\X_GEO\CHABOT DAM\TASK G -- ENGINEERING REPORT\DRAFT FINAL\DYNAMIC STABILITY ANALYSIS_R4.DOC\30-AUG-05\\OAK 10-3
SECTIONTEN<br />
<strong>Dynamic</strong> Response Analyses<br />
As shown in Figure 10-15, the calculated peak acceleration at the crest is 1.15g. Figures 10-16<br />
and 10-17 show acceleration time histories at nodal points below the crest (see Figure 10-8 for<br />
locations), and illustrate how the ground motions propagate upward through the structure.<br />
Figure 10-18 shows contours <strong>of</strong> peak shear stress induced within the dam. Figures 10-19 and<br />
10-20 show shear stress time histories within elements below the crest (see Figure 10-7 for<br />
locations). The calculated shear stresses generally correspond to a few cycles <strong>of</strong> high amplitude<br />
shear stress. As shown in Figure 10-18, near the center and base <strong>of</strong> the dam, the amplitude <strong>of</strong> the<br />
stresses exceeds the static undrained strength <strong>of</strong> the materials, which is a limitation <strong>of</strong><br />
equivalent-linear methods <strong>of</strong> dynamic response analysis.<br />
Figure 10-21 shows contours <strong>of</strong> cyclic stress ratio calculated from the peak shear stresses shown<br />
in Figure 10-18. The time histories <strong>of</strong> average mass acceleration for the selected sliding blocks<br />
used in the Newmark-type deformation analyses are shown in Section 11.<br />
10.3.3 San Andreas Fault MCE<br />
The analysis results for the San Andreas Fault MCE are illustrated in Figures 10-22 through 24.<br />
As shown in these figures, this earthquake induces a dynamic response <strong>of</strong> the dam lower than<br />
that calculated for the Hayward Fault MCE. The calculated dam accelerations, shear stresses,<br />
and cyclic stress ratios for the San Andreas event are significantly lower than those calculated for<br />
the Hayward event. Thus, the analyses indicate that the San Andreas Fault MCE is a less critical<br />
event than the Hayward Fault MCE regarding the seismic stability <strong>of</strong> the dam. The time histories<br />
<strong>of</strong> average mass acceleration for the selected sliding blocks are shown in Section 11.<br />
X:\X_GEO\CHABOT DAM\TASK G -- ENGINEERING REPORT\DRAFT FINAL\DYNAMIC STABILITY ANALYSIS_R4.DOC\30-AUG-05\\OAK 10-4
SECTIONTEN<br />
<strong>Dynamic</strong> Response Analyses<br />
Table 10-1<br />
Material Parameters for <strong>Dynamic</strong> Response <strong>Analysis</strong><br />
γ t<br />
V s<br />
Poisson’s Modulus<br />
Material (pcf) (fps)<br />
Ratio (1) Reduction <strong>Dam</strong>ping<br />
Modern Fill 134 1,200 0.36 Sands, Ave (3) Sands, L/B (3)<br />
Random Fill 130<br />
Wagon Fill (D/S<br />
and U/S)<br />
133<br />
Wagon Fill (Core) 133<br />
Sluiced Fill 130<br />
695٠(σ m ’) 0.38<br />
and > 500 (2) 0.36 Sands, Ave Sands, L/B<br />
650٠(σ m ’) 0.43<br />
and > 1,000<br />
600٠(σ m ’) 0.43<br />
and > 900<br />
695٠(σ m ’) 0.38<br />
and > 500<br />
0.37, 0.45 Sands, Ave Sands, L/B<br />
0.4, 0.45 Sands, Ave Sands, L/B<br />
0.36, 0.48 Sands, Ave Sands, L/B<br />
Foundation Soils 133 1,300 0.46 Sands, Ave Sands, L/B<br />
Bedrock 140 2,700 0.42 - -<br />
Note:<br />
1. Dual values correspond to materials above and below the phreatic line, where applicable.<br />
2. Mean effective stress, σ m ’, in ksf.<br />
3. Seed and Idriss, 1970<br />
X:\X_GEO\CHABOT DAM\TASK G -- ENGINEERING REPORT\DRAFT FINAL\DYNAMIC STABILITY ANALYSIS_R4.DOC\30-AUG-05\\OAK 10-5
Material Types:<br />
Elevation, Feet (MSL)<br />
300<br />
250<br />
200<br />
150<br />
100<br />
50<br />
1. Bedrock<br />
2. Foundation Soil<br />
3. Wagon Fill - Core<br />
4. Wagon Fill - Shell<br />
5. Sluiced Fill<br />
6. Modern Fill<br />
7. Random Fill<br />
4<br />
3<br />
6<br />
4 5<br />
2 2<br />
1<br />
7<br />
0<br />
-500 -400 -300 -200 -100 0 100 200 300 400 500<br />
Offset from Centerline, Feet<br />
Project No.<br />
<strong>Chabot</strong> <strong>Dam</strong><br />
26814536 Seismic <strong>Stability</strong> <strong>Analysis</strong> Finite Element/Difference Mesh<br />
Cross Section A - A'<br />
Figure<br />
10-1<br />
X:\x_geo\<strong>Chabot</strong> <strong>Dam</strong>\Task G - Engineering Report\Figures\Figure 10-1.grf
Displacement (cm)<br />
8<br />
4<br />
0<br />
-4<br />
-8<br />
0 10 20 30 40<br />
Time (s)<br />
Velocity (cm/sec)<br />
8<br />
4<br />
0<br />
-4<br />
-8<br />
0.1<br />
0 10 20 30 40<br />
Time (s)<br />
Acceleration (g)<br />
0<br />
-0.1<br />
0 10 20 30 40<br />
Time (s)<br />
Project No.<br />
26814536<br />
<strong>Chabot</strong> <strong>Dam</strong><br />
Seismic <strong>Stability</strong> <strong>Analysis</strong><br />
1989 Loma Prieta Earthquake<br />
Acceleration Time History<br />
(CSUH Stadium A3E000)<br />
Figure<br />
10-2<br />
X:\x_geo\<strong>Chabot</strong> <strong>Dam</strong>\Task G - Engineering Report\Figures\Figure 10-2.grf
Poisson's Ratio<br />
0 0.1 0.2 0.3 0.4 0.5<br />
260<br />
260<br />
240<br />
Modern Fill<br />
240<br />
220<br />
220<br />
200<br />
200<br />
Elevation, ft<br />
180<br />
160<br />
Wagon Fill<br />
180<br />
160<br />
140<br />
140<br />
120<br />
100<br />
Wagon Fill?<br />
Bedrock<br />
Vs<br />
Vp<br />
Poisson's Ratio<br />
80<br />
80<br />
0 1000 2000 3000 4000 5000<br />
Wave Velocity Vs and Vp, ft/sec<br />
120<br />
100<br />
Project No. 26814536<br />
<strong>Chabot</strong> <strong>Dam</strong><br />
Seismic <strong>Stability</strong><br />
x:\x_geo\chabot dam\Task G - Engineering Report\Figures\Figure 10-3.grf<br />
Seismic Wave Velocity Pr<strong>of</strong>iles and<br />
Stratigraphy <strong>of</strong> Boring WI-61<br />
Figure<br />
10-3
Poisson's Ratio<br />
0 0.1 0.2 0.3 0.4 0.5<br />
260<br />
260<br />
240<br />
Vs<br />
Vp<br />
Poisson's Ratio<br />
240<br />
220<br />
220<br />
200<br />
Modern Fill<br />
200<br />
Elevation, ft<br />
180<br />
160<br />
Wagon Fill<br />
180<br />
160<br />
140<br />
140<br />
120<br />
Wagon Fill?<br />
Bedrock<br />
120<br />
100<br />
100<br />
80<br />
80<br />
0 1000 2000 3000 4000 5000<br />
Wave Velocity Vs and Vp, ft/sec<br />
Project No. 26814536<br />
<strong>Chabot</strong> <strong>Dam</strong><br />
Seismic <strong>Stability</strong><br />
Seismic Wave Velocity Pr<strong>of</strong>iles and<br />
Stratigraphy <strong>of</strong> Boring WI-59<br />
Figure<br />
10-4<br />
x:\x_geo\chabot dam\Task G - Engineering Report\Figures\Figure 10-4.grf
Poisson's Ratio<br />
0 0.1 0.2 0.3 0.4 0.5<br />
260<br />
260<br />
240<br />
Vs<br />
Vp<br />
Poisson's Ratio<br />
240<br />
220<br />
Modern Fill<br />
220<br />
200<br />
200<br />
Elevation, ft<br />
180<br />
160<br />
Wagon Fill<br />
180<br />
160<br />
140<br />
140<br />
120<br />
Foundation Soil<br />
120<br />
Bedrock<br />
100<br />
100<br />
80<br />
80<br />
0 1000 2000 3000 4000 5000<br />
Wave Velocity Vs and Vp, ft/sec<br />
Project No. 26814536<br />
<strong>Chabot</strong> <strong>Dam</strong><br />
Seismic <strong>Stability</strong><br />
Seismic Wave Velocity Pr<strong>of</strong>iles and<br />
Stratigraphy <strong>of</strong> Boring WI-62<br />
Figure<br />
10-5<br />
x:\x_geo\chabot dam\Task G - Engineering Report\Figures\Figure 10-5.grf
Poisson's Ratio<br />
0 0.1 0.2 0.3 0.4 0.5<br />
260<br />
260<br />
240<br />
Vs<br />
Vp<br />
Poisson's Ratio<br />
240<br />
220<br />
220<br />
200<br />
200<br />
Elevation, ft<br />
180<br />
160<br />
Random Fill<br />
180<br />
160<br />
Sluiced Fill<br />
140<br />
140<br />
Wagon Fill?<br />
120<br />
Foundation Soil ?<br />
120<br />
100<br />
Bedrock<br />
100<br />
80<br />
80<br />
0 1000 2000 3000 4000 5000<br />
Wave Velocity Vs and Vp, ft/sec<br />
Project No. 26814536<br />
<strong>Chabot</strong> <strong>Dam</strong><br />
Seismic <strong>Stability</strong><br />
Seismic Wave Velocity Pr<strong>of</strong>iles and<br />
Stratigraphy <strong>of</strong> Boring WI-60<br />
Figure<br />
10-6<br />
x:\x_geo\chabot dam\Task G - Engineering Report\Figures\Figure 10-6.grf
300<br />
250<br />
Elevation, Feet (MSL)<br />
200<br />
150<br />
100<br />
RESERVOIR SILT<br />
268<br />
262<br />
FOUNDATION SOIL<br />
257<br />
WAGON FILL<br />
UPSTREAM<br />
WAGON FILL<br />
CORE<br />
BEDROCK<br />
1117<br />
1112<br />
1106<br />
1101<br />
1095<br />
WAGON FILL<br />
DOWNSTREAM<br />
FOUNDATION SOIL<br />
2189<br />
RANDOM FILL<br />
SLUICED FILL<br />
2185<br />
2181<br />
2178<br />
50<br />
0<br />
-300 -200 -100 0 100 200 300 400 500<br />
257 -- Element number<br />
Offset from Centerline, Feet<br />
Project No.<br />
26814536<br />
<strong>Chabot</strong> <strong>Dam</strong><br />
Seismic <strong>Stability</strong> <strong>Analysis</strong><br />
Selected Element Locations<br />
For Stress Time-history Plots<br />
QUAD4M <strong>Analysis</strong><br />
Figure<br />
10-7<br />
X:\x_geo\<strong>Chabot</strong> <strong>Dam</strong>\Task G - Engineering Report\Figures\Figure 10-7.grf
300<br />
250<br />
1179<br />
1176<br />
Elevation, Feet (MSL)<br />
200<br />
150<br />
100<br />
RESERVOIR SILT<br />
154<br />
151<br />
145<br />
143<br />
141<br />
289<br />
284<br />
278<br />
276<br />
274<br />
FOUNDATION SOIL<br />
WAGON FILL<br />
UPSTREAM<br />
660<br />
654<br />
648<br />
643<br />
637<br />
635<br />
633<br />
WAGON FILL<br />
CORE<br />
BEDROCK<br />
1171<br />
1166<br />
1160<br />
1155<br />
1149<br />
1147<br />
1145<br />
WAGON FILL<br />
DOWNSTREAM<br />
1845<br />
1842<br />
1836<br />
1831<br />
FOUNDATION SOIL 1825<br />
1823<br />
1821<br />
2307<br />
2302<br />
2296<br />
2294<br />
2292<br />
SLUICED FILL<br />
RANDOM FILL<br />
2656<br />
2654<br />
2648<br />
2646<br />
2644<br />
50<br />
0<br />
-300 -200 -100 0 100 200 300 400 500<br />
141 -- Node number<br />
Offset from Centerline, Feet<br />
Project No.<br />
26814536<br />
<strong>Chabot</strong> <strong>Dam</strong><br />
Seismic <strong>Stability</strong> <strong>Analysis</strong><br />
Selected Nodal Points<br />
For Acceleration Outputs<br />
QUAD4M <strong>Analysis</strong><br />
Figure<br />
10-8<br />
X:\x_geo\<strong>Chabot</strong> <strong>Dam</strong>\Task G - Engineering Report\Figures\Figure 10-8.grf
300<br />
250<br />
Spillway Crest EL. 227.25 ft.<br />
U/S Block #3<br />
D/S Block #3<br />
D/S Block #4<br />
Elevation, Feet (MSL)<br />
200<br />
150<br />
100<br />
RESERVOIR SILT<br />
U/S Block #1<br />
FOUNDATION SOIL<br />
WAGON FILL<br />
UPSTREAM<br />
U/S Block #2<br />
WAGON FILL<br />
CORE<br />
BEDROCK<br />
WAGON FILL<br />
DOWNSTREAM<br />
D/S Block #2<br />
FOUNDATION SOIL<br />
D/S Block #1<br />
SLUICED FILL<br />
RANDOM FILL<br />
50<br />
0<br />
-300 -200 -100 0 100 200 300 400 500<br />
Offset from Centerline, Feet<br />
Project No.<br />
26814536<br />
<strong>Chabot</strong> <strong>Dam</strong><br />
Seismic <strong>Stability</strong> <strong>Analysis</strong><br />
Sliding Blocks for<br />
Newmark Deformation Analyses<br />
Cross Section A-A'<br />
Figure<br />
10-9<br />
X:\x_geo\<strong>Chabot</strong> <strong>Dam</strong>\Task G - Engineering Report\Figures\Figure 10-9.grf
300<br />
250<br />
0.215<br />
0.211<br />
Elevation, Feet (MSL)<br />
200<br />
150<br />
100<br />
RESERVOIR SILT<br />
0.134<br />
0.131<br />
0.081<br />
0.074<br />
0.068<br />
0.120<br />
0.095<br />
0.077<br />
0.063<br />
0.059<br />
WAGON FILL<br />
UPSTREAM<br />
FOUNDATION SOIL<br />
0.166<br />
0.143<br />
0.086<br />
0.064<br />
0.060<br />
0.057<br />
0.056<br />
WAGON FILL<br />
CORE<br />
BEDROCK<br />
0.182<br />
0.161<br />
0.119<br />
0.102<br />
0.069<br />
0.054<br />
0.054<br />
WAGON FILL<br />
DOWNSTREAM<br />
FOUNDATION SOIL<br />
0.123<br />
0.124<br />
0.083<br />
0.080<br />
0.060<br />
0.058<br />
0.058<br />
0.198<br />
0.132<br />
0.063<br />
0.058<br />
0.055<br />
SLUICED FILL<br />
RANDOM FILL<br />
0.082<br />
0.080<br />
0.067<br />
0.063<br />
0.060<br />
50<br />
0<br />
-300 -200 -100 0 100 200 300 400 500<br />
0.068 -- Peak horizontal acceleration in g.<br />
Offset from Centerline, Feet<br />
Project No.<br />
26814536<br />
<strong>Chabot</strong> <strong>Dam</strong><br />
Seismic <strong>Stability</strong> <strong>Analysis</strong><br />
Peak Horizontal Acceleration<br />
QUAD4M <strong>Analysis</strong><br />
1989 Loma Prieta Earthquake<br />
Figure<br />
10-10<br />
X:\x_geo\<strong>Chabot</strong> <strong>Dam</strong>\Task G - Engineering Report\Figures\Figure 10-10.grf
300<br />
250<br />
Elevation, Feet (MSL)<br />
200<br />
150<br />
100<br />
00.00 -300.00 -200.00 -100.00 0.00 100.00 200.00 300.00 400.00 500.00<br />
50<br />
RESERVOIR SILT<br />
FOUNDATION SOIL<br />
WAGON FILL<br />
UPSTREAM<br />
WAGON FILL<br />
CORE<br />
BEDROCK<br />
WAGON FILL<br />
DOWNSTREAM<br />
FOUNDATION SOIL<br />
SLUICED FILL<br />
RANDOM FILL<br />
0<br />
-300 -200 -100 0 100 200 300 400 500<br />
Offset from Centerline, Feet<br />
Project No.<br />
26814536<br />
<strong>Chabot</strong> <strong>Dam</strong><br />
Seismic <strong>Stability</strong> <strong>Analysis</strong><br />
Cyclic Stress Ratio<br />
QUAD4M <strong>Analysis</strong><br />
1989 Loma Prieta Earthquake<br />
Figure<br />
10-11<br />
X:\x_geo\<strong>Chabot</strong> <strong>Dam</strong>\Task G - Engineering Report\Figures\Figure 10-11.grf
Acceleration (g)<br />
0.1<br />
0.05<br />
0<br />
-0.05<br />
-0.1<br />
K h,avg (U/S Block #3)<br />
Acceleration (g)<br />
0.1<br />
0.05<br />
0<br />
-0.05<br />
-0.1<br />
K h,avg (U/S Block #2)<br />
Acceleration (g)<br />
0.1<br />
0.05<br />
0<br />
-0.05<br />
K h,avg (U/S Block #1)<br />
-0.1<br />
0 10 20 30 40<br />
Time (s)<br />
Project No.<br />
26814536<br />
<strong>Chabot</strong> <strong>Dam</strong><br />
Seismic <strong>Stability</strong> <strong>Analysis</strong><br />
Average Mass Acceleration<br />
Upstream Sliding Blocks<br />
QUAD4M <strong>Analysis</strong><br />
1989 Loma Prieta Earthquake<br />
Figure<br />
10-12<br />
X:\x_geo\<strong>Chabot</strong> <strong>Dam</strong>\Task G - Engineeing Report\Figures\Figure 10-12.grf
Acceleration (g)<br />
0.08<br />
0.04<br />
0<br />
-0.04<br />
-0.08<br />
K h,avg (D/S Block #3)<br />
Acceleration (g)<br />
0.08<br />
0.04<br />
0<br />
-0.04<br />
-0.08<br />
K h,avg (D/S Block #2)<br />
Acceleration (g)<br />
0.08<br />
0.04<br />
0<br />
-0.04<br />
K h,avg (D/S Block #1)<br />
-0.08<br />
0 10 20 30 40<br />
Time (s)<br />
Project No.<br />
26814536<br />
<strong>Chabot</strong> <strong>Dam</strong><br />
Seismic <strong>Stability</strong> <strong>Analysis</strong><br />
Average Mass Acceleration<br />
Downstream Sliding Blocks<br />
QUAD4M <strong>Analysis</strong><br />
1989 Loma Prieta Earthquake<br />
Figure<br />
10-13<br />
X:\x_geo\<strong>Chabot</strong> <strong>Dam</strong>\Task G - Engineering Report\Figures\Figure 10-13.grf
Acceleration (g)<br />
0.08<br />
0.04<br />
0<br />
-0.04<br />
K h,avg (D/S Block #4)<br />
-0.08<br />
0 10 20 30 40<br />
Time (s)<br />
Project No.<br />
26814536<br />
<strong>Chabot</strong> <strong>Dam</strong><br />
Seismic <strong>Stability</strong> <strong>Analysis</strong><br />
Average Mass Acceleration<br />
Downstream Sliding Block #4<br />
QUAD4M <strong>Analysis</strong><br />
1989 Loma Prieta Earthquake<br />
Figure<br />
10-14<br />
X:\x_geo\<strong>Chabot</strong> <strong>Dam</strong>\Task G - Engineering Report\Figures\Figure 10-14.grf
300<br />
250<br />
1.154<br />
1.116<br />
Elevation, Feet (MSL)<br />
200<br />
150<br />
100<br />
RESERVOIR SILT<br />
1.132<br />
0.997<br />
0.946<br />
0.929<br />
0.898<br />
1.000<br />
0.879<br />
0.967<br />
0.938<br />
0.900<br />
WAGON FILL<br />
UPSTREAM<br />
FOUNDATION SOIL<br />
1.086<br />
1.012<br />
0.966<br />
0.821<br />
0.872<br />
0.952<br />
0.913<br />
WAGON FILL<br />
CORE<br />
BEDROCK<br />
0.998<br />
0.946<br />
0.900<br />
0.836<br />
0.859<br />
0.955<br />
0.917<br />
WAGON FILL<br />
DOWNSTREAM<br />
FOUNDATION SOIL<br />
0.964<br />
0.949<br />
0.766<br />
0.679<br />
0.843<br />
0.955<br />
0.916<br />
1.487<br />
0.960<br />
0.910<br />
0.934<br />
0.886<br />
SLUICED FILL<br />
RANDOM FILL<br />
1.156<br />
1.102<br />
0.971<br />
0.926<br />
0.902<br />
50<br />
0<br />
-300 -200 -100 0 100 200 300 400 500<br />
Offset from Centerline, Feet<br />
0.898 -- Peak horizontal acceleration in g.<br />
Project No.<br />
26814536<br />
<strong>Chabot</strong> <strong>Dam</strong><br />
Seismic <strong>Stability</strong> <strong>Analysis</strong><br />
Peak Horizontal Acceleration<br />
QUAD4M <strong>Analysis</strong><br />
Hayward Fault MCE TH #1<br />
Figure<br />
10-15<br />
X:\x_geo\<strong>Chabot</strong> <strong>Dam</strong>\Task G - Engineering Report\Figures\Figure 10-15.grf
Acceleration (g)<br />
1.2<br />
0.8<br />
0.4<br />
0<br />
-0.4<br />
-0.8<br />
-1.2<br />
Node 1149 (Elev. 120.5)<br />
Acceleration (g)<br />
1.2<br />
0.8<br />
0.4<br />
0<br />
-0.4<br />
-0.8<br />
-1.2<br />
Node 1147 (Elev. 110)<br />
Acceleration (g)<br />
1.2<br />
0.8<br />
0.4<br />
0<br />
-0.4<br />
-0.8<br />
Node 1145 (Elev. 90)<br />
-1.2<br />
0 10 20 30 40 50<br />
Time (s)<br />
Project No.<br />
26814536<br />
<strong>Chabot</strong> <strong>Dam</strong><br />
Seismic <strong>Stability</strong> <strong>Analysis</strong><br />
Acceleration Time History<br />
Beneath Crest<br />
Nodes 1145, 1147 and 1149<br />
Hayward Fault MCE TH #1<br />
Figure<br />
10-16<br />
X:\x_geo\<strong>Chabot</strong> <strong>Dam</strong>\Task G - Engineering Report\Figures\Figure 10-16.grf
Acceleration (g)<br />
1.2<br />
0.8<br />
0.4<br />
0<br />
-0.4<br />
-0.8<br />
-1.2<br />
Node 1179 (Elev. 250)<br />
Acceleration (g)<br />
1.2<br />
0.8<br />
0.4<br />
0<br />
-0.4<br />
-0.8<br />
Node 1160 (Elev. 175)<br />
-1.2<br />
0 10 20 30 40 50<br />
Time (s)<br />
Project No.<br />
26814536<br />
<strong>Chabot</strong> <strong>Dam</strong><br />
Seismic <strong>Stability</strong> <strong>Analysis</strong><br />
Acceleration Time History<br />
Beneath Crest<br />
Nodes 1160 and 1179<br />
Hayward Fault MCE TH #1<br />
Figure<br />
10-17<br />
X:\x_geo\<strong>Chabot</strong> <strong>Dam</strong>\Task G - Engineering Report\Figures\Figure 10-17.grf
300<br />
250<br />
Elevation, Feet (MSL)<br />
200<br />
150<br />
100<br />
RESERVOIR SILT<br />
WAGON FILL<br />
UPSTREAM<br />
FOUNDATION SOIL<br />
WAGON FILL<br />
CORE<br />
BEDROCK<br />
WAGON FILL<br />
DOWNSTREAM<br />
FOUNDATION SOIL<br />
SLUICED FILL<br />
RANDOM FILL<br />
-400 50 -300 -200 -100 0 100 200 300 400 500<br />
0<br />
-300 -200 -100 0 100 200 300 400 500<br />
Offset from Centerline, Feet<br />
Notes: Peak shear stress contour values in pounds per square foot (psf)<br />
Project No.<br />
26814536<br />
<strong>Chabot</strong> <strong>Dam</strong><br />
Seismic <strong>Stability</strong> <strong>Analysis</strong><br />
Peak Shear Stress<br />
QUAD4M <strong>Analysis</strong><br />
Hayward Fault MCE TH #1<br />
Figure<br />
10-18<br />
X:\x_geo\<strong>Chabot</strong> <strong>Dam</strong>\Task G - Engineering Report\Figures\Figure 10-18.grf
Shear stress (psf)<br />
6000<br />
3000<br />
0<br />
-3000<br />
-6000<br />
Elem 1106 (Elev. 169)<br />
Shear stress (psf)<br />
6000<br />
3000<br />
0<br />
-3000<br />
-6000<br />
Elem 1101 (Elev. 142)<br />
Shear stress (psf)<br />
6000<br />
3000<br />
0<br />
-3000<br />
Elem 1095 (Elev. 113)<br />
-6000<br />
0 10 20 30 40 50<br />
Time (s)<br />
Project No.<br />
26814536<br />
<strong>Chabot</strong> <strong>Dam</strong><br />
Seismic <strong>Stability</strong> <strong>Analysis</strong><br />
Shear Stress Time History<br />
Beneath Crest<br />
Elements 1095, 1101, and 1106<br />
Hayward Fault MCE TH #1<br />
Figure<br />
10-19<br />
X:\x_geo\<strong>Chabot</strong> <strong>Dam</strong>\Task G - Engineering Report\Figures\Figure 10-19.grf
Shear stress (psf)<br />
2000<br />
1000<br />
0<br />
-1000<br />
-2000<br />
Elem 1117 (Elev. 215)<br />
Shear stress (psf)<br />
4000<br />
2000<br />
0<br />
-2000<br />
Elem 1112 (Elev. 194)<br />
-4000<br />
0 10 20 30 40 50<br />
Time (s)<br />
Project No.<br />
26814536<br />
<strong>Chabot</strong> <strong>Dam</strong><br />
Seismic <strong>Stability</strong> <strong>Analysis</strong><br />
Shear Stress Time History<br />
Beneath Crest<br />
Elements 1112 and 1117<br />
Hayward Fault MCE TH #1<br />
Figure<br />
10-20<br />
X:\x_geo\<strong>Chabot</strong> <strong>Dam</strong>\Task G - Engieering Report\Figures\Figure 10-20.grf
300<br />
250<br />
Elevation, Feet (MSL)<br />
200<br />
150<br />
100<br />
400.00 -300.00 -200.00 -100.00 0.00 100.00 200.00 300.00 400.00 500.00<br />
50<br />
RESERVOIR SILT<br />
WAGON FILL<br />
UPSTREAM<br />
FOUNDATION SOIL<br />
WAGON FILL<br />
CORE<br />
BEDROCK<br />
WAGON FILL<br />
DOWNSTREAM<br />
FOUNDATION SOIL<br />
SLUICED FILL<br />
RANDOM FILL<br />
0<br />
-300 -200 -100 0 100 200 300 400 500<br />
Offset from Centerline, Feet<br />
Project No.<br />
26814536<br />
<strong>Chabot</strong> <strong>Dam</strong><br />
Seismic <strong>Stability</strong> <strong>Analysis</strong><br />
Cyclic Stress Ratio<br />
QUAD4M <strong>Analysis</strong><br />
Hayward Fault MCE TH #1<br />
Figure<br />
10-21<br />
X:\x_geo\<strong>Chabot</strong> <strong>Dam</strong>\Task G - Engineering Report\Figures\Figure 10-21.grf
300<br />
250<br />
0.614<br />
0.609<br />
Elevation, Feet (MSL)<br />
200<br />
150<br />
100<br />
RESERVOIR SILT<br />
0.362<br />
0.359<br />
0.304<br />
0.306<br />
0.290<br />
0.395<br />
0.341<br />
0.316<br />
0.305<br />
0.290<br />
WAGON FILL<br />
UPSTREAM<br />
FOUNDATION SOIL<br />
0.517<br />
0.467<br />
0.354<br />
0.303<br />
0.313<br />
0.312<br />
0.297<br />
WAGON FILL<br />
CORE<br />
BEDROCK<br />
0.586<br />
0.528<br />
0.378<br />
0.314<br />
0.319<br />
0.314<br />
0.299<br />
WAGON FILL<br />
DOWNSTREAM<br />
FOUNDATION SOIL<br />
0.449<br />
0.409<br />
0.326<br />
0.301<br />
0.307<br />
0.306<br />
0.291<br />
0.527<br />
0.351<br />
0.302<br />
0.298<br />
0.282<br />
SLUICED FILL<br />
RANDOM FILL<br />
0.332<br />
0.327<br />
0.286<br />
0.279<br />
0.297<br />
50<br />
0<br />
-300 -200 -100 0 100 200 300 400 500<br />
Offset from Centerline, Feet<br />
0.290 -- Peak horizontal acceleration in g.<br />
Project No.<br />
26814536<br />
<strong>Chabot</strong> <strong>Dam</strong><br />
Seismic <strong>Stability</strong> <strong>Analysis</strong><br />
Peak Horizontal Acceleration<br />
QUAD4M <strong>Analysis</strong><br />
San Andreas Fault MCE<br />
Figure<br />
10-22<br />
X:\x_geo\<strong>Chabot</strong> <strong>Dam</strong>\Task G - Engineering Report\Figures\Figure 10-22.grf
300<br />
250<br />
Elevation, Feet (MSL)<br />
200<br />
150<br />
100<br />
RESERVOIR SILT<br />
FOUNDATION SOIL<br />
WAGON FILL<br />
UPSTREAM<br />
WAGON FILL<br />
CORE<br />
BEDROCK<br />
WAGON FILL<br />
DOWNSTREAM<br />
FOUNDATION SOIL<br />
SLUICED FILL<br />
RANDOM FILL<br />
-400<br />
50<br />
-300 -200 -100 0 100 200 300 400 500<br />
0<br />
-300 -200 -100 0 100 200 300 400 500<br />
Offset from Centerline, Feet<br />
Note: Peak shear stress contour values in pounds per square foot (psf).<br />
Project No.<br />
26814536<br />
<strong>Chabot</strong> <strong>Dam</strong><br />
Seismic <strong>Stability</strong> <strong>Analysis</strong><br />
Peak Shear Stress<br />
QUAD4M <strong>Analysis</strong><br />
San Andreas Fault MCE<br />
Figure<br />
10-23<br />
X:\x_geo\<strong>Chabot</strong> <strong>Dam</strong>\Task G - Engineering Report\Figures\Figure 10-23.grf
300<br />
250<br />
Elevation, Feet (MSL)<br />
200<br />
150<br />
100<br />
00.00 -300.00 -200.00 -100.00 0.00 100.00 200.00 300.00 400.00 500.00<br />
50<br />
RESERVOIR SILT<br />
WAGON FILL<br />
UPSTREAM<br />
FOUNDATION SOIL<br />
WAGON FILL<br />
CORE<br />
BEDROCK<br />
WAGON FILL<br />
DOWNSTREAM<br />
FOUNDATION SOIL<br />
SLUICED FILL<br />
RANDOM FILL<br />
0<br />
-300 -200 -100 0 100 200 300 400 500<br />
Offset from Centerline, Feet<br />
Project No.<br />
26814536<br />
<strong>Chabot</strong> <strong>Dam</strong><br />
Seismic <strong>Stability</strong> <strong>Analysis</strong><br />
Cyclic Stress Ratio<br />
QUAD4M <strong>Analysis</strong><br />
San Andreas Fault MCE<br />
Figure<br />
10-24<br />
X:\x_geo\<strong>Chabot</strong> <strong>Dam</strong>\Task G - Engineering Report\Figures\Figure 10-24.grf
11. Section 11 ELEVEN Seismic <strong>Stability</strong> Analyses<br />
SECTIONELEVEN<br />
Seismic <strong>Stability</strong> Analyses<br />
11.1 APPROACH<br />
As described in Section 8, the approach to the seismic stability analysis <strong>of</strong> the dam consisted <strong>of</strong><br />
using the results <strong>of</strong> the dynamic response analyses presented in Section 10 to evaluate the<br />
potential for liquefaction <strong>of</strong> the sluiced fill and for cyclic strength degradation <strong>of</strong> the wagon fill<br />
materials and foundation soils. The slope stability factors <strong>of</strong> safety and yield accelerations <strong>of</strong><br />
potential sliding blocks were then evaluated using limit-equilibrium analyses and shear strengths<br />
appropriate for the materials subject to liquefaction or cyclic strength degradation. Together<br />
with the average mass accelerations <strong>of</strong> the sliding blocks obtained from the dynamic response<br />
analyses, the yield accelerations were used to calculate seismic displacements <strong>of</strong> the sliding<br />
blocks using a Newmark-type deformation analysis.<br />
11.2 EVALUATION OF LIQUEFACTION POTENTIAL IN SLUICED FILL<br />
11.2.1 Evaluation Procedures<br />
The liquefaction resistance <strong>of</strong> the sluiced fill materials, and their residual strength after<br />
liquefaction, are best assessed based on available empirical correlations with in-situ test data. In<br />
this investigation, the liquefaction potential <strong>of</strong> the sluiced fill was evaluated from its estimated<br />
SPT blow count resistance using the correlations proposed by Youd et al. (2001). The factor <strong>of</strong><br />
safety against liquefaction is calculated as:<br />
FS = CRR / CSR<br />
where: CRR = cyclic resistance ratio, and CSR = cyclic stress ratio induced by the earthquake.<br />
A FS <strong>of</strong> less than 1 indicates soil liquefaction, and vice versa.<br />
The CSR was calculated from the dynamic response analyses as described in Section 10. The<br />
CRR values within the sluiced fill were calculated using the following expression:<br />
CRR = K σ ٠ K α ٠ MSF٠CRR 7.5<br />
where: CRR 7.5 = cyclic resistance ratio defined as the cyclic stress ratio required to trigger<br />
liquefaction in fifteen loading cycles<br />
MSF = magnitude scaling factor<br />
K σ = correction factor for effective overburden stress<br />
K α = correction factor for initial static shear stress.<br />
The MSF factors for the sluiced fill were evaluated by using the following equation<br />
recommended by Youd et al. (2001):<br />
MSF = 10 2.24 2.56<br />
/ M w<br />
The magnitudes <strong>of</strong> the Hayward and San Andreas MCEs and <strong>of</strong> the 1989 Loma Prieta<br />
earthquake used for analysis were 7.25, 8.0 and 6.9, respectively.<br />
The overburden correction factor (K σ ) for the sluiced fill was computed using the following<br />
equation recommended by Youd et al. (2001):<br />
K σ = (σ vo ’ / Pa) (f-1)<br />
X:\X_GEO\CHABOT DAM\TASK G -- ENGINEERING REPORT\DRAFT FINAL\DYNAMIC STABILITY ANALYSIS_R4.DOC\30-AUG-05\\OAK 11-1
SECTIONELEVEN<br />
Seismic <strong>Stability</strong> Analyses<br />
where: σ vo ’ = initial effective overburden stress<br />
Pa = atmospheric pressure (e.g. 2,000 psf)<br />
f = empirical factor dependent on relative density. A value <strong>of</strong> 0.8 was selected for the<br />
sluiced fill based on its apparent relative density.<br />
The K α correction factor was evaluated based on several recently published relationships (e.g.<br />
Harder and Boulanger, 1997; Idriss and Boulanger, 2002). A constant K α value <strong>of</strong> 1.0 was<br />
estimated for the sluiced fill based on the apparent relative density <strong>of</strong> the material and the range<br />
<strong>of</strong> applicable confining pressures.<br />
11.2.2 SPT Blow Count Evaluation<br />
The correlation between CSR required to cause liquefaction and normalized SPT blow count,<br />
(N 1 ) 60 , shown in Figure 11-1 was used to estimate the liquefaction resistance <strong>of</strong> the sluiced fill.<br />
By definition, the CSR required to cause liquefaction corresponds to the CRR. The correlation is<br />
applicable to magnitude 7.5 earthquakes and therefore yields values <strong>of</strong> CRR 7.5 .<br />
For this investigation, a large number <strong>of</strong> SPT blow counts were obtained in rotary-wash borings<br />
drilled through the sluiced fill (borings WI-60, 63 and 65). SPT blow counts were recorded per<br />
inch <strong>of</strong> sampler penetration. The plots <strong>of</strong> cumulative SPT blow count versus sampler penetration<br />
are shown in Appendix A. Figure 11-2 shows a comparison between such blow counts and those<br />
obtained for the 1973 Woodward-Clyde study (Borings WI 37, 38, and 39). As shown, the two<br />
sets <strong>of</strong> data are consistent.<br />
An attempt was made to adjust the SPT blow count for gravel effects in the sluiced fill, but it was<br />
found that such adjustment could not be reliably applied. Thus, it was judged that the SPT blow<br />
counts are likely biased toward the high side and do not provide a reliable measure <strong>of</strong> the<br />
liquefaction resistance <strong>of</strong> the sluiced fill materials. Accordingly, three BPT soundings were<br />
conducted in the sluiced fill zone for this investigation. The equivalent SPT resistance was<br />
estimated from the BPT resistance and used in the liquefaction potential evaluation as described<br />
below.<br />
11.2.3 BPT Blow Count Evaluation<br />
The BPT testing procedure is described in Section 4 and in Appendix B. Re-drive tests were<br />
performed to estimate the effects <strong>of</strong> casing friction on the BPT blow counts. These tests<br />
indicated that casing friction in soundings BPT-1 and 2 was negligible. A small amount <strong>of</strong><br />
casing friction was observed in sounding BPT-3. The corresponding adjustments to the blow<br />
counts are shown in Figure 11-3.<br />
The BPT blow count data were reduced using the approaches proposed by Harder and Seed<br />
(1986) based on the bounce chamber pressure measurements, and by Sy and Campanella (1994)<br />
based on the energy measurements. As illustrated for sounding BPT-1 in Figure 11-4, the<br />
equivalent SPT blow counts obtained using the two approaches were in excellent agreement in<br />
all cases.<br />
Figures 11-5 through 11-7 compare the equivalent SPT blow counts obtained from the BPT<br />
soundings with the SPT blow counts measured in the rotary-wash borings. It may be seen that<br />
the blow counts from the SPT borings are significantly higher than those obtained from the BPT<br />
X:\X_GEO\CHABOT DAM\TASK G -- ENGINEERING REPORT\DRAFT FINAL\DYNAMIC STABILITY ANALYSIS_R4.DOC\30-AUG-05\\OAK 11-2
SECTIONELEVEN<br />
Seismic <strong>Stability</strong> Analyses<br />
soundings, as expected based on the gravel content <strong>of</strong> the materials. It is interesting to note that<br />
in zones where the gravel content is low, for example in BPT-3 between elevations 145 and 155,<br />
the SPT blow counts obtained by the two techniques are in good agreement.<br />
Figures 11-8 through 11-10 show the equivalent normalized SPT blow count, (N 1 ) 60 , <strong>of</strong> the<br />
materials. The (N 1 ) 60 values <strong>of</strong> the sluiced fill range from about 4 to 10 with an average<br />
representative value <strong>of</strong> about 6. Based on the SPT resistance and an average fines content <strong>of</strong> 15<br />
percent for this material, the CRR 7.5 value is 0.10, according to the correlation shown in<br />
Figure 11-1.<br />
11.2.4 Liquefaction Potential<br />
The liquefaction potential <strong>of</strong> the sluiced fill, in terms <strong>of</strong> the calculated factor <strong>of</strong> safety against<br />
liquefaction, is presented in Figures 11-11 through 11-13. Figure 11-11 shows that, during the<br />
1989 Loma Prieta earthquake, the factor <strong>of</strong> safety against liquefaction <strong>of</strong> the sluiced fill would<br />
have been well above 1.0 and that no liquefaction <strong>of</strong> the saturated sluiced fill would have been<br />
expected, which is in good agreement with the field observations after that earthquake. During<br />
the Hayward and San Andreas events, however, the calculated factors <strong>of</strong> safety against<br />
liquefaction in the sluiced fill are well below 1.0, as shown in Figures 11-12 and 11-13,<br />
indicating that these materials will liquefy early during the strong shaking phase <strong>of</strong> those<br />
earthquakes. No liquefaction or strength loss was assumed to occur in the sluiced fill or the<br />
random fill above the water table.<br />
No evidence <strong>of</strong> liquefaction at the site was reported after the 1906 San Francisco earthquake,<br />
which occurred on the San Andreas fault. However, little information is available regarding the<br />
intensity <strong>of</strong> the ground motions at the site during that earthquake. Thus, the presumed<br />
performance <strong>of</strong> the dam during that earthquake cannot be compared directly with the results<br />
obtained for the San Andreas fault MCE, although such comparison might suggest that the<br />
liquefaction evaluation <strong>of</strong> the sluiced fill could be somewhat conservative.<br />
11.2.5 Residual strength evaluation<br />
The undrained residual strength, S ur , <strong>of</strong> the sluiced fill after liquefaction (or post-liquefaction<br />
strength) is estimated to be between 150 and 200 psf based on a representative equivalent SPT<br />
blow count, (N 1 ) 60 , <strong>of</strong> 6, an average fines content <strong>of</strong> 15 percent, and the correlations presented by<br />
Seed and Harder (1990) and by Idriss (2002). The latter correlation is shown in Figure 11-14. A<br />
S ur value <strong>of</strong> 150 psf was used for the sluiced fill in the stability analyses.<br />
11.3 EVALUATION OF POTENTIAL STRENGTH LOSS IN WAGON FILL AND<br />
FOUNDATION SOILS<br />
11.3.1 Evaluation Procedures<br />
The potential for strain and strength loss <strong>of</strong> the wagon fill and foundation soils was evaluated by<br />
comparing the earthquake-induced cyclic stress ratio with the cyclic strength <strong>of</strong> the materials.<br />
The cyclic strength <strong>of</strong> the materials was expressed in terms <strong>of</strong> the cyclic stress ratio required to<br />
develop a cyclic shear strain, γ, <strong>of</strong> 3.75%, which approximately corresponds to a cyclic axial<br />
X:\X_GEO\CHABOT DAM\TASK G -- ENGINEERING REPORT\DRAFT FINAL\DYNAMIC STABILITY ANALYSIS_R4.DOC\30-AUG-05\\OAK 11-3
SECTIONELEVEN<br />
Seismic <strong>Stability</strong> Analyses<br />
strain, ε, <strong>of</strong> 2.5% under undrained conditions and is commonly assumed to correspond to an<br />
excess pore pressure ratio, r u , <strong>of</strong> 100%. Thus, this cyclic strength ratio (CSR) is adopted as the<br />
cyclic resistance ratio (CRR) <strong>of</strong> the materials. The CRR was estimated based on the results <strong>of</strong><br />
the cyclic triaxial strength tests performed by WLA (1974). For a magnitude 7.5 earthquake, or<br />
about 30 cycles <strong>of</strong> loading in clayey soils (Boulanger and Idriss, 2004), the cyclic resistance ratio<br />
<strong>of</strong> the materials was estimated to be CRR 7.5 = 0.4, for conditions <strong>of</strong> zero static shear stress ratio<br />
(α=0) and effective overburden stress, (σ v ’), equal to 1 tsf. The estimated cyclic resistance curve<br />
for the materials for 1 to 100 cycles <strong>of</strong> loading is shown in Figure 11-15.<br />
The factor <strong>of</strong> safety against development <strong>of</strong> shear strains <strong>of</strong> 3.75% was calculated as:<br />
FS 3.75 = CRR/CSR<br />
where: CSR = earthquake-induced cyclic stress ratio and CRR is given by:<br />
CRR = K σ ٠ K α ٠ MSF٠CRR 7.5<br />
where: CRR 7.5 = cyclic resistance ratio defined as the cyclic stress ratio required to produce a<br />
shear strain <strong>of</strong> 3.75% in thirty cycles <strong>of</strong> loading<br />
MSF = magnitude scaling factor<br />
K σ = correction factor for effective overburden stress<br />
K α = correction factor for initial static shear stress ratio<br />
The magnitude scaling factor was obtained from the following expression (Boulanger and Idriss,<br />
2004):<br />
MSF = 1.12 exp(-M/4) + 0.828 ; MSF ≤ 1.13<br />
where: M is the moment magnitude <strong>of</strong> the earthquake. The overburden and shear stress<br />
correction factors were obtained from the following expressions, which were derived from the<br />
results <strong>of</strong> the cyclic strength tests:<br />
K σ = (σ v ’) -0.3 ; K σ ≤ 1.2<br />
K α = 1 + 3.29α – 6.61α 2 – 3.84α 3 ; α ≤ 0.35<br />
where: α = initial static shear stress ratio and σ v ’ = effective vertical stress in tsf. The values <strong>of</strong><br />
static stress ratio and vertical effective stress were obtained from the static stress analysis <strong>of</strong> the<br />
dam performed using the computer program FLAC (Section 12).<br />
No reliable measurements <strong>of</strong> residual excess pore pressures were made during the cyclic strength<br />
tests by WLA (1974). Available measurements made upon completion <strong>of</strong> the tests suggest that a<br />
maximum residual excess pore pressure ratio (r u ) <strong>of</strong> about 95% generally developed during the<br />
tests. Thus, the excess pore pressures during shaking had to be estimated based on the results <strong>of</strong><br />
cyclic tests with pore pressure measurements on similar materials (WCC, 1989), which yielded<br />
the following expression:<br />
r u = 1/FS 3.75 ; r u ≤ 0.95<br />
No laboratory test data are available on the post-cyclic strength <strong>of</strong> the wagon fill or foundation<br />
soils. Thus, limited data are available to evaluate the potential reduction in strength <strong>of</strong> the<br />
materials due to the calculated excess pore pressures. Accordingly, such reduction was<br />
estimated based on the available cyclic strength data and on published information for similar<br />
X:\X_GEO\CHABOT DAM\TASK G -- ENGINEERING REPORT\DRAFT FINAL\DYNAMIC STABILITY ANALYSIS_R4.DOC\30-AUG-05\\OAK 11-4
SECTIONELEVEN<br />
Seismic <strong>Stability</strong> Analyses<br />
materials (Thiers and Seed, 1969; Lee and Focht, 1976; Idriss, 1985; Mejia, 1989). Based on<br />
this information, the post-cyclic strength <strong>of</strong> the wagon fill and foundation soils was estimated<br />
from the following expression:<br />
(τ max ) / (τ max ) static = (1 – r u ) 0.16 ; (τ max ) / (τ max ) static ≥ 0.6<br />
where:<br />
(τ max ) = Post-cyclic undrained shear strength<br />
(τ max ) static = Static undrained shear strength<br />
11.3.2 Potential for Strength Loss<br />
The calculated excess pore pressure ratios in the saturated wagon fill and foundation soils for the<br />
Loma Prieta earthquake are shown in Figure 11-16. These results indicate that low excess pore<br />
pressures (less than about 40%) would have developed in these materials during that earthquake,<br />
as was actually observed. As shown in Figure 11-15, the low calculated pore pressures are<br />
associated with a small reduction in post-cyclic undrained strength (less than about 10%).<br />
The excess pore pressure ratios calculated for the Hayward-Rodgers Creek Fault MCE were<br />
about 95% throughout a large portion <strong>of</strong> the wagon fill and foundation soils (Figure 11-17). This<br />
corresponds to a reduction in the undrained strength <strong>of</strong> the materials <strong>of</strong> about 40% after the<br />
strong shaking phase <strong>of</strong> the earthquake.<br />
The calculated excess pore pressure ratios for the San Andreas Fault MCE are shown in Figure<br />
11-18. These ratios range from about 75 to 95% and correspond to a lower calculated degree <strong>of</strong><br />
strength degradation for this event than for the Hayward Fault MCE.<br />
11.4 POST-EARTHQUAKE SLOPE STABILITY<br />
Limit equilibrium methods were used to check the post-earthquake stability <strong>of</strong> the dam. The<br />
analyses were performed assuming liquefaction <strong>of</strong> the saturated sluiced fill and reduction <strong>of</strong> the<br />
undrained strength <strong>of</strong> the wagon fill and foundation soils to their post-cyclic strength. The<br />
undrained residual strength <strong>of</strong> 150 psf was assigned to the liquefied sluiced fill. The post-cyclic<br />
undrained strengths <strong>of</strong> the saturated wagon fill and foundation soils were estimated as discussed<br />
above. The calculated post-earthquake factors <strong>of</strong> safety for the Hayward Fault MCE, for the<br />
sliding blocks shown in Figure 10-9, are summarized in Table 11-1. Because the Hayward Fault<br />
MCE induces the largest strength degradation <strong>of</strong> the wagon fill and foundation soils (up to 40%),<br />
the potential for post-earthquake instability will be highest after this event. The results shown in<br />
Table 11-1 indicate that the dam will be stable after that event. Greater margins <strong>of</strong> safety against<br />
post-earthquake instability are expected for the San Andreas Fault MCE since this event<br />
produces a lower degree <strong>of</strong> strength degradation in the materials.<br />
To evaluate the potential for instability <strong>of</strong> the sluiced fill in the direction <strong>of</strong> the stream channel<br />
downstream <strong>of</strong> the dam, post-earthquake stability analyses for the Hayward Fault MCE were<br />
performed using composite section A-A”. The results <strong>of</strong> these analyses are presented in<br />
Figure 11-19. The calculated factors <strong>of</strong> safety for sliding surfaces within the downstream sluiced<br />
fill zone are close to or below 1.0, indicating that calculation <strong>of</strong> a yield acceleration is not<br />
pertinent. These results indicate that there is a potential for downstream displacements <strong>of</strong> the<br />
sluiced fill during and after the Hayward Fault MCE. Because adequate factors <strong>of</strong> safety are<br />
X:\X_GEO\CHABOT DAM\TASK G -- ENGINEERING REPORT\DRAFT FINAL\DYNAMIC STABILITY ANALYSIS_R4.DOC\30-AUG-05\\OAK 11-5
SECTIONELEVEN<br />
Seismic <strong>Stability</strong> Analyses<br />
calculated for failure surfaces that reach into the wagon fill, it may be concluded that<br />
displacement <strong>of</strong> the sluiced fill is unlikely to result in gross instability <strong>of</strong> the wagon fill. This<br />
conclusion is corroborated by the deformation patterns calculated from the nonlinear analyses<br />
presented in Section 12.<br />
11.5 DEFORMATION ANALYSES<br />
11.5.1 Methodology<br />
The seismic deformations <strong>of</strong> the dam were estimated with the Newmark sliding block method <strong>of</strong><br />
analysis. The method is based on the assumption <strong>of</strong> rigid-perfectly plastic stress-strain behavior<br />
on a potential failure surface. Displacements <strong>of</strong> the sliding block are calculated by integrating<br />
twice with time the difference between the earthquake-induced average acceleration <strong>of</strong> the slide<br />
mass and its yield acceleration.<br />
The results <strong>of</strong> the QUAD4M analyses were used to evaluate the earthquake-induced average<br />
mass accelerations <strong>of</strong> potential sliding blocks within the dam. Together with the yield<br />
accelerations obtained from the limit equilibrium analyses, the average mass accelerations were<br />
used to calculate seismic displacements <strong>of</strong> the sliding blocks. Double integration <strong>of</strong> the<br />
difference between the average mass and yield accelerations was performed with the computer<br />
program TNMN.<br />
11.5.2 Yield Acceleration Evaluation<br />
The yield accelerations, K y , used in the analyses were calculated from pseudo-static limitequilibrium<br />
analyses. The calculated K y values for the selected sliding blocks are tabulated in<br />
Table 11-2 for various levels <strong>of</strong> strength degradation in the embankment and foundation<br />
materials. The K y for the pre-earthquake condition corresponds to the yield acceleration <strong>of</strong> the<br />
sliding blocks prior to liquefaction <strong>of</strong> the sluiced fill or seismic strength degradation <strong>of</strong> the<br />
wagon fill and foundation soils. The K y for post-cyclic conditions, assumes that the sluiced fill<br />
has liquefied and that the wagon fill and foundation soils have undergone strength loss.<br />
Together with the results <strong>of</strong> the FLAC analyses presented in Section 12, the calculated shear<br />
stress time histories within the dam (Figures 10-19 and 10-20) were used to estimate the timing<br />
<strong>of</strong> strength reduction <strong>of</strong> the materials during the earthquake shaking. For the Hayward fault<br />
MCE, little strength reduction is expected during the first 10.8 seconds <strong>of</strong> shaking. A 20%<br />
reduction in strength is estimated between 10.8 and 12.2 seconds <strong>of</strong> shaking. The maximum<br />
reduction in strength <strong>of</strong> 40% is estimated thereafter. This timing <strong>of</strong> strength reduction was used<br />
to develop time histories <strong>of</strong> yield acceleration during the earthquake for the selected sliding<br />
blocks. For the San Andreas fault MCE little reduction in strength is calculated for the first<br />
12 seconds <strong>of</strong> shaking and the maximum reduction shown in Table 11-3 is estimated to occur<br />
after 15 seconds.<br />
11.5.3 <strong>Analysis</strong> Results<br />
The Newmark-type deformation analyses results are presented in Figures 11-20 through 11-34.<br />
The calculated displacements are summarized in Table 11-3. These calculated displacements<br />
correspond to horizontal translation <strong>of</strong> the center <strong>of</strong> mass <strong>of</strong> each sliding block. The<br />
X:\X_GEO\CHABOT DAM\TASK G -- ENGINEERING REPORT\DRAFT FINAL\DYNAMIC STABILITY ANALYSIS_R4.DOC\30-AUG-05\\OAK 11-6
SECTIONELEVEN<br />
Seismic <strong>Stability</strong> Analyses<br />
corresponding vertical displacements can be obtained from the rotation <strong>of</strong> the block necessary to<br />
accommodate the horizontal displacements.<br />
For the Loma Prieta earthquake, little strength degradation is expected during the earthquake and<br />
the peak mass acceleration for each block (see Figures 10-12 through 10-14) is less than the<br />
corresponding yield acceleration (see Figure 9-10). Thus, the calculated deformations are nil,<br />
and it may be concluded that the calculated dynamic response and seismic deformations from the<br />
Newmark-type analyses are in good agreement with the known performance <strong>of</strong> the dam during<br />
that earthquake.<br />
The displacements calculated for Hayward event are shown in Figures 11-20 through 11-26.<br />
Horizontal displacements <strong>of</strong> 6 to 9 feet are calculated for upstream block No. 3. Based on the<br />
geometry <strong>of</strong> the block, such displacements would correspond to downward vertical<br />
displacements <strong>of</strong> the crest <strong>of</strong> 4 to 6 feet. Somewhat larger horizontal displacements (9 to 12 feet)<br />
are calculated for upstream block No. 1, but this block does not reach across the dam crest.<br />
Horizontal displacements <strong>of</strong> about 4 feet are calculated for downstream Block No. 4, which<br />
approximately encompasses the body <strong>of</strong> the sluiced fill. Horizontal displacements <strong>of</strong> less than<br />
3 feet are calculated for other downstream blocks and for a deep-seated upstream block.<br />
Parametric analyses were also performed based on the amount <strong>of</strong> strength degradation calculated<br />
from the FLAC analyses, which is discussed in Section 12. These latter analyses indicate that<br />
cyclic degradation will result in a reduction in strength <strong>of</strong> no more than about 10 percent over a<br />
large portion <strong>of</strong> the wagon fill. This reduction is expected to occur during the strong phase <strong>of</strong><br />
shaking. Accordingly, the parametric analyses were performed for selected sliding blocks using<br />
time histories <strong>of</strong> yield acceleration that incorporate a 10 percent strength reduction (see<br />
Table 11-3) early in the strong phase <strong>of</strong> shaking. The results <strong>of</strong> these analyses are shown in<br />
Figures 11-27 through 11-29. As shown in Figures 11-27 and 11-28, the calculated horizontal<br />
displacements for upstream blocks Nos. 1 and 3 are less than about 5 feet. Such displacements<br />
correspond to a vertical downward displacement <strong>of</strong> the crest less than about 3.5 feet.<br />
In summary, the Newmark analyses for the Hayward fault MCE result in calculated downward<br />
displacements <strong>of</strong> the crest less than about 6 feet, and likely less than about 3.5 feet. Horizontal<br />
displacements <strong>of</strong> up to about 12 feet are calculated for sliding blocks near the upstream face <strong>of</strong><br />
the dam, but such blocks do not extend into the main body <strong>of</strong> the embankment and do not reach<br />
across the dam crest.<br />
The displacements calculated for the San Andreas event are shown in Figures 11-30 through 11-<br />
34. It may be seen that the calculated dam deformations for the San Andreas event are lower<br />
than those for the Hayward event. Thus, the results <strong>of</strong> the analyses indicate that the San Andreas<br />
event is less critical than the Hayward event regarding the seismic stability <strong>of</strong> the dam.<br />
11.5.4 Analyses <strong>of</strong> Alternative Cross-Sections<br />
As discussed in Sections 7 and 9, there are uncertainties regarding the geometry <strong>of</strong> the<br />
embankment cross-section. Parametric analyses were performed for the Hayward Fault MCE to<br />
evaluate the effects <strong>of</strong> such uncertainties on the calculated deformations, as described below.<br />
There is some uncertainty regarding the location <strong>of</strong> the downstream boundary between the<br />
wagon fill and the sluiced fill. Limited Newmark-type deformation analyses were performed on<br />
Modified Section A-A’ (Figure 9-4) to examine the sensitivity <strong>of</strong> the calculated deformations to<br />
X:\X_GEO\CHABOT DAM\TASK G -- ENGINEERING REPORT\DRAFT FINAL\DYNAMIC STABILITY ANALYSIS_R4.DOC\30-AUG-05\\OAK 11-7
SECTIONELEVEN<br />
Seismic <strong>Stability</strong> Analyses<br />
the location <strong>of</strong> that boundary. The results <strong>of</strong> those analyses are illustrated in Figures 11-35 and<br />
11-36 and are summarized in Table 11-4. They indicate that the calculated downstream<br />
deformations are not highly sensitive to the location <strong>of</strong> the wagon fill/sluiced fill boundary.<br />
As shown in the boring logs and in Figures 7-3 and 7-4, exploratory borings WI-66 and WI-67<br />
encountered reservoir silt to depths <strong>of</strong> only about 6 feet. Between 6 and 15 feet, the materials in<br />
WI-67 may or may not be fill. The materials encountered in borings WI-66 and WI-67 below<br />
depths <strong>of</strong> 6 and 15 feet, respectively, have the characteristics <strong>of</strong> fill, similar to that encountered<br />
in borings at the crest and downstream bench. They do not appear to be landslide material and<br />
they are clearly not reservoir sediment. Nonetheless, to evaluate the effects <strong>of</strong> uncertainties in<br />
the characteristics <strong>of</strong> these materials, Alternative Section A-A’ was developed and analyzed.<br />
This alternative section is shown in Figure 11-37. In this alternative section, the material<br />
overlying the upstream toe (at Elev. 120.5) is assumed to be reservoir silt. The results <strong>of</strong><br />
Newmark-type deformation analyses to evaluate that assumption are illustrated in Figures 11-38<br />
through 11-40 and are summarized in Table 11-4. Figures 11-38 and 11-39 illustrate the factors<br />
<strong>of</strong> safety and yield accelerations calculated for conditions <strong>of</strong> zero and 20% strength reduction.<br />
The latter condition is intermediate to the conditions <strong>of</strong> zero and the maximum reduction <strong>of</strong> 40%<br />
after strong shaking (see Section 11.5.2). Figure 11-40 shows the results <strong>of</strong> the time integration<br />
<strong>of</strong> slide mass displacement. As might be expected, the computed displacement for upstream<br />
block No. 2 increases somewhat from the value presented in Table 11-3, but is smaller than the<br />
values shown in that table for upstream blocks Nos. 1 and 3.<br />
To evaluate the effects <strong>of</strong> potential liquefaction in the foundation soils beneath the sluiced fill<br />
these soils were modeled with the same properties as the overlying sluiced fill in alternative<br />
cross section A-A’ (see Figure 11-37). The same change was also implemented in an alternative<br />
to modified section A-A’, as shown in Figure 11-41. The results <strong>of</strong> Newmark-type deformation<br />
analyses to check those effects are shown in Figures 11-41 through 11-44, and are summarized in<br />
Table 11-4. The results indicate that the potential for liquefaction in the foundation soils beneath<br />
the sluiced fill does not have a significant effect on the calculated deformations.<br />
X:\X_GEO\CHABOT DAM\TASK G -- ENGINEERING REPORT\DRAFT FINAL\DYNAMIC STABILITY ANALYSIS_R4.DOC\30-AUG-05\\OAK 11-8
SECTIONELEVEN<br />
Seismic <strong>Stability</strong> Analyses<br />
Table 11-1<br />
Post-Earthquake Factors <strong>of</strong> Safety for Hayward Fault MCE<br />
Sliding Block (1)<br />
Calculated Factor <strong>of</strong> Safety<br />
U/S 1 1.05<br />
U/S 2 1.83<br />
U/S 3 1.25<br />
D/S 1 1.59<br />
D/S 2 1.47<br />
D/S 3 1.55<br />
D/S 4 1.34<br />
Note:<br />
(1) See Figure 10-9 for location and geometry <strong>of</strong> sliding blocks.<br />
(2) Maximum strength reduction in saturated wagon fill is 40 percent.<br />
Table 11-2<br />
Yield Acceleration Coefficients <strong>of</strong> Selected Sliding Blocks for Various Levels <strong>of</strong> Post-cyclic<br />
Strength Reduction in Embankment and Foundation Materials<br />
Sliding<br />
Block (2)<br />
Pre-<br />
Earthquake<br />
Assumed Reduction in Post-cyclic Strength <strong>of</strong> Saturated Wagon Fill and<br />
Foundation Soils (1)<br />
Condition (3) 10% (4) 20% 40%<br />
U/S #1 0.29 0.22 0.14 0.01<br />
U/S #2 0.37 0.31 0.26 0.15<br />
U/S #3 0.28 0.21 0.14 0.06<br />
D/S #1 0.37 0.29 0.23 0.14<br />
D/S #2 0.40 0.30 0.21 0.12<br />
D/S #3 0.39 0.27 0.16 0.11<br />
D/S #4 0.50 (5) 0.05 0.05 0.05<br />
Note:<br />
(1) Saturated sluiced fill is assumed to have liquefied and its residual strength is used as its post-cyclic strength. No strength<br />
reduction is assumed in materials above the water table.<br />
(2) See Figure 10-9 for location and geometry <strong>of</strong> sliding blocks.<br />
(3) This condition applies to earthquake shaking period before strength degradation occurs.<br />
(4) The yield acceleration coefficient, Ky, for 10% strength reduction was estimated by interpolation from the Ky values for<br />
pre-earthquake and post-cyclic earthquake conditions with 20% strength reduction.<br />
(5) The Ky value is truncated at 0.5 and used in analysis.<br />
X:\X_GEO\CHABOT DAM\TASK G -- ENGINEERING REPORT\DRAFT FINAL\DYNAMIC STABILITY ANALYSIS_R4.DOC\30-AUG-05\\OAK 11-9
SECTIONELEVEN<br />
Seismic <strong>Stability</strong> Analyses<br />
Earthquake<br />
Hayward Fault MCE<br />
San Andreas Fault MCE<br />
Table 11-3<br />
Calculated Horizontal Displacement in Newmark-type Analyses<br />
Sliding<br />
Block (1)<br />
Note:<br />
1. See Figure 10-9 for location and geometry <strong>of</strong> sliding blocks.<br />
2. See report text for the assumed timing <strong>of</strong> strength reduction<br />
Max. Strength<br />
Displacement, ft<br />
Reduction (2) Standard Polarity Reverse Polarity<br />
U/S 1 40% 9.3 11.8<br />
U/S 2 40% 0.0 0.6<br />
U/S 3 40% 5.6 8.9<br />
D/S 1 40% 0.9 2.9<br />
D/S 2 40% 0.3 1.7<br />
D/S 3 40% 0.8 2.8<br />
D/S 4 40% 1.1 4<br />
U/S 1 10 % 2.1 5.2<br />
U/S 3 10 % 2.2 5.4<br />
D/S 1 10 % 0.6 1.7<br />
U/S 1 40% 8.3 10.2<br />
U/S 3 40% 3.3 4.2<br />
D/S 4 20% 1.8 1.8<br />
U/S 1 10 % 0.1 0.5<br />
U/S 3 10 % 0.1 0.6<br />
Table 11-4<br />
Sensitivity <strong>Analysis</strong> <strong>of</strong> Calculated Horizontal Displacement to Uncertainties in<br />
Embankment and Foundation Conditions - Hayward Fault MCE<br />
Section<br />
Sliding Block<br />
Max.<br />
Strength<br />
Reduction<br />
Standard<br />
Polarity<br />
Displacement, ft<br />
Reverse Polarity<br />
Modified Section A-A’ (1) D/S 1 40% 1.4 4.4<br />
D/S 3 40% 1.4 5.1<br />
Alternative Section A-A’ (2) U/S 2 40% 0.1 1.2<br />
D/S 2 40% 0.4 2.6<br />
Alternative Modified Section A-A’ (3) D/S 2 40% 0.4 2.2<br />
Note:<br />
1. Obtained from Section A-A’ by moving wagon fill/sluiced fill boundary upstream (Figure 9-4).<br />
2. Obtained from Section A-A’ by assuming upstream limit <strong>of</strong> wagon fill at 2:1 slope to top <strong>of</strong> foundation soil, and<br />
assuming foundation soil beneath sluice fill is liquefiable (Figure 11-37).<br />
3. Combination <strong>of</strong> Modified Section A-A’ and Alternative Section A-A’ (Figure 11-41).<br />
X:\X_GEO\CHABOT DAM\TASK G -- ENGINEERING REPORT\DRAFT FINAL\DYNAMIC STABILITY ANALYSIS_R4.DOC\30-AUG-05\\OAK 11-10
Project No. 26814536<br />
<strong>Chabot</strong> <strong>Dam</strong><br />
Seismic <strong>Stability</strong><br />
x:\x_geo\chabot dam\Task G -- Engineering Report\Figures\Figure 11-1.grf<br />
SPT-Based Liquefaction Triggering<br />
Correlations for Mw 7.5 Earthquakes<br />
(1996 and 1998 NCEER/NSF Workshops)<br />
Figure<br />
11-1
<strong>Chabot</strong> <strong>Dam</strong> - SPT blow counts from<br />
borings WI-37, 38, 39, 60,63, and 65<br />
240<br />
220<br />
WI-37<br />
WI-38<br />
WI-39<br />
WI-60<br />
WI-63<br />
WI-65<br />
240<br />
220<br />
200<br />
200<br />
Elevation, ft<br />
180<br />
160<br />
180<br />
160<br />
140<br />
140<br />
120<br />
120<br />
100<br />
100<br />
0 20 40 60 80 100<br />
SPT Blow Counts N60, blows/ft<br />
Note:<br />
SPT blow counts in the bedrock, or affected by the bedrock, are excluded.<br />
Project No. 26814536<br />
<strong>Chabot</strong> <strong>Dam</strong><br />
Seismic <strong>Stability</strong><br />
SPT Blow Counts N60 From Borings<br />
in Sluiced Fill Zone<br />
Figure<br />
11-2<br />
x:\x_geo\chabot dam\Task G - Engineering Report\Figures\Figure 11-2.grf
0<br />
<strong>Chabot</strong> <strong>Dam</strong> - Becker Hammer Penetration Test<br />
Redrives<br />
0<br />
BPT-1<br />
BPT-2<br />
BPT-3<br />
20<br />
20<br />
Depth, ft<br />
40<br />
Adjustment for<br />
Casing Friction on BPT-3<br />
40<br />
60<br />
No adjustment for<br />
Casing Friction on BPT-1 and 2.<br />
60<br />
80<br />
80<br />
100<br />
100<br />
0 20 40 60 80 100<br />
BPT Blow Counts Nbc, blows/ft<br />
Project No. 26814536<br />
<strong>Chabot</strong> <strong>Dam</strong><br />
Seismic <strong>Stability</strong><br />
Adjustment <strong>of</strong> Nbc for Casing Friction<br />
on BPT-1, 2 and 3<br />
Figure<br />
11-3<br />
x:\x_geo\chabot dam\Task G - Engineering Report\Figures\Figure 11-3.grf
180<br />
<strong>Chabot</strong> <strong>Dam</strong><br />
BPT-1 Blow Counts<br />
Eq. N60 after Harder and Seed 1986<br />
Eq. N60 after Sy and Campanella 1994<br />
180<br />
160<br />
160<br />
Elevation, ft<br />
140<br />
140<br />
120<br />
120<br />
100<br />
100<br />
0 20 40 60 80<br />
Equivalent SPT Blow Counts N60, blows/ft<br />
Project No. 26814536<br />
<strong>Chabot</strong> <strong>Dam</strong><br />
Seismic <strong>Stability</strong><br />
Becker Penetration Test<br />
BPT-1<br />
Figure<br />
11-4<br />
x:\x_geo\chabot dam\Task G - Engineering Report\Figures\Figure 11-4.grf
<strong>Chabot</strong> <strong>Dam</strong><br />
Borings WI-60 and BPT-1<br />
240<br />
240<br />
BPT-1 (Harder and Seed 1986)<br />
WI-60<br />
220<br />
220<br />
200<br />
200<br />
Elevation, ft<br />
180<br />
160<br />
Random Fill<br />
180<br />
160<br />
Sluiced Fill<br />
140<br />
140<br />
Wagon Fill ?<br />
120<br />
Foundation Soil ?<br />
120<br />
Bedrock<br />
100<br />
100<br />
0 20 40 60 80 100<br />
SPT Blow Counts N60, blows/ft<br />
Note:<br />
Stratigraphy is inferred from BPT resistance and boring log <strong>of</strong> WI-60.<br />
Project No. 26814536<br />
<strong>Chabot</strong> <strong>Dam</strong><br />
Seismic <strong>Stability</strong><br />
SPT Resistance N60 From<br />
Borings WI-60 and BPT-1<br />
Figure<br />
11-5<br />
x:\x_geo\chabot dam\Task G - Engineering Report\Figures\Figure 11-5.grf
<strong>Chabot</strong> <strong>Dam</strong><br />
Borings WI-63 and BPT-2<br />
240<br />
240<br />
BPT-2 (Harder and Seed 1986)<br />
WI-63<br />
220<br />
220<br />
200<br />
200<br />
Elevation, ft<br />
180<br />
160<br />
Random Fill<br />
180<br />
160<br />
Sluiced Fill<br />
140<br />
140<br />
120<br />
Wagon Fill ?<br />
120<br />
Bedrock<br />
100<br />
100<br />
0 20 40 60 80 100<br />
SPT Blow Counts N60, blows/ft<br />
Note:<br />
Stratigraphy is inferred from BPT resistance and boring log <strong>of</strong> WI-63<br />
Project No. 26814536<br />
<strong>Chabot</strong> <strong>Dam</strong><br />
Seismic <strong>Stability</strong><br />
SPT Resistance N60 From<br />
Borings WI-63 and BPT-2<br />
Figure<br />
11-6<br />
x:\x_geo\chabot dam\Task G - Engineering Report\Figures\Figure 11-6.grf
<strong>Chabot</strong> <strong>Dam</strong><br />
Borings WI-65 and BPT-3<br />
240<br />
240<br />
BPT-3 (Harder and Seed 1986)<br />
WI-65<br />
220<br />
220<br />
200<br />
200<br />
Elevation, ft<br />
180<br />
160<br />
Random Fill<br />
180<br />
160<br />
Sluiced Fill<br />
140<br />
140<br />
Wagon Fill ?<br />
120<br />
120<br />
Foundation Soil<br />
Bedrock<br />
100<br />
100<br />
0 20 40 60 80 100<br />
SPT Blow Counts N60, blows/ft<br />
Note:<br />
Stratigraphy is inferred from BPT resistace and boring log <strong>of</strong> WI-65.<br />
Project No. 26814536<br />
<strong>Chabot</strong> <strong>Dam</strong><br />
Seismic <strong>Stability</strong><br />
SPT Resistance N60 From<br />
Borings WI-65 and BPT-3<br />
Figure<br />
11-7<br />
x:\x_geo\chabot dam\Task G - Engineering Report\Figures\Figure 11-7.grf
240<br />
<strong>Chabot</strong> <strong>Dam</strong><br />
Boring BPT-1<br />
240<br />
BPT-1<br />
(after Harder and Seed 1986)<br />
220<br />
220<br />
200<br />
200<br />
Elevation, ft<br />
180<br />
160<br />
Random Fill<br />
180<br />
160<br />
Sluiced Fill<br />
140<br />
140<br />
Wagon Fill ?<br />
120<br />
Foundation Soil ?<br />
120<br />
Bedrock<br />
100<br />
100<br />
0 20 40 60 80 100<br />
Equivalent SPT Blow Counts N1,60, blows/ft<br />
Note:<br />
Stratigraphy is inferred from BPT resistance and boring log <strong>of</strong> WI-60.<br />
Project No. 26814536<br />
<strong>Chabot</strong> <strong>Dam</strong><br />
Seismic <strong>Stability</strong><br />
Equivalent SPT N1,60 and Stratigraphy<br />
From Boring BPT-1<br />
Figure<br />
11-8<br />
x:\x_geo\chabot dam\Task G - Engineering Report\Figures\Figure 11-8.grf
240<br />
<strong>Chabot</strong> <strong>Dam</strong><br />
Boring BPT-2<br />
240<br />
BPT-2<br />
(after Harder and Seed 1986)<br />
220<br />
220<br />
200<br />
200<br />
Elevation, ft<br />
180<br />
160<br />
Random Fill<br />
180<br />
160<br />
Sluiced Fill<br />
140<br />
140<br />
120<br />
Wagon Fill ?<br />
120<br />
Bedrock<br />
100<br />
100<br />
0 20 40 60 80 100<br />
SPT Blow Counts N1,60, blows/ft<br />
Note:<br />
Stratigraphy is inferred from BPT resistance and boring log <strong>of</strong> WI-63<br />
Project No. 26814536<br />
<strong>Chabot</strong> <strong>Dam</strong><br />
Seismic <strong>Stability</strong><br />
Equivalent SPT N1,60 and Stratigraphy<br />
From Boring BPT-2<br />
Figure<br />
11-9<br />
x:\x_geo\chabot dam\Task G - Engineering Report\Figures\Figure 11-9.grf
240<br />
<strong>Chabot</strong> <strong>Dam</strong><br />
Boring BPT-3<br />
240<br />
BPT-3<br />
(after Harder and Seed 1986)<br />
220<br />
220<br />
200<br />
200<br />
Elevation, ft<br />
180<br />
160<br />
Random Fill<br />
180<br />
160<br />
Sluiced Fill<br />
140<br />
140<br />
Wagon Fill ?<br />
120<br />
120<br />
Foundation Soil<br />
Bedrock<br />
100<br />
100<br />
0 20 40 60 80 100<br />
SPT Blow Counts N1,60, blows/ft<br />
Note:<br />
Stratigraphy is inferred from BPT resistance and boring log <strong>of</strong> WI-65.<br />
Project No. 26814536<br />
<strong>Chabot</strong> <strong>Dam</strong><br />
Seismic <strong>Stability</strong><br />
Equivalent SPT N1,60 and Stratigraphy<br />
From Boring BPT-3<br />
Figure<br />
11-10<br />
x:\x_geo\chabot dam\Task G - Engineering Report\Figures\Figure 11-10.grf
300<br />
250<br />
Spillway Crest EL. 227.25 ft.<br />
Elevation, Feet (MSL)<br />
200<br />
150<br />
100<br />
RESERVOIR SILT<br />
WAGON FILL<br />
UPSTREAM<br />
FOUNDATION SOIL<br />
WAGON FILL<br />
CORE<br />
BEDROCK<br />
WAGON FILL<br />
DOWNSTREAM<br />
FOUNDATION SOIL<br />
200.00<br />
180.00<br />
RANDOM FILL<br />
160.00<br />
140.00<br />
SLUICED FILL<br />
120.00<br />
240.00 260.00 280.00 300.00 320.00 340.00 360.00 380.00 400.00 420.00<br />
100.00<br />
50<br />
0<br />
-300 -200 -100 0 100 200 300 400 500<br />
Offset from Centerline, Feet<br />
Project No.<br />
26814536<br />
<strong>Chabot</strong> <strong>Dam</strong><br />
Seismic <strong>Stability</strong> <strong>Analysis</strong><br />
Factors <strong>of</strong> Safety against Liquefaction<br />
in Sluiced Fill<br />
1989 Loma Prieta Earthquake<br />
Figure<br />
11-11<br />
X:\x_geo\<strong>Chabot</strong> <strong>Dam</strong>\Task G - Engineering Report\Figures\Figure 11-11.grf
300<br />
250<br />
Spillway Crest EL. 227.25 ft.<br />
Elevation, Feet (MSL)<br />
200<br />
150<br />
100<br />
RESERVOIR SILT<br />
WAGON FILL<br />
UPSTREAM<br />
FOUNDATION SOIL<br />
WAGON FILL<br />
CORE<br />
BEDROCK<br />
WAGON FILL<br />
DOWNSTREAM<br />
FOUNDATION SOIL<br />
200.00<br />
180.00<br />
RANDOM FILL<br />
160.00<br />
SLUICED FILL<br />
140.00<br />
120.00<br />
240.00 260.00 280.00 300.00 320.00 340.00 360.00 380.00 400.00 420.00<br />
100.00<br />
50<br />
0<br />
-300 -200 -100 0 100 200 300 400 500<br />
Offset from Centerline, Feet<br />
Project No.<br />
<strong>Chabot</strong> <strong>Dam</strong><br />
26814536 Factors <strong>of</strong> Safety against Liquefaction<br />
Seismic <strong>Stability</strong> <strong>Analysis</strong><br />
in Sluiced Fill<br />
Hayward Fault MCE TH #1<br />
Figure<br />
11-12<br />
X:\x_geo\<strong>Chabot</strong> <strong>Dam</strong>\Task G - Engineering Report\Figures\Figure 11-12.grf
300<br />
250<br />
Spillway Crest EL. 227.25 ft.<br />
Elevation, Feet (MSL)<br />
200<br />
150<br />
100<br />
RESERVOIR SILT<br />
WAGON FILL<br />
UPSTREAM<br />
FOUNDATION SOIL<br />
WAGON FILL<br />
CORE<br />
BEDROCK<br />
WAGON FILL<br />
DOWNSTREAM<br />
FOUNDATION SOIL<br />
200.00<br />
180.00<br />
RANDOM FILL<br />
160.00<br />
SLUICED FILL<br />
140.00<br />
120.00<br />
240.00 260.00 280.00 300.00 320.00 340.00 360.00 380.00 400.00 420.00<br />
100.00<br />
50<br />
0<br />
-300 -200 -100 0 100 200 300 400 500<br />
Offset from Centerline, Feet<br />
Project No.<br />
<strong>Chabot</strong> <strong>Dam</strong><br />
26814536 Seismic <strong>Stability</strong> <strong>Analysis</strong><br />
Factors <strong>of</strong> Safety against Liquefaction<br />
in Sluiced Fill<br />
San Andreas Fault MCE<br />
Figure<br />
11-13<br />
X:\x_geo\<strong>Chabot</strong> <strong>Dam</strong>\Task G - Engineering Report\Figures\Figure 11-13.grf
Project No.<br />
26814536<br />
<strong>Chabot</strong> <strong>Dam</strong><br />
Seismic <strong>Stability</strong><br />
Correlation between Undrained Residual<br />
Strength and Equivalent Clean Sand<br />
SPT Corrected Blow Counts<br />
(Idriss, 2002)<br />
Figure<br />
11-14<br />
X:\x_geo\<strong>Chabot</strong> <strong>Dam</strong>\Task G - Engineering ReportFigures\Figure 11-14.grf
Cyclic Strength<br />
CSR 30 = 0.4<br />
Strength Degradation<br />
0.8<br />
1<br />
Cyclic cyclic Stress stress Ratio, ratio CSRi<br />
0.7<br />
0.6<br />
0.5<br />
0.4<br />
0.3<br />
0.2<br />
0.1<br />
CSR i = 0.85 CSR_30 . τ max<br />
/(τ max<br />
) stati c<br />
0.8<br />
0.6<br />
0.4<br />
0.2<br />
0<br />
1 10 100 1000<br />
Number cycles <strong>of</strong> cycles to rto u = r u 100% = 100%, N i<br />
0<br />
0 0.2 0.4 0.6 0.8 1<br />
pore pressure ratio ,(rr u )<br />
7.41<br />
⎛ CSR ⎞<br />
τ<br />
30<br />
N = 30<br />
⎜<br />
⎟ 1 ≤ N ≤100<br />
⎝ CSR<br />
( i i<br />
τ ) max<br />
i ⎠<br />
where CSR = 0.4<br />
30<br />
( − r ) 0. 16<br />
max<br />
1<br />
u<br />
static<br />
=<br />
Project No.<br />
26814536<br />
<strong>Chabot</strong> <strong>Dam</strong><br />
Seismic <strong>Stability</strong> <strong>Analysis</strong><br />
Cyclic Strength and Undrained<br />
Strength Degradation <strong>of</strong> Saturated<br />
Wagon Fill and Foundation Soils<br />
Figure<br />
11-15<br />
X:\x_geo\<strong>Chabot</strong> <strong>Dam</strong>\Task G - Engineering Report\Figures\Figure 11-15.grf
300<br />
250<br />
Spillway Crest EL. 227.25 ft.<br />
Elevation, Feet (MSL)<br />
200<br />
150<br />
100<br />
400.00 -300.00 -200.00 -100.00 0.00 100.00 200.00 300.00<br />
50<br />
RESERVOIR SILT<br />
WAGON FILL<br />
UPSTREAM<br />
FOUNDATION SOIL<br />
WAGON FILL<br />
CORE<br />
BEDROCK<br />
WAGON FILL<br />
DOWNSTREAM<br />
FOUNDATION SOIL<br />
SLUICED FILL<br />
RANDOM FILL<br />
0<br />
-300 -200 -100 0 100 200 300 400 500<br />
Offset from Centerline, Feet<br />
Project No.<br />
26814536<br />
<strong>Chabot</strong> <strong>Dam</strong><br />
Seismic <strong>Stability</strong> <strong>Analysis</strong><br />
Excess Pore Pressure Ratio<br />
in Wagon Fill and Foundation Soils<br />
1989 Loma Prieta Earthquake<br />
Figure<br />
11-16<br />
X:\x_geo\<strong>Chabot</strong> <strong>Dam</strong>\Task G - Engineering Report\Figures\Figure 11-16.grf
300<br />
250<br />
Spillway Crest EL. 227.25 ft.<br />
Elevation, Feet (MSL)<br />
200<br />
150<br />
100<br />
RESERVOIR SILT<br />
WAGON FILL<br />
UPSTREAM<br />
FOUNDATION SOIL<br />
WAGON FILL<br />
CORE<br />
WAGON FILL<br />
DOWNSTREAM<br />
r u ~ 0.95 r u ~ 0.95 r u ~ 0.95<br />
BEDROCK<br />
FOUNDATION SOIL<br />
SLUICED FILL<br />
RANDOM FILL<br />
50<br />
0<br />
-300 -200 -100 0 100 200 300 400 500<br />
Offset from Centerline, Feet<br />
Note: Calculated excess pore pressure ratio in the shaded zone reaches the approximate maximum value estimated from the cyclic strength tests.<br />
Project No.<br />
26814536<br />
<strong>Chabot</strong> <strong>Dam</strong><br />
Seismic <strong>Stability</strong> <strong>Analysis</strong><br />
Excess Pore Pressure Ratio<br />
in Wagon Fill and Foundation Soils<br />
Hayward Fault MCE TH #1<br />
Figure<br />
11-17<br />
X:\x_geo\<strong>Chabot</strong> <strong>Dam</strong>\Task G - Engineering Report\Figures\Figure 11-17.grf
300<br />
250<br />
Spillway Crest EL. 227.25 ft.<br />
Elevation, Feet (MSL)<br />
200<br />
150<br />
100<br />
RESERVOIR SILT<br />
FOUNDATION SOIL<br />
WAGON FILL<br />
UPSTREAM<br />
WAGON FILL<br />
CORE<br />
0.00 -300.00 -200.00 -100.00 0.00 100.00 200.00 300.00<br />
BEDROCK<br />
WAGON FILL<br />
DOWNSTREAM<br />
FOUNDATION SOIL<br />
SLUICED FILL<br />
RANDOM FILL<br />
50<br />
0<br />
-300 -200 -100 0 100 200 300 400 500<br />
Offset from Centerline, Feet<br />
Project No.<br />
26814536<br />
<strong>Chabot</strong> <strong>Dam</strong><br />
Seismic <strong>Stability</strong> <strong>Analysis</strong><br />
Excess Pore Pressure Ratio<br />
in Wagon Fill and Foundation Soils<br />
San Andreas Fault MCE<br />
Figure<br />
11-18<br />
X:\x_geo\<strong>Chabot</strong> <strong>Dam</strong>\Task G - Engineering Report\Figures\Figure 11-18.grf
300<br />
250<br />
Spillway Crest EL. 227.25 ft.<br />
Elevation, Feet (MSL)<br />
200<br />
150<br />
100<br />
RESERVOIR SILT<br />
WAGON FILL<br />
UPSTREAM<br />
FOUNDATION SOIL<br />
WAGON FILL<br />
CORE<br />
BEDROCK<br />
FS = 1.35<br />
WAGON FILL<br />
DOWNSTREAM FS = 1.35<br />
FOUNDATION SOIL<br />
FS = 1.05<br />
SLUICED FILL<br />
FS = 1.01<br />
RANDOM FILL<br />
FS = 1.00<br />
FS = 0.85<br />
50<br />
0<br />
-300 -200 -100 0 100 200 300 400 500 600 700<br />
Offset from Centerline, Feet<br />
Project No.<br />
26814536<br />
<strong>Chabot</strong> <strong>Dam</strong><br />
Seismic <strong>Stability</strong> <strong>Analysis</strong><br />
Seismic <strong>Stability</strong> <strong>Analysis</strong><br />
Post-Earthquake Condition<br />
Downstream Section A-A"<br />
Hayward Fault MCE<br />
Figure<br />
11-19<br />
X:\x_geo\<strong>Chabot</strong> <strong>Dam</strong>\Task G - Engineering Report\Figures\Figure 11-19.grf
Acceleration - g<br />
1.0<br />
0.5<br />
0.0<br />
-0.5<br />
-1.0<br />
0 5 10 15 20 25 30 35 40 45 50<br />
Time - sec<br />
12<br />
Displacement - feet<br />
10<br />
8<br />
6<br />
4<br />
2<br />
Standard Polarity<br />
Reverse Polarity<br />
0<br />
0 5 10 15 20 25 30 35 40 45 50<br />
Time - sec<br />
Project No.<br />
26814536<br />
<strong>Chabot</strong> <strong>Dam</strong><br />
Seismic <strong>Stability</strong> <strong>Analysis</strong><br />
Newmark Deformation <strong>Analysis</strong><br />
Calculated Displacement<br />
U/S Block #1<br />
Hayward Fault MCE TH #1<br />
Figure<br />
11-20<br />
X:\x_geo\<strong>Chabot</strong> <strong>Dam</strong>\Task G - Engineering Report\Figures\Figure 11-20.grf
Acceleration - g<br />
1.0<br />
0.5<br />
0.0<br />
-0.5<br />
-1.0<br />
0 5 10 15 20 25 30 35 40 45 50<br />
Time - sec<br />
Displacement - feet<br />
1.0<br />
0.8<br />
0.6<br />
0.4<br />
0.2<br />
Standard Polarity<br />
Reverse Polarity<br />
0.0<br />
0 5 10 15 20 25 30 35 40 45 50<br />
Time - sec<br />
Project No.<br />
26814536<br />
<strong>Chabot</strong> <strong>Dam</strong><br />
Seismic <strong>Stability</strong> <strong>Analysis</strong><br />
Newmark Deformation <strong>Analysis</strong><br />
Calculated Displacement<br />
U/S Block #2<br />
Hayward Fault MCE TH #1<br />
Figure<br />
11-21<br />
X:\x_geo\<strong>Chabot</strong> <strong>Dam</strong>\Task G - Engineering Report\Figures\Figure 11-21.grf
Acceleration - g<br />
1.0<br />
0.5<br />
0.0<br />
-0.5<br />
-1.0<br />
0 5 10 15 20 25 30 35 40 45 50<br />
Time - sec<br />
10<br />
Displacement - feet<br />
8<br />
6<br />
4<br />
2<br />
Standard Polarity<br />
Reverse Polarity<br />
0<br />
0 5 10 15 20 25 30 35 40 45 50<br />
Time - sec<br />
Project No.<br />
26814536<br />
<strong>Chabot</strong> <strong>Dam</strong><br />
Seismic <strong>Stability</strong> <strong>Analysis</strong><br />
Newmark Deformation <strong>Analysis</strong><br />
Calculated Displacement<br />
U/S Block #3<br />
Hayward Fault MCE TH #1<br />
Figure<br />
11-22<br />
X:\x_geo\<strong>Chabot</strong> <strong>Dam</strong>\Task G - Engineering Report\Figures\Figure 11-22.grf
Acceleration - g<br />
0.8<br />
0.4<br />
0.0<br />
-0.4<br />
-0.8<br />
0 5 10 15 20 25 30 35 40 45 50<br />
Time - sec<br />
4<br />
Displacement - feet<br />
2<br />
Standard Polarity<br />
Reverse Polarity<br />
0<br />
0 5 10 15 20 25 30 35 40 45 50<br />
Time - sec<br />
Project No.<br />
26814536<br />
<strong>Chabot</strong> <strong>Dam</strong><br />
Seismic <strong>Stability</strong> <strong>Analysis</strong><br />
Newmark Deformation <strong>Analysis</strong><br />
Calculated Displacement<br />
D/S Block #1<br />
Hayward Fault MCE TH #1<br />
Figure<br />
11-23<br />
X:\x_geo\<strong>Chabot</strong> <strong>Dam</strong>\Task G - Engineering Report\Figures\Figure 11-23.grf
Acceleration - g<br />
0.6<br />
0.4<br />
0.2<br />
0.0<br />
-0.2<br />
-0.4<br />
-0.6<br />
0 5 10 15 20 25 30 35 40 45 50<br />
Time - sec<br />
2<br />
Displacement - feet<br />
Standard Polarity<br />
Reverse Polarity<br />
0<br />
0 5 10 15 20 25 30 35 40 45 50<br />
Time - sec<br />
Project No.<br />
26814536<br />
<strong>Chabot</strong> <strong>Dam</strong><br />
Seismic <strong>Stability</strong> <strong>Analysis</strong><br />
Newmark Deformation <strong>Analysis</strong><br />
Calculated Displacement<br />
D/S Block #2<br />
Hayward Fault MCE TH #1<br />
Figure<br />
11-24<br />
X:\x_geo\<strong>Chabot</strong> <strong>Dam</strong>\Task G - Engineering Report\Figures\Figure 11-24.grf
Acceleration - g<br />
0.4<br />
0.0<br />
-0.4<br />
0 5 10 15 20 25 30 35 40 45 50<br />
Time - sec<br />
4<br />
Standard Polarity<br />
Reverse Polarity<br />
Displacement - feet<br />
2<br />
0<br />
0 5 10 15 20 25 30 35 40 45 50<br />
Time - sec<br />
Project No.<br />
26814536<br />
<strong>Chabot</strong> <strong>Dam</strong><br />
Seismic <strong>Stability</strong> <strong>Analysis</strong><br />
Newmark Deformation <strong>Analysis</strong><br />
Calculated Displacement<br />
D/S Block #3<br />
Hayward Fault MCE TH #1<br />
Figure<br />
11-25<br />
X:\x_geo\<strong>Chabot</strong> <strong>Dam</strong>\Task G - Engineering Report\Figures\Figure 11-25.grf
Acceleration - g<br />
1.0<br />
0.5<br />
0.0<br />
-0.5<br />
-1.0<br />
0 5 10 15 20 25 30 35 40 45 50<br />
Time - sec<br />
6<br />
Displacement - feet<br />
4<br />
2<br />
Standard Polarity<br />
Reverse Polarity<br />
0<br />
0 5 10 15 20 25 30 35 40 45 50<br />
Time - sec<br />
Project No.<br />
26814536<br />
<strong>Chabot</strong> <strong>Dam</strong><br />
Seismic <strong>Stability</strong> <strong>Analysis</strong><br />
Newmark Deformation <strong>Analysis</strong><br />
Calculated Displacement<br />
U/S Block #1<br />
Hayward Fault MCE TH #1<br />
(10% Max. Strength Reduction)<br />
Figure<br />
11-27<br />
X:\x_geo\<strong>Chabot</strong> <strong>Dam</strong>\Task G - Engineering Report\Figures\Figure 11-27.grf
Acceleration - g<br />
1.0<br />
0.5<br />
0.0<br />
-0.5<br />
-1.0<br />
0 5 10 15 20 25 30 35 40 45 50<br />
Time - sec<br />
6<br />
Displacement - feet<br />
4<br />
2<br />
Standard Polarity<br />
Reverse Polarity<br />
0<br />
0 5 10 15 20 25 30 35 40 45 50<br />
Time - sec<br />
Project No.<br />
26814536<br />
<strong>Chabot</strong> <strong>Dam</strong><br />
Seismic <strong>Stability</strong> <strong>Analysis</strong><br />
Newmark Deformation <strong>Analysis</strong><br />
Calculated Displacement<br />
U/S Block #3<br />
Hayward Fault MCE TH #1<br />
(10% Max. Strength Reduction)<br />
Figure<br />
11-28<br />
X:\x_geo\<strong>Chabot</strong> <strong>Dam</strong>\Task G - Engineering Report\Figures\Figure 11-28.grf
Acceleration - g<br />
0.8<br />
0.4<br />
0.0<br />
-0.4<br />
-0.8<br />
0 5 10 15 20 25 30 35 40 45 50<br />
Time - sec<br />
2<br />
Displacement - feet<br />
1<br />
Standard Polarity<br />
Reverse Polarity<br />
0<br />
0 5 10 15 20 25 30 35 40 45 50<br />
Time - sec<br />
Project No.<br />
26814536<br />
<strong>Chabot</strong> <strong>Dam</strong><br />
Seismic <strong>Stability</strong> <strong>Analysis</strong><br />
Newmark Deformation <strong>Analysis</strong><br />
Calculated Displacement<br />
D/S Block #1<br />
Hayward Fault MCE TH #1<br />
(10% Max. Strength Reduction)<br />
Figure<br />
11-29<br />
X:\x_geo\<strong>Chabot</strong> <strong>Dam</strong>\Task G - Engineering Report\Figures\Figure 11-29.grf
Acceleration - g<br />
0.4<br />
0.2<br />
0.0<br />
-0.2<br />
-0.4<br />
0 5 10 15 20 25 30 35 40 45 50 55 60 65 70<br />
Time - sec<br />
12<br />
Displacement - feet<br />
10<br />
8<br />
6<br />
4<br />
2<br />
Standard Polarity<br />
Reverse Polarity<br />
0<br />
0 5 10 15 20 25 30 35 40 45 50 55 60 65 70<br />
Time - sec<br />
Project No.<br />
26814536<br />
<strong>Chabot</strong> <strong>Dam</strong><br />
Seismic <strong>Stability</strong> <strong>Analysis</strong><br />
Newmark Deformation <strong>Analysis</strong><br />
Calculated Displacement<br />
U/S Block #1<br />
San Andreas Fault MCE<br />
Figure<br />
11-30<br />
X:\x_geo\<strong>Chabot</strong> <strong>Dam</strong>\Task G - Engineering Report\Figures\Figure 11-30.grf
Acceleration - g<br />
0.4<br />
0.2<br />
0.0<br />
-0.2<br />
-0.4<br />
0 5 10 15 20 25 30 35 40 45 50 55 60 65 70<br />
Time - sec<br />
6<br />
Displacement - feet<br />
4<br />
2<br />
Standard Polarity<br />
Reverse Polarity<br />
0<br />
0 5 10 15 20 25 30 35 40 45 50 55 60 65 70<br />
Time - sec<br />
Project No.<br />
26814536<br />
<strong>Chabot</strong> <strong>Dam</strong><br />
Seismic <strong>Stability</strong> <strong>Analysis</strong><br />
Newmark Deformation <strong>Analysis</strong><br />
Calculated Displacement<br />
U/S Block #3<br />
San Andreas Fault MCE<br />
Figure<br />
11-31<br />
X:\x_geo\<strong>Chabot</strong> <strong>Dam</strong>\Task G - Engineering Report\Figures\Figure 11-31.grf
Acceleration - g<br />
0.6<br />
0.4<br />
0.2<br />
0.0<br />
-0.2<br />
-0.4<br />
-0.6<br />
0 5 10 15 20 25 30 35 40 45 50 55 60 65 70<br />
Time - sec<br />
2.0<br />
Displacement - feet<br />
1.6<br />
1.2<br />
0.8<br />
0.4<br />
Standard Polarity<br />
Reverse Polarity<br />
0.0<br />
0 5 10 15 20 25 30 35 40 45 50 55 60 65 70<br />
Time - sec<br />
Project No.<br />
26814536<br />
<strong>Chabot</strong> <strong>Dam</strong><br />
Seismic <strong>Stability</strong> <strong>Analysis</strong><br />
Newmark Deformation <strong>Analysis</strong><br />
Calculated Displacement<br />
D/S Block #4<br />
San Andreas Fault MCE<br />
Figure<br />
11-32<br />
X:\x_geo\<strong>Chabot</strong> <strong>Dam</strong>\Task G - Engineering Report\Figures\Figure 11-32.grf
Acceleration - g<br />
0.4<br />
0.2<br />
0.0<br />
-0.2<br />
-0.4<br />
0 5 10 15 20 25 30 35 40 45 50 55 60 65 70<br />
Time - sec<br />
1.0<br />
Displacement - feet<br />
0.8<br />
0.6<br />
0.4<br />
0.2<br />
Standard Polarity<br />
Reverse Polarity<br />
0.0<br />
0 5 10 15 20 25 30 35 40 45 50 55 60 65 70<br />
Time - sec<br />
Project No.<br />
26814536<br />
<strong>Chabot</strong> <strong>Dam</strong><br />
Seismic <strong>Stability</strong> <strong>Analysis</strong><br />
Newmark Deformation <strong>Analysis</strong><br />
Calculated Displacement<br />
U/S Block #1<br />
San Andreas Fault MCE<br />
(10% Max. Strength Reduction)<br />
Figure<br />
11-33<br />
X:\x_geo\<strong>Chabot</strong> <strong>Dam</strong>\Task G - Engineering Report\Figures\Figure 11-33.grf
Acceleration - g<br />
0.4<br />
0.2<br />
0.0<br />
-0.2<br />
-0.4<br />
0 5 10 15 20 25 30 35 40 45 50 55 60 65 70<br />
Time - sec<br />
1.0<br />
Displacement - feet<br />
0.8<br />
0.6<br />
0.4<br />
0.2<br />
Standard Polarity<br />
Reverse Polarity<br />
0.0<br />
0 5 10 15 20 25 30 35 40 45 50 55 60 65 70<br />
Time - sec<br />
Project No.<br />
26814536<br />
<strong>Chabot</strong> <strong>Dam</strong><br />
Seismic <strong>Stability</strong> <strong>Analysis</strong><br />
Newmark Deformation <strong>Analysis</strong><br />
Calculated Displacement<br />
U/S Block #3<br />
San Andreas Fault MCE<br />
(10% Max. Strength Reduction)<br />
Figure<br />
11-34<br />
X:\x_geo\<strong>Chabot</strong> <strong>Dam</strong>\Task G - Engineering Report\Figures\Figure 11-34.grf
Acceleration - g<br />
0.8<br />
0.4<br />
0.0<br />
-0.4<br />
-0.8<br />
0 5 10 15 20 25 30 35 40 45 50<br />
Time - sec<br />
6<br />
Displacement - feet<br />
4<br />
2<br />
Standard Polarity<br />
Reverse Polarity<br />
0<br />
0 5 10 15 20 25 30 35 40 45 50<br />
Time - sec<br />
Project No.<br />
26814536<br />
<strong>Chabot</strong> <strong>Dam</strong><br />
Seismic <strong>Stability</strong> <strong>Analysis</strong><br />
Newmark Deformation <strong>Analysis</strong><br />
Calculated Displacement<br />
D/S Block #1 (Modified Section A-A')<br />
Hayward Fault MCE TH #1<br />
Figure<br />
11-35<br />
X:\x_geo\<strong>Chabot</strong> <strong>Dam</strong>\Task G - Engineering Report\Figures\Figure 11-35.grf
Acceleration - g<br />
0.4<br />
0.0<br />
-0.4<br />
0 5 10 15 20 25 30 35 40 45 50<br />
Time - sec<br />
6<br />
Displacement - feet<br />
4<br />
2<br />
Standard Polarity<br />
Reverse Polarity<br />
0<br />
0 5 10 15 20 25 30 35 40 45 50<br />
Time - sec<br />
Project No.<br />
26814536<br />
<strong>Chabot</strong> <strong>Dam</strong><br />
Seismic <strong>Stability</strong> <strong>Analysis</strong><br />
Newmark Deformation <strong>Analysis</strong><br />
Calculated Displacement<br />
D/S Block #3 (Modified Section A-A')<br />
Hayward Fault MCE TH #1<br />
Figure<br />
11-36<br />
X:\x_geo\<strong>Chabot</strong> <strong>Dam</strong>\Task G - Engineering Report\Figures\Figure 11-36.grf
300<br />
250<br />
Spillway Crest EL. 227.25 ft.<br />
Elevation, Feet (MSL)<br />
200<br />
150<br />
100<br />
RESERVOIR SILT<br />
WAGON FILL<br />
UPSTREAM<br />
FOUNDATION SOIL<br />
WAGON FILL<br />
CORE<br />
BEDROCK<br />
WAGON FILL<br />
DOWNSTREAM<br />
FOUNDATION SOIL<br />
SLUICED FILL<br />
LIQUEFIABLE<br />
FOUNDATION SOIL<br />
RANDOM FILL<br />
50<br />
0<br />
-300 -200 -100 0 100 200 300 400 500<br />
Offset from Centerline, Feet<br />
Project No.<br />
<strong>Chabot</strong> <strong>Dam</strong><br />
26814536 Seismic <strong>Stability</strong> <strong>Analysis</strong> Alternative Cross Section A - A'<br />
for <strong>Stability</strong> <strong>Analysis</strong><br />
Figure<br />
11-37<br />
X:\x_geo\<strong>Chabot</strong> <strong>Dam</strong>\Task G - Engineering Report\Figures\Figure 11-37.grf
300<br />
250<br />
Spillway Crest EL. 227.25 ft.<br />
Elevation, Feet (MSL)<br />
200<br />
150<br />
100<br />
RESERVOIR SILT<br />
FOUNDATION SOIL<br />
WAGON FILL<br />
UPSTREAM<br />
FS = 2.45<br />
Ky = 0.30<br />
WAGON FILL<br />
CORE<br />
BEDROCK<br />
WAGON FILL<br />
DOWNSTREAM<br />
FS = 2.61<br />
Ky = 0.40<br />
FOUNDATION SOIL<br />
SLUICED FILL<br />
LIQUEFIABLE<br />
FOUNDATION SOIL<br />
RANDOM FILL<br />
50<br />
0<br />
-300 -200 -100 0 100 200 300 400 500<br />
Offset from Centerline, Feet<br />
Project No.<br />
26814536<br />
<strong>Chabot</strong> <strong>Dam</strong><br />
Seismic <strong>Stability</strong> <strong>Analysis</strong><br />
Seismic <strong>Stability</strong> <strong>Analysis</strong><br />
Pre-Earthquake Condition<br />
Alternative Cross Section A - A'<br />
Figure<br />
11-38<br />
X:\x_geo\<strong>Chabot</strong> <strong>Dam</strong>\Task G - Engineering Report\Figures\Figure 11-38.grf
300<br />
250<br />
Spillway Crest EL. 227.25 ft.<br />
Elevation, Feet (MSL)<br />
200<br />
150<br />
100<br />
RESERVOIR SILT<br />
FOUNDATION SOIL<br />
WAGON FILL<br />
UPSTREAM<br />
FS = 1.99<br />
Ky = 0.20<br />
WAGON FILL<br />
CORE<br />
BEDROCK<br />
WAGON FILL<br />
DOWNSTREAM<br />
FS = 1.70<br />
Ky = 0.17<br />
FOUNDATION SOIL<br />
SLUICED FILL<br />
LIQUEFIABLE<br />
FOUNDATION SOIL<br />
RANDOM FILL<br />
50<br />
0<br />
-300 -200 -100 0 100 200 300 400 500<br />
Offset from Centerline, Feet<br />
Project No.<br />
26814536<br />
<strong>Chabot</strong> <strong>Dam</strong><br />
Seismic <strong>Stability</strong> <strong>Analysis</strong><br />
Seismic <strong>Stability</strong> <strong>Analysis</strong><br />
Condition with 20% Strength Reduction<br />
Alternative Cross Section A - A'<br />
Figure<br />
11-39<br />
X:\x_geo\<strong>Chabot</strong> <strong>Dam</strong>\Task G - Engineering Report\Figures\Figure 11-39.grf
Acceleration - g<br />
1.0<br />
0.5<br />
0.0<br />
-0.5<br />
-1.0<br />
0 5 10 15 20 25 30 35 40 45 50<br />
Time - sec<br />
Displacement - feet<br />
2.0<br />
1.6<br />
1.2<br />
0.8<br />
0.4<br />
Standard Polarity<br />
Reverse Polarity<br />
0.0<br />
0 5 10 15 20 25 30 35 40 45 50<br />
Time - sec<br />
Project No.<br />
26814536<br />
<strong>Chabot</strong> <strong>Dam</strong><br />
Seismic <strong>Stability</strong> <strong>Analysis</strong><br />
Alternative Cross Section A-A'<br />
Calculated Displacement<br />
U/S Block #2<br />
Hayward MCE Time-history #1<br />
FIGURE<br />
11-40<br />
X:\x_geo\<strong>Chabot</strong> <strong>Dam</strong>\Task G\Figures\Figure 11-40.grf
300<br />
250<br />
Spillway Crest EL. 227.25 ft.<br />
Elevation, Feet (MSL)<br />
200<br />
150<br />
100<br />
RESERVOIR SILT<br />
FOUNDATION SOIL<br />
WAGON FILL<br />
UPSTREAM<br />
WAGON FILL<br />
CORE<br />
BEDROCK<br />
WAGON FILL<br />
DOWNSTREAM<br />
FOUNDATION SOIL<br />
FS = 2.61<br />
Ky = 0.40<br />
SLUICED FILL<br />
LIQUEFIABLE<br />
FOUNDATION SOIL<br />
RANDOM FILL<br />
50<br />
0<br />
-300 -200 -100 0 100 200 300 400 500<br />
Offset from Centerline, Feet<br />
Project No.<br />
26814536<br />
<strong>Chabot</strong> <strong>Dam</strong><br />
Seismic <strong>Stability</strong> <strong>Analysis</strong><br />
Seismic <strong>Stability</strong> <strong>Analysis</strong><br />
Pre-Earthquake Condition<br />
Alternative Modified Section A - A'<br />
Figure<br />
11-41<br />
X:\x_geo\<strong>Chabot</strong> <strong>Dam</strong>\Task G - Engineering Report\Figures\Figure 11-41.grf
300<br />
250<br />
Spillway Crest EL. 227.25 ft.<br />
Elevation, Feet (MSL)<br />
200<br />
150<br />
100<br />
RESERVOIR SILT<br />
FOUNDATION SOIL<br />
WAGON FILL<br />
UPSTREAM<br />
WAGON FILL<br />
CORE<br />
BEDROCK<br />
WAGON FILL<br />
DOWNSTREAM<br />
FOUNDATION SOIL<br />
FS = 1.73<br />
Ky = 0.19<br />
SLUICED FILL<br />
LIQUEFIABLE<br />
FOUNDATION SOIL<br />
RANDOM FILL<br />
50<br />
0<br />
-300 -200 -100 0 100 200 300 400 500<br />
Offset from Centerline, Feet<br />
Project No.<br />
26814536<br />
<strong>Chabot</strong> <strong>Dam</strong><br />
Seismic <strong>Stability</strong> <strong>Analysis</strong><br />
Seismic <strong>Stability</strong> <strong>Analysis</strong><br />
Condition with 20% Strength Reduction<br />
Alternative Modified Section A - A'<br />
Figure<br />
11-42<br />
X:\x_geo\<strong>Chabot</strong> <strong>Dam</strong>\Task G - Engineering Report\Figures\Figure 11-42.grf
Acceleration - g<br />
0.6<br />
0.4<br />
0.2<br />
0.0<br />
-0.2<br />
-0.4<br />
-0.6<br />
0 5 10 15 20 25 30 35 40 45 50<br />
Time - sec<br />
3<br />
Displacement - feet<br />
2<br />
1<br />
Standard Polarity<br />
Reverse Polarity<br />
0<br />
0 5 10 15 20 25 30 35 40 45 50<br />
Time - sec<br />
Project No.<br />
26814536<br />
<strong>Chabot</strong> <strong>Dam</strong><br />
Seismic <strong>Stability</strong> <strong>Analysis</strong><br />
Alternative Cross Section A-A'<br />
Calculated Displacement<br />
D/S Block #2<br />
Hayward MCE Time-history #1<br />
Figure<br />
11-43<br />
X \ \Ch b t D \T k G\Fi \Fi 11 43 f
Acceleration - g<br />
0.6<br />
0.4<br />
0.2<br />
0.0<br />
-0.2<br />
-0.4<br />
-0.6<br />
0 5 10 15 20 25 30 35 40 45 50<br />
Time - sec<br />
3<br />
Standard Polarity<br />
Reverse Polarity<br />
Displacement - feet<br />
2<br />
1<br />
0<br />
0 5 10 15 20 25 30 35 40 45 50<br />
Time - sec<br />
Project No.<br />
26814536<br />
<strong>Chabot</strong> <strong>Dam</strong><br />
Seismic <strong>Stability</strong> <strong>Analysis</strong><br />
Alternative Modified Section A-A'<br />
Calculated Displacement<br />
D/S Block #2<br />
Hayward MCE Time-history #1<br />
Figure<br />
11-44<br />
X \ \Ch b t D \T k G\Fi \Fi 11 44 f
12. Section 12 TWELVE Nonlinear Analyses<br />
SECTIONTWELVE<br />
Nonlinear Analyses<br />
12.1 METHODOLOGY<br />
The dynamic response and seismic deformations <strong>of</strong> the dam were directly calculated from fully<br />
nonlinear analyses with the computer program FLAC, Version 4.0 (Itasca, 2000). In these<br />
analyses, the calculation <strong>of</strong> seismic deformations is coupled with the calculation <strong>of</strong> dynamic<br />
response. Thus, the seismic deformations, excess pore water pressures, and cyclic degradation<br />
are calculated directly from the dynamic response analyses <strong>of</strong> the dam. To establish the state <strong>of</strong><br />
stress in the dam prior to the earthquake, a seepage analysis and a static stress analysis were<br />
performed with FLAC. The resulting state <strong>of</strong> stress in the dam served as the initial state for the<br />
dynamic analysis. The initial state <strong>of</strong> stress calculated with FLAC was also used to develop the<br />
input for the dynamic response analyses with QUAD4M and the evaluations <strong>of</strong> potential for<br />
liquefaction and strength loss in the dam.<br />
The FLAC analyses were performed for Section A-A’. The section was discretized using the<br />
same mesh used for the QUAD4M finite element analyses (Figure 10-1). A compliant boundary<br />
was specified along the base <strong>of</strong> the model to simulate the unbounded extent <strong>of</strong> the foundation<br />
bedrock beneath the dam. The earthquake motions are input as a stress time history at this<br />
boundary.<br />
The Mohr-Coulomb elasto-plastic constitutive model in the basic FLAC code was used for the<br />
analyses. To evaluate the sensitivity <strong>of</strong> the calculated deformations to the choice <strong>of</strong> soil<br />
constitutive model, parametric analyses were also performed using a nested-yield surface<br />
plasticity model developed by URS. These analyses indicated that in the case <strong>of</strong> <strong>Chabot</strong> <strong>Dam</strong><br />
the calculated deformations are not very sensitive to the choice <strong>of</strong> constitutive model. Only the<br />
results using the Mohr-Coulomb model are presented herein.<br />
12.2 MATERIAL PROPERTIES<br />
The material properties used for the seepage analysis are tabulated in Table 12-1. The hydraulic<br />
conductivity <strong>of</strong> the embankment and foundation materials, was first assumed based on the<br />
engineering characteristics <strong>of</strong> the materials and then adjusted by trial-and-error until a reasonable<br />
match was obtained between the calculated phreatic surface and the available piezometric data at<br />
the dam.<br />
The material properties for the static stress analysis are summarized in Table 12-2. These<br />
parameters were selected based on the results <strong>of</strong> the laboratory tests reported herein, the values<br />
reported by WLA (1974), and published data for similar soils.<br />
The FLAC dynamic analyses were conducted using the same material characterization used for<br />
the limit-equilibrium and QUAD4M dynamic response analyses, but adapted to the specific input<br />
requirements <strong>of</strong> FLAC. The material properties for dynamic analysis are listed in Table 12-3.<br />
For both the elasto-plastic and nested-yield surface constitutive models, the analyses were<br />
performed in terms <strong>of</strong> effective stresses by coupling the models with the pore pressure generation<br />
scheme shown in Figure 12-1. In this scheme, which is based on the cyclic stress approach<br />
proposed by Seed (1979), pore pressures are continuously updated for each element in response<br />
to shear stress cycles, and the effective stresses decrease with increasing pore pressure.<br />
The strength <strong>of</strong> the materials was modeled to be consistent with that used in the limit equilibrium<br />
analyses. For the saturated sluiced fill, the soil model incorporates the post-liquefaction residual<br />
X:\X_GEO\CHABOT DAM\TASK G -- ENGINEERING REPORT\DRAFT FINAL\DYNAMIC STABILITY ANALYSIS_R4.DOC\30-AUG-05\\OAK 12-1
SECTIONTWELVE<br />
Nonlinear Analyses<br />
strength <strong>of</strong> the material by using a bi-linear failure envelope as shown in Figure 12-2. The cyclic<br />
resistance <strong>of</strong> the saturated sluiced fill was modeled using the relationship shown in Figure 12-3.<br />
The models for cyclic strength and undrained strength degradation <strong>of</strong> the saturated wagon fill<br />
and foundation soils are illustrated in Figure 12-4. The strength degradation <strong>of</strong> those materials is<br />
expressed through the ratio <strong>of</strong> post-cyclic strength to pre-cyclic (i.e. static) strength as a function<br />
<strong>of</strong> excess pore pressure ratio (see Section 11).<br />
12.3 ANALYSIS RESULTS<br />
<strong>Dynamic</strong> analyses were performed for the 1989 Loma Prieta earthquake and the Hayward fault<br />
and San Andreas fault MCEs. As in the case <strong>of</strong> the decoupled analyses, the FLAC analyses<br />
show that the San Andreas event is less critical to the seismic stability <strong>of</strong> the dam. Only the<br />
results for the Loma Prieta and Hayward events are presented herein.<br />
12.3.1 1989 Loma Prieta Earthquake<br />
The analysis results for the 1989 Loma Prieta earthquake are presented in Figures 12-5 through<br />
8. Figure 12-5 shows the calculated acceleration time histories at the crest and at the<br />
downstream rock surface together with the input time history. The maximum calculated excess<br />
pore pressure ratio in the sluiced fill is shown in Figure 12-6. The cyclic strength degradation <strong>of</strong><br />
the wagon fill is shown in Figure 12-7. The calculated displacement vectors after the earthquake<br />
are presented in Figure 12-8. As shown in these figures, the analyses result in low excess pore<br />
pressures in the sluiced fill, little degradation <strong>of</strong> the wagon fill, and very small displacements <strong>of</strong><br />
the dam. These results are in good agreement with the observed performance <strong>of</strong> the dam during<br />
the earthquake.<br />
12.3.2 Hayward-Rogers Creek Fault MCE<br />
For the Hayward fault MCE, analyses were performed for both standard and reversed polarities<br />
in the motion corresponding to acceleration time history No. 1. The results showed that the<br />
reverse polarity motions induce larger crest deformations <strong>of</strong> the dam. Thus, only the results for<br />
reversed polarity motions are presented herein.<br />
The analysis results for the Hayward event are shown in Figures 12-9 through 12-16. Figure 12-<br />
9 shows the calculated acceleration time histories at the crest and at the downstream rock surface<br />
together with the input time history. Figure 12-10 shows calculated time histories <strong>of</strong> excess pore<br />
pressure ratio in the sluiced fill and <strong>of</strong> cyclic strength degradation in the wagon fill. These<br />
results indicate that the development <strong>of</strong> excess pore pressures in the sluiced fill will begin early<br />
during the shaking and that those materials will reach a state <strong>of</strong> initial liquefaction after about 10<br />
seconds <strong>of</strong> shaking. Cyclic degradation <strong>of</strong> the wagon fill is calculated to occur during the strong<br />
phase <strong>of</strong> shaking between about 10.5 and 12 seconds. As shown in Figure 12-11, a maximum<br />
strength reduction <strong>of</strong> about 40% is calculated in the upstream zone beyond the toe <strong>of</strong> the<br />
embankment and in a small zone at the bottom <strong>of</strong> the core beneath the crest. However, the<br />
calculated amount <strong>of</strong> maximum cyclic strength degradation <strong>of</strong> the saturated fill over a large<br />
portion <strong>of</strong> the dam averages less than about 10%.<br />
Figure 12-12 shows the calculated displacement vectors throughout the dam after the earthquake.<br />
Figures 12-13 and 12-14 show calculated time histories <strong>of</strong> horizontal and vertical displacements<br />
X:\X_GEO\CHABOT DAM\TASK G -- ENGINEERING REPORT\DRAFT FINAL\DYNAMIC STABILITY ANALYSIS_R4.DOC\30-AUG-05\\OAK 12-2
SECTIONTWELVE<br />
Nonlinear Analyses<br />
at selected points on the dam slopes. As shown in these figures, the calculated downward<br />
vertical displacement <strong>of</strong> the dam crest is less than 1.5 feet. The calculated horizontal<br />
displacements <strong>of</strong> the upstream slope are less than 2 feet. The calculated horizontal<br />
displacements <strong>of</strong> the downstream slope are less than 1 foot, except in the sluiced fill where<br />
horizontal displacements <strong>of</strong> up to about 5 feet are calculated. Such displacements do not include<br />
potential movement <strong>of</strong> the sluiced fill along the downstream channel.<br />
Figures 12-15 and 12-16 show the results <strong>of</strong> stability analyses with FLAC for the postearthquake<br />
condition. These analyses result in adequate calculated factors <strong>of</strong> safety indicating<br />
that the dam slopes will remain stable after the earthquake, as was the case with the limit<br />
equilibrium post-earthquake stability analyses.<br />
X:\X_GEO\CHABOT DAM\TASK G -- ENGINEERING REPORT\DRAFT FINAL\DYNAMIC STABILITY ANALYSIS_R4.DOC\30-AUG-05\\OAK 12-3
SECTIONTWELVE<br />
Nonlinear Analyses<br />
Property Units<br />
Table 12-1<br />
Material Properties for Seepage <strong>Analysis</strong><br />
Modern<br />
Fill<br />
Random<br />
Fill<br />
Wagon Fill<br />
(U/S and Core)<br />
Wagon Fill<br />
(D/S)<br />
Sluiced<br />
Fill<br />
Foundation<br />
Soils<br />
Moist Density ρ m pcf 134 130 133 133 130 133 140<br />
Porosity n - 0.26 0.34 0.30 0.30 0.34 0.30 0.25<br />
Bedrock<br />
Vertical Hydraulic Conductivity k v ft/sec 1.6E-06 1.6E-06 1.3E-06 3.3E-06 1.6E-05 1.3E-06 3.3E-09<br />
Horizontal Hydraulic Conductivity k h ft/sec 4.1E-07 4.1E-07 6.6E-07 1.6E-06 4.1E-06 6.6E-07 3.3E-09<br />
Vertical Permeability Coefficient (1) K v ft 2 /(psf-sec)<br />
Horizontal Permeability<br />
Coefficient (1) K h ft 2 /(psf-sec)<br />
Notes:<br />
(1) Also called ‘mobility coefficient’. Used for specifying permeability for FLAC. K = k /γ water .<br />
2.6E-08 2.6E-08 2.1E-08 5.3E-08 2.6E-07 2.1E-08 5.3E-11<br />
6.6E-09 6.6E-09 1.1E-08 2.6E-08 6.6E-08 1.1E-08 5.3E-11<br />
X:\X_GEO\CHABOT DAM\TASK G -- ENGINEERING REPORT\DRAFT FINAL\DYNAMIC STABILITY ANALYSIS_R4.DOC\30-AUG-05\\OAK 12-4
SECTIONTWELVE<br />
Nonlinear Analyses<br />
Table 12-2<br />
Material Properties for Static Stress <strong>Analysis</strong><br />
Property Symbol Modern Fill Random Fill Wagon Fill Sluiced Fill Foundation Soils Bedrock<br />
Modulus Number K 400 400 400 400 400 -<br />
Modulus Number K b 300 300 300 300 300 -<br />
Modulus<br />
Exponent<br />
Modulus<br />
Exponent<br />
Elastic Bulk<br />
Modulus<br />
m 0.4 0.4 0.4 0.4 0.4 -<br />
n 0.5 0.5 0.5 0.5 0.5 -<br />
B, psf K b *Pa(σ 3 ’/Pa) m K b *Pa(σ 3 ’/Pa) m K b *Pa(σ 3 ’/Pa) m K b *Pa(σ 3 ’/Pa) m K b *Pa(σ 3 ’/Pa) m -<br />
Youngs Modulus E, psf K*Pa(σ 3 ’/Pa) n K*Pa(σ 3 ’/Pa) n K*Pa(σ 3 ’/Pa) n K*Pa(σ 3 ’/Pa) n K*Pa(σ 3 ’/Pa) n -<br />
Poisson’s Ratio ν 0.5 - E/(6*B) 0.5 - E/(6*B) 0.5 - E/(6*B) 0.5 - E/(6*B) 0.5 - E/(6*B) 0.42<br />
Elastic Shear<br />
Modulus<br />
G, psf E/(2+2v) E/(2+2v) E/(2+2v) E/(2+2v) E/(2+2v) 3.17E+07<br />
Cohesion c’, psf 0 0 0 0 0 100,000<br />
Friction Angle φ’, degree 35 33 30 33 30 0<br />
X:\X_GEO\CHABOT DAM\TASK G -- ENGINEERING REPORT\DRAFT FINAL\DYNAMIC STABILITY ANALYSIS_R4.DOC\30-AUG-05\\OAK 12-5
SECTIONTWELVE<br />
Nonlinear Analyses<br />
Table 12-3<br />
Material Properties for <strong>Dynamic</strong> <strong>Analysis</strong><br />
Wagon Fill Wagon Fill<br />
Foundation<br />
Property Symbol Units Modern Fill Random Fill (D/S and U/S) (Core) Sluiced Fill Soils Bedrock<br />
Poisson’s Ratio (1) ν - 0.36 0.36 0.37, 0.45 0.40, 0.45 0.36, 0.48 0.46 0.42<br />
Shear wave<br />
velocity (2) V s fps 1,200<br />
695*σ' m<br />
0.38<br />
and > 500<br />
Maxim Shear<br />
Modulus G max psf 5.99E+06<br />
2<br />
ρ∗v s<br />
650*σ' m<br />
0.43<br />
and<br />
> 1,000<br />
ρ∗v s<br />
2<br />
600*σ' m<br />
0.43<br />
and > 900<br />
ρ∗v s<br />
2<br />
0.38<br />
695*σ' m<br />
and > 500 1300 2,700<br />
ρ∗v s<br />
2<br />
6.98E+06<br />
3.17E+07<br />
Shear Modulus G psf 0.7*G max 0.7*G max 0.7*G max 0.7*G max 0.7*G max 0.7*G max G max<br />
Rayleigh<br />
<strong>Dam</strong>ping ε min - 3% 3% 3% 3% 3% 3% 0.5%<br />
Rayleigh<br />
<strong>Dam</strong>ping Center<br />
Frequency f min Hz 3 3 3 3 3 3 3<br />
Hysteretic<br />
<strong>Dam</strong>ping - - see note 3 see note 3 see note 3 see note 3 see note 3 see note 3 -<br />
Cohesion c psf 0 0 540 540 0 540 100,000<br />
Friction Angle φ degree 35 33 26.4 26.4 33 26.4 0<br />
Notes:<br />
(1). Dual values correspond to unsaturated and saturated conditions, where applicable.<br />
(2). σ m ' = (σ 1 ' + σ 2 ' +σ 3 ')/3, in ksf<br />
(3). Hysteretic damping is automatically generated and added to the Rayleigh damping in FLAC analyses when materials yield.<br />
X:\X_GEO\CHABOT DAM\TASK G -- ENGINEERING REPORT\DRAFT FINAL\DYNAMIC STABILITY ANALYSIS_R4.DOC\30-AUG-05\\OAK 12-6
Shear Stress Time History<br />
Cyclic Strength<br />
τ<br />
half cycle<br />
CSR = τ cy<br />
/ σ v<br />
0<br />
2τ cy<br />
CSR i<br />
time<br />
N i<br />
log cycles to liquefaction<br />
<strong>Dam</strong>age Increment<br />
∆<br />
i<br />
D = 0. 5<br />
N<br />
Cumulative <strong>Dam</strong>age<br />
D = ∑ ∆D<br />
i<br />
L<br />
i<br />
Pore Pressure Ratio, u g<br />
/σ v<br />
1<br />
0.8<br />
0.6<br />
0.4<br />
0.2<br />
0 0.2 0.4 0.6 0.8 1<br />
<strong>Dam</strong>age<br />
Project No.<br />
<strong>Chabot</strong> <strong>Dam</strong><br />
26814536 Seismic <strong>Stability</strong> <strong>Analysis</strong><br />
FLAC <strong>Analysis</strong><br />
Pore Pressure Generation Model<br />
Figure<br />
12-1<br />
X:\x_geo\<strong>Chabot</strong> <strong>Dam</strong>\Task G - Engineering Report\Figures\Figure 12-1.grf
τ<br />
φ<br />
S r<br />
a<br />
b<br />
σ<br />
Project No.<br />
<strong>Chabot</strong> <strong>Dam</strong><br />
26814536 Seismic <strong>Stability</strong> <strong>Analysis</strong> Mohr-Coulomb and Residual Strength<br />
Envelope<br />
Figure<br />
12-2<br />
X:\x_geo\<strong>Chabot</strong> <strong>Dam</strong>\Task G - Engineering Report\Figures\Figure 12-2.grf
Cyclic cyclic Stress stress Ratio, ratio CSRi<br />
0.5<br />
0.4<br />
0.3<br />
0.2<br />
0.1<br />
(N 1 ) 160cs ) 60-CS<br />
= 10 = 10<br />
⎛ CSR ⎞<br />
15<br />
N 15<br />
⎜<br />
⎟<br />
i<br />
=<br />
⎝ CSRi<br />
⎠<br />
where CSR = 0.11<br />
15<br />
2.05<br />
1≤<br />
N<br />
i<br />
≤<br />
40<br />
0<br />
1 10 100<br />
Number cycles <strong>of</strong> to cycles liquefaction to liquefaction, N i<br />
Project No.<br />
<strong>Chabot</strong> <strong>Dam</strong><br />
26814536 Seismic <strong>Stability</strong> <strong>Analysis</strong><br />
Cyclic Strength <strong>of</strong><br />
Saturated Sluiced Fill<br />
Figure<br />
12-3<br />
X:\x_geo\<strong>Chabot</strong> <strong>Dam</strong>\Task G - Engineering Report\Figures\Figure 12-3.grf
Cyclic Strength<br />
CSR 30 = 0.4<br />
Strength Degradation<br />
Cyclic cyclic Stress stress Ratio, ratio CSRi<br />
0.8<br />
0.7<br />
0.6<br />
0.5<br />
0.4<br />
0.3<br />
0.2<br />
0.1<br />
0<br />
CSR i = 0.85 CSR_30 . 30<br />
1 10 100 1000<br />
Number cycles <strong>of</strong> cycles to r u to = r u 100% = 100%, N i<br />
τ max<br />
/(τ max<br />
) stati c<br />
1<br />
0.8<br />
0.6<br />
0.4<br />
0.2<br />
0<br />
0 0.2 0.4 0.6 0.8 1<br />
pore pressure ratio ,(rr u )<br />
7.41<br />
⎛ CSR ⎞<br />
τ<br />
30<br />
N = 30<br />
⎜<br />
⎟ 1≤<br />
N ≤100<br />
⎝ CSR<br />
( i i<br />
τ ) max<br />
i ⎠<br />
where CSR = 0.4<br />
30<br />
( − r ) 0. 16<br />
max<br />
1<br />
u<br />
static<br />
=<br />
Project No.<br />
26814536<br />
<strong>Chabot</strong> <strong>Dam</strong><br />
Seismic <strong>Stability</strong> <strong>Analysis</strong><br />
Cyclic Strength and Undrained<br />
Strength Degradation <strong>of</strong> Saturated<br />
Wagon Fill and Foundation Soils<br />
Figure<br />
12-4<br />
X:\x_geo\<strong>Chabot</strong> <strong>Dam</strong>\Task G - Engineering Report\Figures\Figure 12-4.grf
acceleration (g)<br />
0.2<br />
0.1<br />
0.0<br />
-0.1<br />
-0.2<br />
0.1<br />
0.0<br />
-0.1<br />
-0.2<br />
0.1<br />
0.0<br />
-0.1<br />
<strong>Dam</strong> Crest (3)<br />
Rock Outcrop (6)<br />
Input Acceleration<br />
-0.2<br />
0 5 10 15 20 25 30<br />
time (seconds)<br />
Project No.<br />
26814536<br />
<strong>Chabot</strong> <strong>Dam</strong><br />
Seismic <strong>Stability</strong> <strong>Analysis</strong><br />
Acceleration at<br />
<strong>Dam</strong> Crest and Rock Outcrop<br />
1989 Loma Prieta Earthquake<br />
Figure<br />
12-5<br />
X:\x_geo\<strong>Chabot</strong> <strong>Dam</strong>\Task G - Engineering Report\Figures\Figure 12-5.grf
Project No.<br />
26814536<br />
<strong>Chabot</strong> <strong>Dam</strong><br />
Seismic <strong>Stability</strong> <strong>Analysis</strong><br />
Excess Pore Pressure Ratio<br />
in Sluiced Fill<br />
1989 Loma Prieta Earthquake<br />
Figure<br />
12-6<br />
X:\x_geo\<strong>Chabot</strong> <strong>Dam</strong>\Task G - Engineering Report\Figures\Figure 12-6.grf
Project No.<br />
26814536<br />
<strong>Chabot</strong> <strong>Dam</strong><br />
Seismic <strong>Stability</strong> <strong>Analysis</strong><br />
Cyclic Degradation <strong>of</strong><br />
Wagon Fill and Foundation Soils<br />
1989 Loma Prieta Earthquake<br />
Figure<br />
12-7<br />
X:\x_geo\<strong>Chabot</strong> <strong>Dam</strong>\Task G - Engineering Report\Figures\Figure 12-7.grf
FLAC (Version 4.00)<br />
Project No.<br />
<strong>Chabot</strong> <strong>Dam</strong><br />
26814536 Seismic <strong>Stability</strong> <strong>Analysis</strong> Calculated Displacement Vectors<br />
1989 Loma Prieta Earthquake<br />
Figure<br />
12-8<br />
X:\x_geo\<strong>Chabot</strong> <strong>Dam</strong>\Task G - Engineering Report\Figures\Figure 12-8.grf
acceleration (g)<br />
1.2<br />
0.6<br />
0.0<br />
-0.6<br />
1.2<br />
0.6<br />
0.0<br />
-0.6<br />
1.2<br />
0.6<br />
0.0<br />
-0.6<br />
<strong>Dam</strong> Crest (3)<br />
Rock Outcrop (6)<br />
Input Acceleration<br />
-1.2<br />
0 5 10 15 20 25 30<br />
time (seconds)<br />
Project No.<br />
26814536<br />
<strong>Chabot</strong> <strong>Dam</strong><br />
Seismic <strong>Stability</strong> <strong>Analysis</strong><br />
Acceleration at<br />
<strong>Dam</strong> Crest and Rock Outcrop<br />
Hayward Fault MCE TH #1<br />
Figure<br />
12-9<br />
X:\x_geo\<strong>Chabot</strong> <strong>Dam</strong>\Task G - Engineering Report\Figures\Figure 12-9.grf
cyclic degradation<br />
1.1<br />
1.0<br />
3<br />
2<br />
0.9 Cyclic Degradation<br />
0.8<br />
1<br />
0.7<br />
0.6<br />
0.5<br />
0 5 10 15 20 25 30<br />
1.0<br />
excess pore<br />
pressure ratio<br />
0.8<br />
0.6<br />
0.4<br />
0.2<br />
Pore Pressure Ratio<br />
4<br />
5<br />
0.0<br />
0 5 10 15 20 25 30<br />
acceleration (g)<br />
1.2<br />
0.8<br />
0.4<br />
0.0<br />
-0.4<br />
-0.8<br />
-1.2<br />
Input Acceleration<br />
0 5 10 15 20 25 30<br />
time (seconds)<br />
Project No.<br />
26814536<br />
<strong>Chabot</strong> <strong>Dam</strong><br />
Seismic <strong>Stability</strong> <strong>Analysis</strong><br />
Time Histories <strong>of</strong> Cyclic Degradation<br />
and Pore Pressure Ratio<br />
Hayward Fault MCE TH #1<br />
Figure<br />
12-10<br />
X:\x_geo\<strong>Chabot</strong> <strong>Dam</strong>\Task G - Engineering Report\Figures\Figure 12-10.grf
JOB TITLE : <strong>Chabot</strong> <strong>Dam</strong> Non-linear <strong>Dynamic</strong> Response <strong>Analysis</strong><br />
(*10^2)<br />
FLAC (Version 4.00)<br />
Cyclic Degradation <strong>of</strong> Wagon Fill<br />
7.000<br />
LEGEND<br />
1-Feb-05 1:45<br />
step 868525<br />
Cons. Time 6.2628E+08<br />
-5.583E+02
FLAC (Version 4.00)<br />
Project No.<br />
<strong>Chabot</strong> <strong>Dam</strong><br />
26814536 Seismic <strong>Stability</strong> <strong>Analysis</strong> Calculated Displacement Vectors<br />
Hayward Fault MCE TH #1<br />
Figure<br />
12-12<br />
X:\x_geo\<strong>Chabot</strong> <strong>Dam</strong>\Task G - Engineering Report\Figures\Figure 12-12.grf
displacement (ft)<br />
4<br />
3<br />
2<br />
1<br />
0<br />
Horizontal Displacement<br />
5<br />
-1<br />
3<br />
<strong>Dam</strong> Crest<br />
1 2<br />
-2<br />
0 5 10 15 20 25 30<br />
time (seconds)<br />
4<br />
acceleration (g)<br />
1.2<br />
0.8<br />
Input Acceleration<br />
0.4<br />
0.0<br />
-0.4<br />
-0.8<br />
-1.2<br />
0 5 10 15 20 25 30<br />
time (seconds)<br />
Project No.<br />
26814536<br />
<strong>Chabot</strong> <strong>Dam</strong><br />
Seismic <strong>Stability</strong> <strong>Analysis</strong><br />
Calculated Horizontal Displacement<br />
Time Histories<br />
Hayward Fault MCE TH #1<br />
Figure<br />
12-13<br />
X:\x_geo\<strong>Chabot</strong> <strong>Dam</strong>\Task G - Engineering Report\Figures\Figure 12-13.grf
0.5<br />
displacement (ft)<br />
0<br />
-0.5<br />
-1<br />
-1.5<br />
Vertical Displacement<br />
1<br />
2<br />
3<br />
4<br />
<strong>Dam</strong> Crest<br />
acceleration (g)<br />
-2<br />
0 5 10 15 20 25 30<br />
time (seconds)<br />
1.2<br />
0.8 Input Acceleration<br />
0.4<br />
0.0<br />
-0.4<br />
-0.8<br />
-1.2<br />
0 5 10 15 20 25 30<br />
time (seconds)<br />
5<br />
Project No.<br />
26814536<br />
<strong>Chabot</strong> <strong>Dam</strong><br />
Seismic <strong>Stability</strong> <strong>Analysis</strong><br />
Calculated Vertical Displacement<br />
Time Histories<br />
Hayward Fault MCE TH #1<br />
Figure<br />
12-14<br />
X:\x_geo\<strong>Chabot</strong> <strong>Dam</strong>\Task G - Engineering Report\Figures\Figure 12-14.grf
FLAC (Version 4.00)<br />
Post-Shaking <strong>Stability</strong> <strong>Analysis</strong> (downstream)<br />
FOS = 1.81<br />
URS<br />
Oakland<br />
Project No.<br />
26814536<br />
<strong>Chabot</strong> <strong>Dam</strong><br />
Seismic <strong>Stability</strong> <strong>Analysis</strong><br />
Post-Earthquake <strong>Stability</strong> <strong>of</strong><br />
Downstream Slope<br />
Hayward Fault MCE TH #1<br />
Figure<br />
12-15<br />
X:\x_geo\<strong>Chabot</strong> <strong>Dam</strong>\Task G - Engineering Report\Figures\Figure 12-15.grf
FLAC (Version 4.00)<br />
Post-Shaking <strong>Stability</strong> <strong>Analysis</strong> (upstream)<br />
FOS = 2.08<br />
URS<br />
Oakland<br />
Project No.<br />
26814536<br />
<strong>Chabot</strong> <strong>Dam</strong><br />
Seismic <strong>Stability</strong> <strong>Analysis</strong><br />
Post-Earthquake <strong>Stability</strong> <strong>of</strong><br />
Upstream Slope<br />
Hayward Fault MCE TH #1<br />
Figure<br />
12-16<br />
X:\x_geo\<strong>Chabot</strong> <strong>Dam</strong>\Task G - Engineering Report\Figures\Figure 12-16.grf
SECTIONTHIRTEEN<br />
Expected <strong>Dam</strong> Performance<br />
13. Section 13 THIRTEEN Expected <strong>Dam</strong> Performance<br />
The expected performance <strong>of</strong> the dam during the design earthquake was evaluated based on the<br />
analyses presented in Sections 11 and 12. Overall, the analyses indicate that the dam will<br />
experience deformations during such earthquake, but will remain stable. No liquefaction <strong>of</strong> the<br />
wagon fill is expected because <strong>of</strong> its overall clayey nature, but the earthquake is likely to induce<br />
high excess pore pressures in these materials with accompanying strength reduction. Likewise,<br />
no liquefaction <strong>of</strong> the foundation soils is expected, except possibly in isolated pockets <strong>of</strong> sands<br />
and gravels. Such pockets appear to be confined primarily to near the stream channel and are<br />
unlikely to affect the overall stability <strong>of</strong> the dam. The sluiced fill at the downstream toe <strong>of</strong> the<br />
dam is expected to liquefy early in the strong shaking phase <strong>of</strong> the earthquake and to deform<br />
subsequently.<br />
The Newmark analyses for the Hayward fault MCE result in calculated downward displacements<br />
<strong>of</strong> the crest less than about 6 feet. The FLAC analyses result in downward crest displacements<br />
less than 1.5 feet. Considering the limitations <strong>of</strong> the methods <strong>of</strong> analysis, the best estimate <strong>of</strong> the<br />
maximum crest vertical displacements is between 1.5 and 3.5 feet. These settlements correspond<br />
to about 1.1% to 2.5% <strong>of</strong> the structural dam height. Such settlement estimates are generally<br />
consistent with the past seismic performance <strong>of</strong> embankment dams (URS, 2001), considering the<br />
age <strong>of</strong> <strong>Chabot</strong> <strong>Dam</strong> and the methods used for its construction.<br />
Horizontal displacements <strong>of</strong> up to about 12 feet are calculated from the Newmark analyses for<br />
sliding blocks near the upstream face <strong>of</strong> the dam, but such blocks do not extend into the main<br />
body <strong>of</strong> the embankment and do not reach across the dam crest. Horizontal displacements <strong>of</strong> less<br />
than 2 feet are calculated from the FLAC analyses. The best estimate <strong>of</strong> horizontal<br />
displacements <strong>of</strong> the upstream slope is less than 5 feet. Because the calculated displacements are<br />
limited and the blocks will remain stable, progressive sliding <strong>of</strong> the dam and instability <strong>of</strong> the<br />
crest are not expected to occur.<br />
Except for the sluiced fill, horizontal displacements <strong>of</strong> the downstream slope are expected to be<br />
less than 2 feet. Horizontal displacements <strong>of</strong> about 4 feet are calculated for a sliding block that<br />
primarily encompasses the sluiced fill. However, displacements <strong>of</strong> several feet may occur in the<br />
sluiced fill in the direction <strong>of</strong> the downstream channel. The stability analyses indicate that such<br />
displacements, however, are unlikely to lead to instability <strong>of</strong> the main body <strong>of</strong> the embankment.<br />
Because the dam has a freeboard <strong>of</strong> about 23 feet, the estimated crest settlements will not lead to<br />
overtopping <strong>of</strong> the embankment. The dam deformations are also not expected to affect the<br />
structural integrity <strong>of</strong> the spillway since it is founded on rock. Likewise, they will not affect the<br />
outlet works. However, the estimated settlements and horizontal deformations will likely result<br />
in cracking <strong>of</strong> the dam embankment.<br />
Based on the calculated deformations and the observed performance <strong>of</strong> similar embankment<br />
dams during past earthquakes, cracking is expected to develop primarily near the crest.<br />
Longitudinal cracks can be expected to form at the crest in response to the tendency for<br />
spreading caused by lateral deformation <strong>of</strong> the embankment. Settlements <strong>of</strong> the embankment<br />
may also lead to transverse cracking at the crest. Transverse cracking is most likely to develop<br />
near the abutments because <strong>of</strong> their steep nature, although it can develop elsewhere along the<br />
crest in response to possible differential settlements. Transverse cracking is <strong>of</strong> particular concern<br />
as it could provide a mechanism for leakage, if it were to extend below the reservoir level and to<br />
be continuous from the reservoir to the downstream slope or to be interconnected with<br />
longitudinal cracking in pathways across the dam crest.<br />
X:\X_GEO\CHABOT DAM\TASK G -- ENGINEERING REPORT\DRAFT FINAL\DYNAMIC STABILITY ANALYSIS_R4.DOC\30-AUG-05\\OAK 13-1
SECTIONTHIRTEEN<br />
Expected <strong>Dam</strong> Performance<br />
The extent and depth <strong>of</strong> cracking are difficult to estimate accurately, although they can be<br />
roughly assessed by comparison with the past performance <strong>of</strong> other embankment dams.<br />
Published compilations <strong>of</strong> the past seismic performance <strong>of</strong> embankment dams (e.g. Fong and<br />
Bennett, 1995) suggest that the depth <strong>of</strong> transverse cracking is roughly correlated to the<br />
maximum amount <strong>of</strong> crest settlement. However, the maximum depth <strong>of</strong> cracking will be<br />
constrained by the nature and strength <strong>of</strong> the embankment materials near the crest and their<br />
ability to support open cracks.<br />
The performance <strong>of</strong> Austrian <strong>Dam</strong> during the 1989 Loma Prieta earthquake is a relevant case<br />
history to the assessment <strong>of</strong> potential cracking at <strong>Chabot</strong> <strong>Dam</strong> during the design earthquake.<br />
Austrian <strong>Dam</strong>, a 185-foot-high embankment, experienced transverse and longitudinal cracking<br />
during the Loma Prieta earthquake, a magnitude 6.9 event. That dam was subjected to ground<br />
motions with a peak horizontal acceleration <strong>of</strong> about 0.6 g and experienced crest settlements <strong>of</strong><br />
up to 2.9 feet. Fong and Bennett (1995) report that transverse cracking developed across the<br />
crest at the dam abutments to a depth <strong>of</strong> about 16 feet. USCOLD (1992) reports that a transverse<br />
crack was traced 30 feet down the left abutment, where the dam had been constructed on highly<br />
fractured rock, and that transverse cracking and embankment separation from the spillway<br />
structure occurred to a depth <strong>of</strong> 23 feet on the right abutment.<br />
The potential for developing through-going transverse cracks at <strong>Chabot</strong> <strong>Dam</strong> will be tempered<br />
by the considerable width <strong>of</strong> the embankment (about 150 feet at the elevation <strong>of</strong> the spillway<br />
crest). In addition, the likelihood <strong>of</strong> leakage will be a function <strong>of</strong> the reservoir level at the time<br />
<strong>of</strong> the earthquake (over the last 5 years, EBMUD readings show that reservoir levels have<br />
remained 1 to 6 feet below spillway crest elevation). Nonetheless, transverse cracking that<br />
extends below the reservoir elevation, even if not fully continuous across the embankment,<br />
would increase seepage and the potential for leakage immediately after the earthquake. On this<br />
basis and given that the dam lacks an internal filter and drainage system to safely control<br />
possible leakage and its consequent effects, it may be concluded that the potential for transverse<br />
cracking represents a risk regarding the safety <strong>of</strong> the structure.<br />
No active faults underlie the dam and the potential for sympathetic movement on faults passing<br />
beneath the dam is judged to be very small. Nonetheless, previous studies have concluded that if<br />
sympathetic movement were to occur on those faults in response to a large earthquake on the<br />
Hayward fault, such movement would be less than 1 foot (Marliave, 1978; WCC, 1978), and the<br />
dam would be able to safely withstand the effects <strong>of</strong> such movement (EBMUD, 1978). Those<br />
earlier conclusions seem reasonable in light <strong>of</strong> the investigations reported herein.<br />
The analyses for the San Andreas fault MCE result in a dynamic response <strong>of</strong> the embankment<br />
lower than that calculated for the Hayward fault MCE. Nonetheless, liquefaction and<br />
deformations <strong>of</strong> the sluiced fill are also expected to occur during the San Andreas fault MCE.<br />
The calculated dam deformations for the San Andreas event are lower than those for the<br />
Hayward event. Thus, the results <strong>of</strong> the analyses indicate that the San Andreas event is less<br />
critical than the Hayward event regarding the seismic stability <strong>of</strong> the dam.<br />
In summary, the results <strong>of</strong> the seismic stability analyses indicate that the dam is likely to undergo<br />
deformations, including crest settlements <strong>of</strong> a few feet, during the Hayward fault MCE.<br />
However, the dam is expected to remain stable after the earthquake. Gross instability <strong>of</strong> the<br />
main embankment is unlikely to occur, although displacements <strong>of</strong> several feet may develop in<br />
the sluiced fill downstream <strong>of</strong> the dam. Likewise, horizontal displacements <strong>of</strong> up to about 5 feet<br />
X:\X_GEO\CHABOT DAM\TASK G -- ENGINEERING REPORT\DRAFT FINAL\DYNAMIC STABILITY ANALYSIS_R4.DOC\30-AUG-05\\OAK 13-2
SECTIONTHIRTEEN<br />
Expected <strong>Dam</strong> Performance<br />
may occur in the near-surface upstream slope. The expected displacements will be associated<br />
with damage and cracking <strong>of</strong> the embankment but will not affect the integrity <strong>of</strong> the spillway or<br />
the outlet works.<br />
X:\X_GEO\CHABOT DAM\TASK G -- ENGINEERING REPORT\DRAFT FINAL\DYNAMIC STABILITY ANALYSIS_R4.DOC\30-AUG-05\\OAK 13-3
SECTIONFOURTEEN<br />
Conclusions<br />
14. Section 14 FOURTEEN Conclusions<br />
The purpose <strong>of</strong> this study was to evaluate the seismic stability <strong>of</strong> <strong>Chabot</strong> <strong>Dam</strong>. The study<br />
included a review <strong>of</strong> previous engineering investigations and geologic studies <strong>of</strong> the dam,<br />
geologic mapping <strong>of</strong> the site, field exploration and laboratory testing <strong>of</strong> the embankment and<br />
foundation materials, evaluation <strong>of</strong> the design earthquake ground motions, analyses <strong>of</strong> seismic<br />
stability and deformations, and assessment <strong>of</strong> the overall expected seismic performance <strong>of</strong> the<br />
dam. The main conclusions from the study are summarized as follows.<br />
The main body <strong>of</strong> the dam is composed <strong>of</strong> so-called “wagon fill,” which consists predominantly<br />
<strong>of</strong> clayey sands and sandy clays with gravel, placed and compacted by teams <strong>of</strong> horses and<br />
wagons. The wagon fill is buttressed at the downstream toe with “sluiced fill” consisting<br />
primarily <strong>of</strong> clayey and silty sands with gravel, with interspersed lenses <strong>of</strong> clays and gravelly<br />
sands. Modern engineered fill was placed in 1980 on the crest and downstream slope <strong>of</strong> the<br />
embankment to raise the dam by 7 feet to its current configuration.<br />
The thickness <strong>of</strong> foundation soils near the stream channel is generally less than 10 feet. A wedge<br />
<strong>of</strong> foundation soils 20 to 25 feet thick underlies the embankment east <strong>of</strong> the stream channel. A<br />
similar wedge underlies the downstream toe area on the west side. The materials consist<br />
primarily <strong>of</strong> clayey sands and sandy clays with gravel, similar to the wagon fill materials.<br />
Occasional pockets <strong>of</strong> sand and gravels are encountered primarily near the stream channel.<br />
The site is underlain by Mesozoic rocks consisting <strong>of</strong> shale and siltstone beneath the dam<br />
upstream shell; rhyolite beneath the midsection <strong>of</strong> the dam; and basalt, serpentinite, and gabbro<br />
beneath the downstream shell. Faults within and between these rocks formed prior to the late<br />
Cenozoic and are no longer active. No weaknesses that could affect the stability <strong>of</strong> the dam have<br />
been previously mapped in the bedrock, and from a stability viewpoint the rock mass is much<br />
stronger than the embankment and foundation soils.<br />
The dam is located within 0.5 km <strong>of</strong> the Hayward fault and 30 km <strong>of</strong> the San Andreas fault. The<br />
Hayward-Rodgers Creek fault is judged capable <strong>of</strong> generating a maximum earthquake <strong>of</strong><br />
magnitude M w 7¼. The San Andreas fault is judged capable <strong>of</strong> a M w 8 earthquake. In<br />
accordance with DSOD guidelines, the ground motions from these earthquakes were estimated at<br />
the 84 th -percentile level. The ground motions for the MCE on the Hayward fault are associated<br />
with a peak horizontal ground acceleration (PGA) <strong>of</strong> 1.05 g whereas those for the San Andreas<br />
fault MCE correspond to a PGA <strong>of</strong> 0.33 g. No active faults underlie the dam and the potential<br />
for sympathetic movement on faults passing beneath the dam is judged to be very small.<br />
Because <strong>of</strong> their clayey nature, the wagon fill materials will exhibit cohesive behavior under<br />
earthquake shaking and are not susceptible to liquefaction. However, they may develop excess<br />
pore pressures and undergo strength loss under strong earthquake shaking. Pockets <strong>of</strong> sands and<br />
silty sands within the wagon fill are <strong>of</strong> limited extent and will not affect the strength <strong>of</strong> the<br />
overall zone. The sluiced fill is likely to exhibit cohesionless behavior and is likely to liquefy<br />
under strong earthquake shaking. Its liquefaction resistance is best assessed in terms <strong>of</strong> its SPT<br />
resistance. Because <strong>of</strong> their clayey nature, the foundation soils are also not susceptible to<br />
liquefaction, except for interspersed pockets <strong>of</strong> sands and gravels. However, such pockets seem<br />
confined primarily to the stream channel, and are unlikely to affect the overall stability <strong>of</strong> the<br />
dam.<br />
The results <strong>of</strong> the analysis indicate adequate factors <strong>of</strong> safety for the upstream and downstream<br />
slopes under long-term static conditions, in good agreement with the known long-term stability<br />
X:\X_GEO\CHABOT DAM\TASK G -- ENGINEERING REPORT\DRAFT FINAL\DYNAMIC STABILITY ANALYSIS_R4.DOC\30-AUG-05\\OAK 14-1
SECTIONFOURTEEN<br />
Conclusions<br />
<strong>of</strong> the dam. The dam should perform satisfactorily during relatively minor earthquakes that do<br />
not trigger liquefaction <strong>of</strong> the sluiced fill or generate high pore pressures within the wagon fill.<br />
The dam is likely to undergo deformations, including crest settlements <strong>of</strong> a few feet, during the<br />
Hayward fault MCE. However, the dam is expected to remain stable after the earthquake. Gross<br />
instability <strong>of</strong> the main embankment is unlikely to occur, although displacements <strong>of</strong> several feet<br />
may develop in the sluiced fill downstream <strong>of</strong> the dam. Likewise, horizontal displacements <strong>of</strong><br />
up to about 5 feet may occur in the near-surface upstream slope.<br />
Crest settlements induced by the Hayward fault MCE are likely to be less than about 6 feet. The<br />
best estimate <strong>of</strong> the maximum settlements is between 1.5 and 3.5 feet. Such settlements<br />
correspond to about 1.1% to 2.5% <strong>of</strong> the structural dam height. Except for the sluiced fill,<br />
horizontal displacements <strong>of</strong> the downstream slope are expected to be less than 2 feet.<br />
Because the dam has a freeboard <strong>of</strong> about 23 feet, the estimated crest settlements will not lead to<br />
overtopping <strong>of</strong> the embankment. However, the expected deformations will be associated with<br />
damage and cracking <strong>of</strong> the embankment and may require drawdown <strong>of</strong> the reservoir<br />
immediately after the earthquake. The estimated dam deformations are not expected to affect the<br />
structural integrity <strong>of</strong> the spillway or outlet works.<br />
Transverse cracking <strong>of</strong> the crest is most likely to develop near the abutments and could provide a<br />
mechanism for leakage, if it were to extend below the reservoir level and be continuous across<br />
the dam embankment. The potential for developing through-going transverse cracks will be<br />
tempered by the width <strong>of</strong> the embankment. Nonetheless, transverse cracking that extends below<br />
the reservoir elevation, even if not continuous across the embankment, would increase seepage<br />
and the potential for leakage immediately after the earthquake. Because the dam lacks an<br />
internal filter and drainage system, the potential for transverse cracking represents a risk<br />
regarding the safety <strong>of</strong> the dam.<br />
Liquefaction and deformations <strong>of</strong> the sluiced fill are also expected to occur during the San<br />
Andreas fault MCE. The calculated dam deformations for the San Andreas event are lower than<br />
those for the Hayward event. Thus, the San Andreas event is less critical than the Hayward<br />
event regarding the seismic stability <strong>of</strong> the dam.<br />
The calculated response <strong>of</strong> the dam for motions representative <strong>of</strong> those expected to have<br />
occurred at the site during the 1989 Loma Prieta earthquake is in good agreement with the<br />
known performance <strong>of</strong> the dam during that earthquake.<br />
X:\X_GEO\CHABOT DAM\TASK G -- ENGINEERING REPORT\DRAFT FINAL\DYNAMIC STABILITY ANALYSIS_R4.DOC\30-AUG-05\\OAK 14-2
SECTIONFIFTEEN<br />
References<br />
15. Section 15 FIFTEEN References<br />
Abrahamson, N.A. (1993). “Non-Stationary Spectral Matching Program RSPMATCH,”<br />
Unpublished Report, July.<br />
Abrahamson, N.A. and Silva, W.J. (1997). “Empirical response spectral attenuation relations for<br />
shallow crustal earthquakes,” Seismological Research Letters, v. 68, p. 94-127.<br />
Abrahamson, N.A. (2000) “Effects <strong>of</strong> rupture directivity on probabilistic seismic hazard<br />
analysis,” Proceedings <strong>of</strong> the 6 th International conference on Seismic Zonation, Palm<br />
Springs, California.<br />
Andrews, D. and Martin, G.R. (2000) “Criteria for liquefaction susceptibility <strong>of</strong> silty soils,” Proc.<br />
12 th World Conference on Earthquake Engineering, Auckland, New Zealand.<br />
Boore, D.M., Joyner, W.B., and Fumal, T.E. (1997). “Equations for estimating horizontal<br />
response spectra and peak acceleration from western North American earthquakes: A<br />
summary <strong>of</strong> recent work,” Seismological Research Letters, v. 68, p. 128-153.<br />
Boulanger, R.W. and Idriss, I.M. (2004). “Evaluating the potential for liquefaction or cyclic<br />
failure <strong>of</strong> silts and clays,” Center for Geotechnical Modeling, Report No. UCD/CGM-<br />
04/01, University <strong>of</strong> California, Davis, December.<br />
Bray, J.D. et al. (2001) “Ground failure in Adapazari, Turkey,” Proc., Earthquake Geotechnical<br />
Engineering Satellite Conference <strong>of</strong> the XVth International Conference on Soil<br />
Mechanics and Geotechnical Engineering, Istanbul, Turkey, August.<br />
Duncan, J.M., Wright, S.G. and Wong, K.S. (1990) “Slope stability during rapid drawdown,”<br />
Proc., H.B. Seed Memorial Symp., BiTech, Vancouver, B.C., (2), 253-272.<br />
EBMUD (1978) “<strong>Chabot</strong> <strong>Dam</strong> and sympathetic fault movement,” Letter to J. Doody <strong>of</strong> DSOD<br />
from D. Larkin <strong>of</strong> EBMUD, dated October 31.<br />
Fong, F.C. and Bennett, W.J. (1995) “Transverse cracking on embankment dams due to<br />
earthquakes,” presented at the Association <strong>of</strong> State <strong>Dam</strong> Safety Officials (ASDSO)<br />
Western Regional Seminar and Conference, Red Lodge, Montana, May.<br />
Fraser, W.A. and Howard, J.K. (2002), “Guidelines for use <strong>of</strong> the Consequence-Hazard Matrix<br />
and selection <strong>of</strong> ground motion parameters,” The Resources Agency, Department <strong>of</strong><br />
Water Resources, Division <strong>of</strong> Safety <strong>of</strong> <strong>Dam</strong>s.<br />
Fumal, T.E. (1978). “Correlations between seismic wave velocities and physical properties <strong>of</strong><br />
near-surface geologic materials in the southern San Francisco <strong>Bay</strong> region, California,”<br />
Open-file Report 78-1067, National Center for Earthquake Research, United States<br />
Department <strong>of</strong> the Interior Geological Survey.<br />
Itasca, (2000). “FLAC, fast lagrangian analysis <strong>of</strong> continua, version 4.0, user’s guide,” Itasca<br />
Consulting Group, Inc., Thrasher Square <strong>East</strong>, 708 South Third Street, Suite 310,<br />
Minneapolis, Minnesota.<br />
Hudson M., Idriss, I.M. and Beikae, M. (1994) “User’s manual for QUAD4M,” Department <strong>of</strong><br />
Civil and Environmental Engineering, University <strong>of</strong> California, Davis, California,<br />
May.<br />
X:\X_GEO\CHABOT DAM\TASK G -- ENGINEERING REPORT\DRAFT FINAL\DYNAMIC STABILITY ANALYSIS_R4.DOC\30-AUG-05\\OAK 15-1
SECTIONFIFTEEN<br />
References<br />
Harder, L.F. and Seed, H.B. (1986) “Determination <strong>of</strong> penetration resistance <strong>of</strong> coarse-grained<br />
soils using the Becker hammer drill,” Earthquake Engineering Research Center, Report<br />
No. UCB/EERC-86/06, University <strong>of</strong> California, Berkeley.<br />
Harder, L.F. and Boulanger, R.W. (1997) “Application <strong>of</strong> K σ and K α Correction Factors,”<br />
Proceedings <strong>of</strong> the NCEER Workshop on Evaluation <strong>of</strong> Liquefaction Resistance <strong>of</strong><br />
Soils, Report NCEER-97-0022, National Center for Earthquake Engineering Research,<br />
SUNY Buffalo, N.Y., pp. 41-87.<br />
Idriss, I.M. (1985) “Evaluating seismic risk in engineering practice,” Proceedings 11 th<br />
International Conference on Soil Mechanics and Foundation Engineering, San<br />
Francisco, August.<br />
Idriss, I.M. (2002) “Evaluation <strong>of</strong> liquefaction potential during earthquakes,” personal<br />
communication.<br />
Idriss, I.M. and Boulanger, R.W. (2002) “Estimating K α for use in evaluating cyclic resistance <strong>of</strong><br />
sloping ground,” Proceedings <strong>of</strong> the 8 th U.S.-Japan Workshop on Earthquake<br />
Resistance Design <strong>of</strong> Lifeline Facilities and Countermeasures Against Liquefaction,<br />
Tokyo, Japan, December.<br />
Lee, K.L. and Focht, J.A. (1976) “Strength <strong>of</strong> clay subjected to cyclic loading,” Marine<br />
Geotechnology, <strong>Vol</strong> 1, No. 3, pp 165-185.<br />
Lilhanand, K. and Tseng, W.S. (1988). “Development and application <strong>of</strong> realistic earthquake<br />
time histories compatible with multiple-damping design spectra,” Proceeding <strong>of</strong> the 9 th<br />
World Conference on Earthquake Engineering, Tokyo-Kyoto, Japan, August.<br />
Lienkaemper, J.J. (1992) “Map <strong>of</strong> recently active traces <strong>of</strong> the Hayward fault, Alameda and<br />
Contra Costa Counties, California,” USGS Miscellaneous Field Studies Map MF-2196.<br />
Marliave, C. (1933) “Geological report on chabot dam situated on San Leandro Creek in<br />
Alameda County,” report prepared for State <strong>of</strong> California, Department <strong>of</strong> Public<br />
Works, Division <strong>of</strong> Water Resources, August.<br />
Marliave, B. H. (1978), “<strong>Chabot</strong> dam and sympathetic movement on the Hayward fault,” letter<br />
report to EBMUD, September.<br />
Mejia, L.H. (1989) “Three-dimensional stability <strong>of</strong> an old dam,” Proceedings 12 th International<br />
Conference on Soil Mechanics and Foundation Engineering, Rio de Janeiro, August.<br />
Sadigh, K., Chang, C.Y., Egan, J.A., Makdisi, F., and Youngs, R.R. (1997). “Attenuation<br />
relationships for shallow crustal earthquakes based on California strong motion data,”<br />
Seismological Research Letters, v. 68, p. 180-189.<br />
Schnabel, P.B., Lysmer, J. and Seed, H.B. (1982) “SHAKE: A computer program for earthquake<br />
response analysis <strong>of</strong> horizontally layered sites,” Report No. UC/EERC-72/12,<br />
Earthquake Engineering Research Center, University <strong>of</strong> California, Berkeley,<br />
December.<br />
Seed, H.B., and Idriss, I.M, (1970). “Soil moduli and damping factors for dynamic response<br />
analyses,” Report No. EERC 70-10, Earthquake Engineering Research Center,<br />
University <strong>of</strong> California, Berkeley.<br />
X:\X_GEO\CHABOT DAM\TASK G -- ENGINEERING REPORT\DRAFT FINAL\DYNAMIC STABILITY ANALYSIS_R4.DOC\30-AUG-05\\OAK 15-2
SECTIONFIFTEEN<br />
References<br />
Seed, H.B. (1979) “Soil liquefaction and cyclic mobility evaluation for level ground during<br />
earthquakes,” Journal <strong>of</strong> the Geotechnical Engineering Division, ASCE, <strong>Vol</strong>. 105 No.<br />
GT2, pp 201-255.<br />
Seed, H.B. (1979) “Considerations in the earthquake-resistant design <strong>of</strong> earth and rockfill dams,”<br />
Geotechnique, 29(3), Sept., pp 215-263.<br />
Seed, H.B. and Idriss, I.M. (1982) “Ground motions and soil liquefaction during earthquakes,”<br />
EERI Monograph, Earthquake Engineering Research Institute.<br />
Seed, R.B., Cetin, K.O., Moss, R.E.S., Kammerer, A., Wu, J., Pestana, J., Riemer, M., Sancio,<br />
R.B., Bray, J.D., Kayen, R.E. and Faris, A. (2003) "Recent advances in soil<br />
liquefaction engineering: a unified and consistent framework," Report No. EERC<br />
2003-06, (originally presented at 26 th Annual ASCE Los Angeles Geotechnical Spring<br />
Seminar, Keynote Presentation, H.M.S. Queen Mary, April 30, 2003, Long Beach,<br />
CA), Earthquake Engineering Research Center, University <strong>of</strong> California, Berkeley,<br />
June.<br />
Shannon & Wilson, Inc. (1965) “Review <strong>of</strong> stability, <strong>Chabot</strong> <strong>Dam</strong>,” report prepared for<br />
EBMUD, September.<br />
Somerville, P.G., Smith, N.F., Graves, R.W., and Abrahamson, N.A. (1997). “Modification <strong>of</strong><br />
empirical strong ground motion attenuation relations to include the amplitude and<br />
duration effects <strong>of</strong> rupture directivity,” Seismological Research Letters, V. 68, n.1, pp.<br />
199-222.<br />
Sy, A. and Campanella, R.G. (1994) “Becker and standard penetration tests (BPT-SPT)<br />
correlations with consideration <strong>of</strong> casing friction”, Canadian Geotechnical Journal, V.<br />
31, 343-356.<br />
Thiers, G.R. and Seed, H.B. (1969) “Strength and stress-strain characteristics <strong>of</strong> clays subjected<br />
to seismic loads,” Symposium on Vibration Effects <strong>of</strong> Earthquakes on soils and<br />
Foundations, ASTM STP 450, pp 3-56.<br />
URS (2001) “Seismic safety assessment and prioritization studies <strong>of</strong> Waitaki hydroelectric<br />
system dams, Phase 2, Task 31100 – Updated review <strong>of</strong> embankment dam seismic<br />
performance,” Client report prepared for Meridian Energy Ltd., March.<br />
USCOLD (1992) “Observed Performance <strong>of</strong> <strong>Dam</strong>s During Earthquakes,” Report prepared by<br />
USCOLD Committee on Earthquakes, United States Committee on Large <strong>Dam</strong>s, July.<br />
Wells, D.L. and Coppersmith, K.J., (1994) “New empirical relationships among magnitude,<br />
rupture length, rupture width, rupture area, and surface displacement,” Bulletin <strong>of</strong> the<br />
Seismological Society <strong>of</strong> America, v. 84, p. 974-1002.<br />
Woodward-Lundgren & Associates (1974) “Evaluation <strong>of</strong> the seismic stability <strong>of</strong> <strong>Chabot</strong> <strong>Dam</strong>,”<br />
report prepared for EBMUD, May.<br />
Woodward-Clyde Consultants (1977) “Evaluation <strong>of</strong> seismic stability <strong>of</strong> <strong>Chabot</strong> <strong>Dam</strong><br />
modification,” Client report prepared for EBMUD, August.<br />
Woodward-Clyde Consultants (1978) “Potential for sympathetic fault displacement, <strong>Chabot</strong> fault<br />
and cross fault traces,” Letter report submitted to EBMUD, dated October 5.<br />
X:\X_GEO\CHABOT DAM\TASK G -- ENGINEERING REPORT\DRAFT FINAL\DYNAMIC STABILITY ANALYSIS_R4.DOC\30-AUG-05\\OAK 15-3
SECTIONFIFTEEN<br />
References<br />
Woodward-Clyde Consultants (1979) “Geologic inspection, <strong>Chabot</strong> <strong>Dam</strong>, Alameda County,<br />
California,” letter report prepared for EBMUD, September.<br />
Woodward-Clyde Consultants (1989) “Seismic Safety Evaluation, Lake Madigan <strong>Dam</strong>, Solano<br />
County, California,” Client report prepared for City <strong>of</strong> Vallejo, July.<br />
Wright, S.G. (1991) “UTEXAS3, a computer program for slope stability calculations,” Shinoak<br />
S<strong>of</strong>tware, Austin, Texas.<br />
Youd, T.L., Idriss, I.M., Andrus, R.D., Arango, I., Castro, G., Christian, J.T., Dobry, R., Finn,<br />
W.D., Harder, L.F., Hynes, M.E., Ishihara, K., Koester, J.P., Liao, S., Marcuson, W.F.,<br />
Martin, G.R., Mitchell, J.K., Moriwaki, Y., Power, M.S., Robertson, P.K., Seed, R.B.,<br />
and Stokoe. K.H. (2001) “Liquefaction resistance <strong>of</strong> soils: Summary report from the<br />
1996 NCEER and 1998 NCEER/NSF workshops on evaluation <strong>of</strong> liquefaction<br />
resistance <strong>of</strong> soils,” Journal <strong>of</strong> Geotechnical and Geoenvironmental Engineering,<br />
ASCE, 124(10).<br />
X:\X_GEO\CHABOT DAM\TASK G -- ENGINEERING REPORT\DRAFT FINAL\DYNAMIC STABILITY ANALYSIS_R4.DOC\30-AUG-05\\OAK 15-4