Lab write-up checklist and rubric
Lab write-up checklist and rubric
Lab write-up checklist and rubric

Create successful ePaper yourself
Turn your PDF publications into a flip-book with our unique Google optimized e-Paper software.
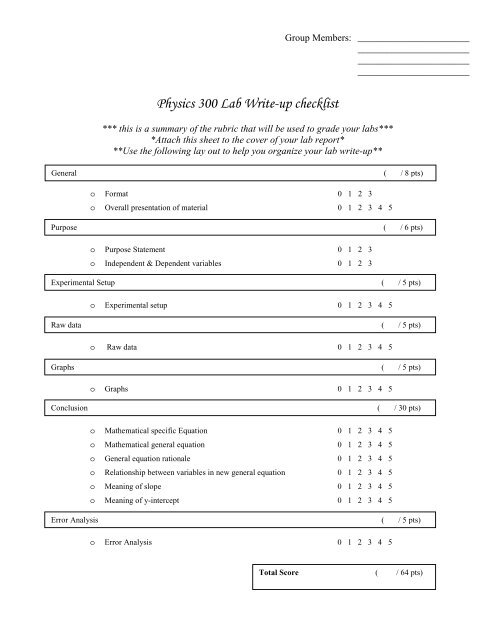
Gro<strong>up</strong> Members: _______________________<br />
_______________________<br />
_______________________<br />
_______________________<br />
Physics 300 <strong>Lab</strong> Write-<strong>up</strong> <strong>checklist</strong><br />
*** this is a summary of the <strong>rubric</strong> that will be used to grade your labs***<br />
*Attach this sheet to the cover of your lab report*<br />
**Use the following lay out to help you organize your lab <strong>write</strong>-<strong>up</strong>**<br />
General ( / 8 pts)<br />
o Format 0 1 2 3<br />
o Overall presentation of material 0 1 2 3 4 5<br />
Purpose<br />
o<br />
( / 6 pts)<br />
o Purpose Statement 0 1 2 3<br />
o Independent & Dependent variables 0 1 2 3<br />
Experimental Set<strong>up</strong> ( / 5 pts)<br />
o Experimental set<strong>up</strong> 0 1 2 3 4 5<br />
Raw data ( / 5 pts)<br />
o Raw data 0 1 2 3 4 5<br />
Graphs ( / 5 pts)<br />
o Graphs 0 1 2 3 4 5<br />
Conclusion ( / 30 pts)<br />
o Mathematical specific Equation 0 1 2 3 4 5<br />
o Mathematical general equation 0 1 2 3 4 5<br />
o General equation rationale 0 1 2 3 4 5<br />
o Relationship between variables in new general equation 0 1 2 3 4 5<br />
o Meaning of slope 0 1 2 3 4 5<br />
o Meaning of y-intercept 0 1 2 3 4 5<br />
Error Analysis ( / 5 pts)<br />
o Error Analysis 0 1 2 3 4 5<br />
Total Score ( / 64 pts)
Criteria<br />
Format<br />
Overall<br />
presentation of<br />
information<br />
Purpose<br />
Statement<br />
Independent &<br />
Dependent<br />
variables<br />
Experimental<br />
Set<strong>up</strong><br />
Raw Data<br />
Graphs<br />
Mathematical<br />
specific equation<br />
0-1<br />
Not typed<br />
No title or appropriate headings<br />
<strong>Lab</strong> report is incomplete,<br />
incoherent <strong>and</strong> does not convey<br />
correct information<br />
Purpose statement missing or<br />
vague<br />
Independent <strong>and</strong> dependent<br />
variables vague or missing<br />
No control variable discussed<br />
Image <strong>and</strong> procedures are<br />
missing or very hard to follow<br />
No data table present<br />
Data does not s<strong>up</strong>port the<br />
conclusions or is very poor<br />
Inappropriate independent<br />
variable range used<br />
Missing or only 1 of the criteria<br />
is met<br />
Missing or only 1 of the criteria<br />
is met<br />
2-3<br />
typed<br />
Names, sections, & title<br />
appropriate headings<br />
<strong>Lab</strong> report is hard to follow <strong>and</strong><br />
is only semi logical<br />
<strong>Lab</strong> report only contains some<br />
correct information about the<br />
topic<br />
Statement fully expresses<br />
purpose of experiment<br />
All independent <strong>and</strong><br />
independent variables are<br />
correctly identified<br />
Some of the criteria are met or<br />
not all are to satisfactory levels<br />
Only 2 of the criteria are met<br />
Only 2 of the criteria are met<br />
Only 2 of the criteria are met<br />
4-5<br />
<strong>Lab</strong> report is complete, logical,<br />
<strong>and</strong> easy to follow<br />
The lab report conveys correct<br />
information about the topic being<br />
analyzed<br />
Controlled variables are clearly<br />
stated<br />
Includes both visual image &<br />
written procedures that make the<br />
lab repeatable<br />
Organized data table w/ units<br />
Data can be used to draw<br />
conclusions<br />
Appropriate independent<br />
variable range<br />
(largest: smallest ≥ 5:1 ratio)<br />
At least 8 data points<br />
All graphs are completely labeled<br />
& include best fit line<br />
Linearized (if necessary)<br />
Is the same equation derived<br />
from your graph(s)<br />
Includes all units<br />
No symbols are used (only<br />
words)<br />
Assigned<br />
Grade<br />
1
Criteria<br />
Mathematical<br />
general<br />
equation<br />
General<br />
equation<br />
rationale<br />
Relationship<br />
between<br />
variables in<br />
new general<br />
equation<br />
Meaning of<br />
slope<br />
Meaning of y<br />
intercept<br />
Error<br />
Analysis<br />
0-1<br />
Missing or only 1 of the criteria is<br />
met<br />
Discussion about how you arrived<br />
at your general equation is vague<br />
or missing<br />
Rational about your y-intercept is<br />
vague or missing<br />
The relationship between the<br />
variables are not discussed<br />
No mathematical example are<br />
present or correct<br />
Explanation of the slope is<br />
missing or incorrect<br />
No logical s<strong>up</strong>port is given<br />
No explanation of what the y-<br />
intercept tells us<br />
No logical s<strong>up</strong>port for statements<br />
Sources of error are missing or<br />
unacceptable<br />
The effects of the errors are not<br />
discussed<br />
2-3<br />
Only 2 of the criteria are met<br />
Discussion of general equation<br />
shows some logical steps but hard<br />
to follow<br />
Rational about your y-intercept<br />
shows some thought but is hard to<br />
follow<br />
There is some discussion of the<br />
relationship between variables<br />
Only 1 correct mathematical<br />
example is presented<br />
Explanation of the slope is vague<br />
Little logical s<strong>up</strong>port is given or it<br />
is hard to follow<br />
Explanation of the y-intercept is<br />
vague<br />
Little logical s<strong>up</strong>port is given or it<br />
is hard to follow<br />
Some sources of errors are<br />
acceptable<br />
The effects of the errors are not<br />
correct or vague<br />
4-5<br />
Includes only symbols that reflect<br />
the dimensions chosen<br />
Has no numbers (unless that<br />
number is a constant)<br />
Explain what each symbol<br />
represents<br />
Explain how you arrived at your<br />
general equation<br />
Explain why you kept or dropped<br />
your y-intercept in your general<br />
equation<br />
Clearly explains the relationships<br />
between each variable in the<br />
general equation<br />
Demonstrate mathematically how<br />
a change in each variable will<br />
affect another variable (2<br />
examples)<br />
Explain what the slope tells us in<br />
this lab<br />
Use logical s<strong>up</strong>port to defend<br />
your statement<br />
Explain what the y-intercept tells<br />
us in this lab<br />
Use logical s<strong>up</strong>port to defend<br />
your statement<br />
Describe any sources of error you<br />
encountered during the lab (no<br />
human error)<br />
Explain, specifically, how each<br />
error would affect your results<br />
(i.e. the data points on your graph)<br />
Assigned<br />
Grade<br />
2