Intel Corporation Annual Report 1999
Intel Corporation Annual Report 1999
Intel Corporation Annual Report 1999

Create successful ePaper yourself
Turn your PDF publications into a flip-book with our unique Google optimized e-Paper software.
clients<br />
networking and communications<br />
intel.com<br />
<strong>1999</strong> annual report<br />
intc.com<br />
the building blocks of the internet economy<br />
server platforms<br />
solutions and services
29.4<br />
30<br />
2.11<br />
2.25<br />
90<br />
26.3<br />
25.1<br />
1.93<br />
I N T E L C O R P O R A T I O N 1 9 9 9<br />
3.9<br />
90<br />
4.8<br />
91<br />
5.8<br />
92<br />
8.8<br />
93<br />
11.5<br />
94<br />
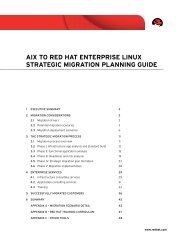
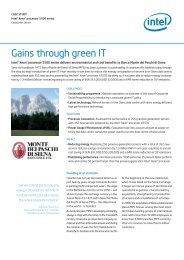
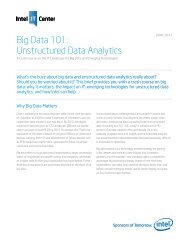
Net revenues<br />
(Dollars in billions)<br />
16.2<br />
95<br />
20.8<br />
96<br />
97<br />
98<br />
99<br />
20<br />
10<br />
0<br />
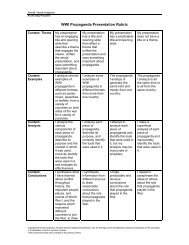
0.31<br />
0.24<br />
0.20<br />
90<br />
91<br />
92<br />
0.65 0.65<br />
93<br />
94<br />
1.01<br />
95<br />
1.45<br />
96<br />
97<br />
Diluted earnings per share<br />
(Dollars, adjusted for stock splits)<br />
1.73<br />
98<br />
99<br />
1.50<br />
0.75<br />
0<br />
90<br />
91<br />
92<br />
93<br />
Close<br />
94<br />
High<br />
Low<br />
95<br />
96<br />
97<br />
Stock price trading ranges<br />
by fiscal year<br />
(Dollars, adjusted for stock splits)<br />
98<br />
99<br />
60<br />
30<br />
0<br />
780<br />
618<br />
517<br />
1,296<br />
1,111<br />
970<br />
1,808<br />
2,347<br />
2,509<br />
3,111<br />
0<br />
90 91 92 93 94 95 96 97 98 99<br />
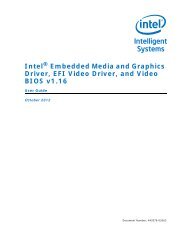
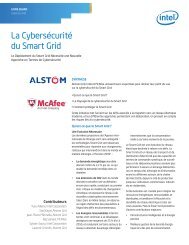
Research and development<br />
(Dollars in millions, excluding purchased<br />
in-process research and development)<br />
3,000<br />
2,000<br />
1,000<br />
<strong>1999</strong> facts and figures<br />
<strong>Intel</strong>’s stock<br />
price has risen<br />
at a 48%<br />
compound<br />
annual growth<br />
rate in the<br />
last 10 years.<br />
21.2 21.6<br />
20.4<br />
35.5<br />
27.3<br />
35.6<br />
33.3<br />
90 91 92 93 94 95 96<br />
Return on average<br />
stockholders’ equity<br />
(Percent)<br />
38.4<br />
97<br />
28.4<br />
26.2<br />
98<br />
99<br />
45<br />
30<br />
15<br />
0<br />
9.76<br />
9<br />
Japan<br />
7%<br />
4,501<br />
4,032<br />
4,500<br />
7.05<br />
3,550<br />
3,403<br />
5.14<br />
5.93<br />
6<br />
Asia-<br />
Pacific<br />
23%<br />
North<br />
America<br />
43%<br />
2,441<br />
3,024<br />
3,000<br />
3.69<br />
1,933<br />
2.80<br />
2.24<br />
1.63<br />
1.35<br />
1.12<br />
3<br />
Europe<br />
27%<br />
680<br />
1,228<br />
948<br />
1,500<br />
Machinery<br />
& equipment<br />
Land, buildings<br />
& improvements<br />
90<br />
91<br />
92<br />
93<br />
94<br />
95<br />
96<br />
97<br />
98<br />
99<br />
0<br />
90<br />
91<br />
92<br />
93<br />
94<br />
95<br />
96<br />
97<br />
98<br />
99<br />
0<br />
Book value per share<br />
at year-end<br />
(Dollars, adjusted for stock splits)<br />
Geographic breakdown of <strong>1999</strong> revenues<br />
(Percent)<br />
Capital additions to property,<br />
plant and equipment †<br />
(Dollars in millions)<br />
Past performance does not guarantee future results. Share and per share amounts shown have been adjusted for stock splits through <strong>1999</strong>.<br />
† Additions in 1998 include capital assets acquired from Digital Equipment <strong>Corporation</strong>.
To our stockholders<br />
1<br />
In <strong>1999</strong>, the Internet revolution<br />
continued to reshape how the<br />
world does business. Accordingly,<br />
we worked to transform <strong>Intel</strong>:<br />
from being at the center of the PC<br />
industry to being at the center of<br />
the Internet economy. We developed new strategic business<br />
directions that position us to supply key building blocks at many<br />
points within the Internet infrastructure, from networks to chips.<br />
Even as we were expanding the company’s focus, our core<br />
microprocessor business provided us with a solid growth rate.<br />
We ended the year with record sales of<br />
$29.4 billion, an increase of 12%. This<br />
by following our “copy exactly”<br />
strategy: our new 0.18-micron<br />
manufacturing fabs are virtual<br />
replicas of the development fab<br />
where the process was perfected.<br />
Segmentation: Our strategy<br />
in microprocessors has worked extremely well, allowing us<br />
to provide chips for all major computing price/performance<br />
points. In <strong>1999</strong>, we adjusted our costs and our investment<br />
strategy to be consistent with our segmentation plans, and as<br />
a result we experienced strong unit shipment growth across<br />
microprocessor market segments.<br />
Acquisitions: We purchased 12<br />
I N T E L C O R P O R A T I O N 1 9 9 9<br />
was our 13th straight year of revenue<br />
growth. Net income was up 21% to $7.3<br />
billion including acquisition-related costs;<br />
without acquisition-related costs, it would<br />
have been up 29% to $8.1 billion.<br />
Our performance was strong around<br />
the world, with 57% of our sales coming<br />
from outside the U.S. The Asian markets<br />
have started to recover, and European<br />
sales were solid. As the developing<br />
economies expand, we expect even<br />
stronger growth worldwide.<br />
We’re building<br />
on our core<br />
strengths to<br />
pursue new<br />
strategic<br />
directions.<br />
companies for about $6 billion, augmenting<br />
our capabilities in a number of<br />
key product areas. Companies acquired<br />
included Shiva, Softcom, Dialogic,<br />
Level One Communications, NetBoost,<br />
IPivot and DSP Communications.<br />
Strategic investments: The <strong>Intel</strong><br />
Capital program had a boom year, with<br />
equity investments in areas of strategic<br />
importance to <strong>Intel</strong>. We ended the year<br />
with an investment portfolio valued at<br />
about $8 billion. At the end of <strong>1999</strong>, we<br />
<strong>1999</strong> was an extraordinarily busy year, with significant output<br />
from all of our product groups. To our frustration, our<br />
execution was less than perfect, leading to delays in the introduction<br />
of several products. Despite these issues, we ended<br />
the year with a very strong roster of achievements:<br />
Processor launch: We accomplished the largest microprocessor<br />
product introduction in our history, with 15 new Pentium ® III<br />
and Pentium ® III Xeon processors introduced at once. This was<br />
supported by chipsets and motherboards that help computer<br />
makers bring systems based on the new chips to market quickly.<br />
Manufacturing: We ramped our new 0.18-micron manufacturing<br />
process faster than any other process in our history.<br />
We were able to generate high yields quickly in our factories<br />
held stakes in more than 350 companies around the world,<br />
dedicated to the evolving Internet economy—from physical<br />
infrastructure to content. These investments substantially<br />
augmented our participation in the online revolution.<br />
Future powerhouse: We produced successful sample<br />
versions of the Itanium processor, based on the revolutionary<br />
new IA-64 architecture designed to meet the needs of powerful<br />
Internet servers. We expect this architecture to be as important<br />
to the Internet infrastructure in the future as the current <strong>Intel</strong><br />
architecture has been to PC computing for the last 15 to 20<br />
years. Our goal is to make the IA-64 architecture the main engine<br />
of the Internet in the next decade, starting with the Itanium<br />
processor, which we expect to be in production in mid-2000.
2<br />
As others see us: We were pleased to have<br />
<strong>Intel</strong> included in the Dow Jones Industrial Average*<br />
Internet Exchange architecture, a powerful, flexible<br />
new platform for silicon-based networking<br />
I N T E L C O R P O R A T I O N 1 9 9 9<br />
in November <strong>1999</strong>; this reflects the importance of<br />
technology in the overall U.S. economy. We were<br />
gratified to be ranked #8 on Fortune magazine’s<br />
list of most admired companies, and honored to<br />
be rated #4 among U.S. companies with the best corporate<br />
reputations, according to research by Harris Interactive Incorporated<br />
and the Reputation Institute.<br />
Supplying the Internet economy. Just as the PC was the<br />
Our future powerhouse:<br />
the Itanium processor<br />
products. We are also expanding our offering of<br />
system-level communications products that help<br />
build the network infrastructure.<br />
Server platforms: Within five years, we expect<br />
there to be tens of millions of servers worldwide, most based<br />
on <strong>Intel</strong> architecture. Many servers harness the power of two,<br />
four, eight or more <strong>Intel</strong> processors each, making them a very<br />
significant growth opportunity. We have invested about half<br />
growth engine for computing in the last decade, the Internet<br />
will be the growth engine for computing in the next decade.<br />
The Internet runs on chips. From the networking silicon that<br />
of our microprocessor R&D budget on initiatives in this area,<br />
Our mission<br />
is to be the<br />
preeminent<br />
building block<br />
supplier to<br />
the worldwide<br />
Internet<br />
economy.<br />
including the IA-64 architecture and the Pentium III Xeon processor<br />
family, specifically designed for mid-range and highend<br />
servers and workstations. Part of<br />
our strategy is to make it easier for<br />
server makers to design their products<br />
around <strong>Intel</strong> architecture, so we provide<br />
chipsets, boards and system-level<br />
products that incorporate <strong>Intel</strong> components<br />
for servers at various levels<br />
of integration.<br />
Solutions and services: The e-Business<br />
revolution provides a key opportunity<br />
to help companies develop and<br />
run e-Commerce systems. We do more<br />
than $1 billion in business each month<br />
over the Internet, and according to<br />
directs electronic signals around the<br />
globe, to the high-performance servers<br />
that house every Web page and e-mail<br />
message, to the microprocessors in the<br />
PCs and other devices used to get online,<br />
the Internet relies on silicon. This<br />
reliance builds directly on our experience<br />
and core strengths.<br />
Our four key business areas are:<br />
Clients: In our core business, we<br />
focus on delivering quality microprocessors<br />
for a wide range of computing needs.<br />
Our Pentium III microprocessor is the<br />
fastest ramping processor ever, excellent<br />
for performance desktop PCs and entry-level servers and<br />
workstations. We also supply the <strong>Intel</strong> ® Celeron processor,<br />
enabling entry-level PC buyers to get reliable <strong>Intel</strong> technology<br />
for less than $1,000; a variety of processors customized for<br />
mobile computing solutions; and a line of flash memory products<br />
for handheld wireless devices.<br />
Networking and communications: With the boom in networking<br />
and communications, we have made it a priority to<br />
develop and acquire expanded capabilities in the networking<br />
silicon business. We have purchased several companies with<br />
strong expertise in this area and have developed the <strong>Intel</strong> ®<br />
the July <strong>1999</strong> issue of PC Computing magazine, we are<br />
the world’s largest business-to-business e-Commerce site.<br />
Through <strong>Intel</strong> ® Online Services, we sell our own technology<br />
and products in a service form to other companies that may<br />
not have the expertise or resources to handle a booming<br />
e-Commerce operation in house.<br />
These new strategies leverage our core business and position<br />
us well to serve the Internet economy. These strategic<br />
areas are described in further detail on the following pages.<br />
We look forward to the challenges in this new environment<br />
and expect to grow as Internet computing continues to expand.<br />
Gordon E. Moore<br />
Chairman Emeritus<br />
Andrew S. Grove<br />
Chairman<br />
Craig R. Barrett<br />
President and CEO
3<br />
clients<br />
PCs, notebooks,<br />
handheld devices, smart<br />
cell phones and other<br />
networking and communications<br />
silicon, wires and boxes<br />
that form the infrastructure<br />
connecting millions<br />
I N T E L C O R P O R A T I O N 1 9 9 9<br />
tools used to get online<br />
of clients and servers<br />
the internet<br />
revolution requires a wholesale<br />
reengineering of the infrastructure<br />
for commerce and communications.<br />
In five to eight years, we believe the<br />
world will be linked by one billion<br />
connected computers, through tens<br />
of millions of servers, generating trillions<br />
of dollars of e-commerce. As we<br />
shift our focus from a PC-dominated<br />
industry to an internet-dominated<br />
economy, we are positioning ourselves<br />
to provide key technologies<br />
to help drive this transformation.<br />
server platforms<br />
powerful systems, often based on<br />
several processors working together,<br />
that house data and<br />
direct traffic on the internet<br />
solutions and services<br />
tools and technical<br />
support that companies<br />
need to succeed in the<br />
internet economy
4<br />
I N T E L C O R P O R A T I O N 1 9 9 9<br />
<strong>1999</strong>januaryfebruarymarchaprilmayjunejuly<br />
Introduced the mobile<br />
Pentium ® II processor,<br />
our first Pentium II processor<br />
with L2 cache built on a<br />
single silicon die, with higher<br />
performance and smaller<br />
packaging for mobile PCs.<br />
Introduced the<br />
Pentium ® III processor,<br />
optimized for the Internet,<br />
for advanced imaging, 3D,<br />
and streaming audio and<br />
video applications.<br />
Launched the <strong>Intel</strong> ® Celeron TM<br />
processor 466 MHz for<br />
value PCs, giving consumers<br />
higher performance and access<br />
to the Internet for under $1,000.<br />
Also launched the <strong>Intel</strong> ® 810<br />
chipset, integrating multimedia<br />
capabilities for low-cost PCs.<br />
Announced the next-generation<br />
StrongARM ® processor<br />
technology for advanced<br />
handheld computing products<br />
and Internet access devices,<br />
including smart phones.
getting online<br />
clients<br />
In the Internet economy, everyone has the<br />
same need: to get online. But not everyone<br />
gets there the same way. The PC remains<br />
the tool of choice for online access, making<br />
<strong>Intel</strong> architecture the key doorway to the<br />
Internet. At the same time, other devices<br />
such as smart cell phones increasingly<br />
offer Internet access as well. <strong>Intel</strong> participates<br />
in these product areas, too. The<br />
5<br />
I N T E L C O R P O R A T I O N 1 9 9 9<br />
company delivers a wide range of processors<br />
and memory technologies, powering<br />
products from high-performance desktops<br />
and workstations to mobile PCs to value<br />
PCs to Internet appliances and cell<br />
phones. <strong>Intel</strong>’s segmentation plans and<br />
new investments are strategically geared<br />
to put <strong>Intel</strong> products at the heart of most<br />
types of tools people use to get online.<br />
augustseptemberoctobernovemberdecember<br />
Announced 3-volt<br />
<strong>Intel</strong> ® StrataFlash ®<br />
memory, tripling read<br />
performance and<br />
improving data access<br />
times for handheld<br />
wireless devices.<br />
Introduced mobile Celeron<br />
processors at 466 and 433<br />
MHz for increased performance<br />
in value mobile PCs.<br />
Our largest processor<br />
launch to date:<br />
announced 15 new<br />
Pentium III and<br />
Pentium ® III Xeon TM<br />
processors.<br />
Acquired DSP Communications,<br />
a leading supplier of digital cellular<br />
communications products, enabling new<br />
generations of smart wireless handsets.<br />
Introduced<br />
new Pentium III<br />
processors<br />
running at 800<br />
and 750 MHz.
6<br />
I N T E L C O R P O R A T I O N 1 9 9 9<br />
<strong>1999</strong>januaryfebruarymarchaprilmayjunejuly<br />
Acquired Shiva,<br />
a supplier of integrated<br />
remote network access<br />
solutions for business.<br />
Launched the AnyPoint TM<br />
home network product,<br />
letting families with more<br />
than one PC share Internet<br />
access, files, printers and<br />
games through a phone line.<br />
Acquired Softcom, maker of semiconductor<br />
products for networking equipment<br />
used to direct voice and data across networks.<br />
Acquired Dialogic, a producer<br />
of hardware and software<br />
for high-end servers operating<br />
in voice and data networks.
linking up<br />
networking and communications<br />
7<br />
I N T E L C O R P O R A T I O N 1 9 9 9<br />
The Internet economy<br />
is driving growth of the silicon<br />
building blocks and communications systems<br />
that help build the network infrastructure.<br />
<strong>Intel</strong>’s networking and communications business<br />
has been growing rapidly for the last several years,<br />
with silicon, systems and software products that help<br />
build networks and link consumers and businesses.<br />
In <strong>1999</strong>, to further expand our capabilities and product<br />
offerings, <strong>Intel</strong> acquired several companies with<br />
expertise in this area. We also launched the <strong>Intel</strong> ®<br />
Internet Exchange architecture, a powerful,<br />
flexible platform for silicon-based products,<br />
to help the networking and communications<br />
industry build faster, more<br />
intelligent networks.<br />
augustseptemberoctobernovemberdecember<br />
Acquired Level One<br />
Communications,<br />
aimed at increasing<br />
advanced networking<br />
capability by increasing<br />
bandwidth and<br />
functionality through<br />
silicon integration.<br />
Acquired NetBoost for<br />
chips, systems and software<br />
complementary to the <strong>Intel</strong> ®<br />
Internet Exchange TM architecture.<br />
Formed the $200 million <strong>Intel</strong> Communications<br />
Fund for equity investments in companies supporting<br />
our key initiatives in voice and data communications.<br />
Acquired IPivot, maker<br />
of e-Commerce equipment<br />
that helps ensure faster,<br />
more reliable and secure<br />
transactions.
8<br />
I N T E L C O R P O R A T I O N 1 9 9 9<br />
<strong>1999</strong>januaryfebruarymarchaprilmayjunejuly<br />
Unveiled the Pentium III<br />
Xeon processor for servers<br />
and workstations based on<br />
multiple processors.<br />
Along with other corporate<br />
investors, we established the<br />
$250 million <strong>Intel</strong> 64 Fund<br />
for equity investments in<br />
companies developing Internet<br />
and enterprise applications<br />
based on the IA-64 architecture.
delivering on demand<br />
server platforms<br />
Behind every Web page, every e-mail<br />
message and every e-Commerce transaction<br />
is a server. Each keystroke launches<br />
a series of demanding electronic<br />
tasks that puts the servers behind<br />
the scenes through their paces. Servers,<br />
the engines of the Internet, are<br />
booming: according to<br />
our estimates, only about 4% of<br />
the servers that will be needed by<br />
the year 2005 are currently online. And<br />
more than 80% of commercial<br />
servers shipped in the world<br />
run on <strong>Intel</strong> architecture, according<br />
to IDC. The opportunity<br />
is vast. <strong>Intel</strong> dedicated about<br />
half of its microprocessor R&D<br />
investments in <strong>1999</strong> to new<br />
products for the server and workstation<br />
market segments. This has centered<br />
particularly on the IA-64<br />
processor architecture, a<br />
powerful new design that<br />
can handle twice as much<br />
data at one time as the<br />
Pentium ® processor<br />
family. We expect this architecture to<br />
become the backbone of the Internet.<br />
9<br />
I N T E L C O R P O R A T I O N 1 9 9 9<br />
augustseptemberoctobernovemberdecember<br />
Began shipping the<br />
Profusion ® chipset,<br />
which makes it easier<br />
for OEMs to build 8-way<br />
servers based on the<br />
Pentium III Xeon processor.<br />
Launched new Pentium III Xeon<br />
processors designed specifically<br />
for high-performance 2-way servers,<br />
at speeds of up to 733 MHz.<br />
Announced the Itanium TM brand: the first in<br />
the next-generation IA-64 family of processors<br />
for servers and high-end workstations.<br />
Led the server industry to<br />
a single standard for future<br />
high-performance input/output,<br />
known as the InfiniBand*<br />
architecture.<br />
Began delivering<br />
prototype Itanium<br />
processors to server<br />
makers and software<br />
developers, to speed<br />
the development and<br />
testing of products for<br />
the new architecture.
10<br />
I N T E L C O R P O R A T I O N 1 9 9 9<br />
<strong>1999</strong>januaryfebruarymarchaprilmayjunejuly<br />
<strong>Intel</strong> and Mattel announced creation of the<br />
<strong>Intel</strong> ® Play TM family of computer toys,<br />
including the QX3*computer microscope.<br />
Launched the e-Commerce<br />
Provider Program, helping<br />
companies build branded online<br />
stores without having to develop,<br />
design, administer or host<br />
their own solutions.
uilding for the boom<br />
solutions and services<br />
In<br />
rapidly increasing numbers, companies worldwide are laying the<br />
foundations for information technology infrastructure and e-Commerce<br />
services. <strong>Intel</strong> is leading the way: its $1 billion per month in online sales<br />
makes it the largest business-to-business<br />
e-Commerce site in the world, according to<br />
the July <strong>1999</strong> issue of PC Computing magazine.<br />
In <strong>1999</strong>, <strong>Intel</strong> leveraged this experience into a<br />
new business direction. <strong>Intel</strong> ® Online Services<br />
provides a full range of Internet services to<br />
businesses, including hosting services and<br />
fast development of e-Business solutions for<br />
companies around the world. <strong>Intel</strong> also continues<br />
to invest in ways to attract new users<br />
and develop new uses for computing. These<br />
initiatives help drive<br />
demand for the powerful<br />
microprocessors<br />
that make computing<br />
more exciting and rewarding<br />
for consumers.<br />
11<br />
I N T E L C O R P O R A T I O N 1 9 9 9<br />
augustseptemberoctobernovemberdecember<br />
With Hong Kong-based Pacific<br />
Century Group, announced<br />
agreements to enable broadband<br />
Internet deployment in Asia.<br />
<strong>Intel</strong> and NEC announced<br />
a collaboration to provide<br />
enhanced Internet-related<br />
business solutions worldwide.<br />
<strong>Intel</strong> and Nokia joined forces to<br />
develop a new class of consumer devices<br />
that integrate the Internet and digital TV.<br />
Introduced <strong>Intel</strong> ® PC Camera<br />
Pro Pack, letting users directly connect<br />
camcorders and VCRs to their PCs.<br />
First <strong>Intel</strong> ® Online Services facility opened<br />
in Santa Clara, California. Plans announced<br />
for new locations in Virginia, England and Japan.
12<br />
I N T E L C O R P O R A T I O N 1 9 9 9<br />
clients<br />
networking and<br />
communications<br />
solutions<br />
and services<br />
server platforms<br />
server platforms<br />
solutions<br />
and services<br />
the internet today<br />
is like a young child; most of its life is ahead of it. As<br />
the Internet economy continues to revolutionize the way<br />
people work and communicate, <strong>Intel</strong> will be there, providing<br />
the critical building blocks of this transformation:<br />
microprocessors that power PCs and other tools<br />
people use to get online<br />
chips and systems that build the network<br />
infrastructure<br />
powerful processors that help servers keep<br />
information flying around the globe<br />
services and support that companies need, to take<br />
advantage of this incredible new environment<br />
As always, we build on our core strengths: our extensive<br />
and long-term experience in marketing, engineering<br />
and manufacturing around the globe; our leadership<br />
in the computing industry; our financial resources;<br />
the strong value of the <strong>Intel</strong> brand; and the dedication<br />
and discipline of our people. These assets will help<br />
us meet our goal to be the preeminent building<br />
block supplier to the worldwide Internet economy.<br />
clients<br />
networking and<br />
communications<br />
networking and<br />
communications<br />
clients<br />
server platforms<br />
solutions<br />
and services
Financial summary<br />
13<br />
Ten years ended December 25, <strong>1999</strong><br />
Net<br />
Weighted<br />
investment Additions average<br />
Employees in property, Long-term Stock- to property, diluted<br />
at year-end plant & Total debt & put holders’ plant & shares<br />
A<br />
(In millions—except employees) (in thousands) equipment assets warrants equity equipment outstanding<br />
<strong>1999</strong>................................................................................................................ 70.2 $ 11,715 $ 43,849 $ 1,085 $ 32,535 $ 3,403 3,470<br />
1998................................................................................................................ 64.5 $ 11,609 $ 31,471 $ 903 $ 23,377 $ 4,032 3,517<br />
1997................................................................................................................ 63.7 $ 10,666 $ 28,880 $ 2,489 $ 19,295 $ 4,501 3,590<br />
1996................................................................................................................ 48.5 $ 8,487 $ 23,735 $ 1,003 $ 16,872 $ 3,024 3,551<br />
1995................................................................................................................ 41.6 $ 7,471 $ 17,504 $ 1,125 $ 12,140 $ 3,550 3,536<br />
I N T E L C O R P O R A T I O N 1 9 9 9<br />
1994................................................................................................................ 32.6 $ 5,367 $ 13,816 $ 1,136 $ 9,267 $ 2,441 3,496<br />
1993................................................................................................................ 29.5 $ 3,996 $ 11,344 $ 1,114 $ 7,500 $ 1,933 3,528<br />
1992................................................................................................................ 25.8 $ 2,816 $ 8,089 $ 622 $ 5,445 $ 1,228 3,436<br />
1991 ................................................................................................................ 24.6 $ 2,163 $ 6,292 $ 503 $ 4,418 $ 948 3,344<br />
1990................................................................................................................ 23.9 $ 1,658 $ 5,376 $ 345 $ 3,592 $ 680 3,247<br />
Amortization<br />
of goodwill<br />
& other<br />
Research acquisition- Basic Diluted Dividends<br />
(In millions—except Net Cost of & devel- related Operating Net earnings earnings declared<br />
B<br />
C<br />
per share amounts) revenues sales opment intangibles income income per share per share per share<br />
<strong>1999</strong>......................................... $29,389 $11,836 $ 3,111 $ 411 $ 9,767 $ 7,314 $ 2.20 $ 2.11 $ .110<br />
1998......................................... $26,273 $12,088 $ 2,509 $ 56 $ 8,379 $ 6,068 $ 1.82 $ 1.73 $ .050<br />
1997......................................... $25,070 $ 9,945 $ 2,347 — $ 9,887 $ 6,945 $ 2.12 $ 1.93 $ .058<br />
1996......................................... $20,847 $ 9,164 $ 1,808 — $ 7,553 $ 5,157 $ 1.57 $ 1.45 $ .048<br />
1995......................................... $16,202 $ 7,811 $ 1,296 — $ 5,252 $ 3,566 $ 1.08 $ 1.01 $ .038<br />
1994......................................... $11,521 $ 5,576 $ 1,111 — $ 3,387 $ 2,288 $ .69 $ .65 $ .029<br />
1993......................................... $ 8,782 $ 3,252 $ 970 — $ 3,392 $ 2,295 $ .69 $ .65 $ .025<br />
1992......................................... $ 5,844 $ 2,557 $ 780 — $ 1,490 $ 1,067 $ .32 $ .31 $ .013<br />
1991 ......................................... $ 4,779 $ 2,316 $ 618 — $ 1,080 $ 819 $ .25 $ .24 —<br />
1990......................................... $ 3,921 $ 1,930 $ 517 — $ 858 $ 650 $ .21 $ .20 —<br />
A<br />
B<br />
C<br />
Share and per share amounts shown have been adjusted for stock splits through <strong>1999</strong>.<br />
Additions to property, plant and equipment in 1998 include $475 million for capital assets acquired from Digital Equipment <strong>Corporation</strong>.<br />
Cost of sales for 1998 reflects the reclassification of amortization of goodwill and other acquisition-related intangibles to a separate line item.<br />
Research and development excludes in-process research and development of $392 million and $165 million for <strong>1999</strong> and 1998, respectively.
14<br />
Consolidated statements of income<br />
I N T E L C O R P O R A T I O N 1 9 9 9<br />
Three years ended December 25, <strong>1999</strong><br />
(In millions—except per share amounts) <strong>1999</strong> 1998 1997<br />
Net revenues................................................................................................................................................................................................................................... $29,389 $26,273 $25,070<br />
Cost of sales....................................................................................................................................................................................................................................... 11,836 12,088 9,945<br />
Research and development .............................................................................................................................................................................................. 3,111 2,509 2,347<br />
Marketing, general and administrative .................................................................................................................................................................. 3,872 3,076 2,891<br />
Amortization of goodwill and other acquisition-related intangibles ..................................................................................... 411 56 —<br />
Purchased in-process research and development ................................................................................................................................. 392 165 —<br />
Operating costs and expenses ..................................................................................................................................................................................... 19,622 17,894 15,183<br />
Operating income .................................................................................................................................................................................................................... 9,767 8,379 9,887<br />
Interest expense ............................................................................................................................................................................................................................. (36) (34) (27)<br />
Interest income and other, net ....................................................................................................................................................................................... 1,497 792 799<br />
Income before taxes............................................................................................................................................................................................................ 11,228 9,137 10,659<br />
Provision for taxes........................................................................................................................................................................................................................ 3,914 3,069 3,714<br />
Net income ........................................................................................................................................................................................................................................ $ 7,314 $ 6,068 $ 6,945<br />
Basic earnings per common share................................................................................................................................................................. $ 2.20 $ 1.82 $ 2.12<br />
Diluted earnings per common share ............................................................................................................................................................ $ 2.11 $ 1.73 $ 1.93<br />
Weighted average common shares outstanding ......................................................................................................................... 3,324 3,336 3,271<br />
Weighted average common shares outstanding, assuming dilution .............................................................. 3,470 3,517 3,590<br />
See accompanying notes.
Consolidated balance sheets<br />
15<br />
December 25, <strong>1999</strong> and December 26, 1998<br />
(In millions—except per share amounts) <strong>1999</strong> 1998<br />
Assets<br />
Current assets:<br />
Cash and cash equivalents............................................................................................................................................................................................................................... $ 3,695 $ 2,038<br />
Short-term investments......................................................................................................................................................................................................................................... 7,705 5,272<br />
Trading assets .................................................................................................................................................................................................................................................................. 388 316<br />
Accounts receivable, net of allowance for doubtful accounts of $67 ($62 in 1998) ....................................................................... 3,700 3,527<br />
Inventories ............................................................................................................................................................................................................................................................................ 1,478 1,582<br />
Deferred tax assets .................................................................................................................................................................................................................................................... 673 618<br />
Other current assets ................................................................................................................................................................................................................................................. 180 122<br />
Total current assets ................................................................................................................................................................................................................................................. 17,819 13,475<br />
Property, plant and equipment:<br />
Land and buildings ..................................................................................................................................................................................................................................................... 7,246 6,297<br />
Machinery and equipment.................................................................................................................................................................................................................................. 14,851 13,149<br />
Construction in progress ..................................................................................................................................................................................................................................... 1,460 1,622<br />
23,557 21,068<br />
Less accumulated depreciation................................................................................................................................................................................................................... 11,842 9,459<br />
Property, plant and equipment, net ................................................................................................................................................................................................... 11,715 11,609<br />
I N T E L C O R P O R A T I O N 1 9 9 9<br />
Marketable strategic equity securities ......................................................................................................................................................................................... 7,121 1,757<br />
Other long-term investments ..................................................................................................................................................................................................................... 790 3,608<br />
Goodwill and other acquisition-related intangibles.................................................................................................................................................... 4,934 111<br />
Other assets ....................................................................................................................................................................................................................................................................... 1,470 911<br />
Total assets ..................................................................................................................................................................................................................................................................... $43,849 $31,471<br />
Liabilities and stockholders’ equity<br />
Current liabilities:<br />
Short-term debt ............................................................................................................................................................................................................................................................. $ 230 $ 159<br />
Accounts payable ........................................................................................................................................................................................................................................................ 1,370 1,244<br />
Accrued compensation and benefits..................................................................................................................................................................................................... 1,454 1,285<br />
Deferred income on shipments to distributors ........................................................................................................................................................................... 609 606<br />
Accrued advertising................................................................................................................................................................................................................................................... 582 458<br />
Other accrued liabilities ......................................................................................................................................................................................................................................... 1,159 1,094<br />
Income taxes payable ............................................................................................................................................................................................................................................. 1,695 958<br />
Total current liabilities .......................................................................................................................................................................................................................................... 7,099 5,804<br />
Long-term debt............................................................................................................................................................................................................................................................... 955 702<br />
Deferred tax liabilities ........................................................................................................................................................................................................................................... 3,130 1,387<br />
Put warrants ....................................................................................................................................................................................................................................................................... 130 201<br />
Commitments and contingencies<br />
Stockholders’ equity:<br />
Preferred stock, $0.001 par value, 50 shares authorized; none issued ....................................................................................................... — —<br />
Common stock, $0.001 par value, 4,500 shares authorized; 3,334 issued and outstanding<br />
(3,315 in 1998) and capital in excess of par value .......................................................................................................................................................... 7,316 4,822<br />
Retained earnings........................................................................................................................................................................................................................................................ 21,428 17,952<br />
Accumulated other comprehensive income .................................................................................................................................................................................. 3,791 603<br />
Total stockholders’ equity ............................................................................................................................................................................................................................... 32,535 23,377<br />
Total liabilities and stockholders’ equity ............................................................................................................................................................................... $43,849 $31,471<br />
See accompanying notes.
16<br />
Consolidated statements of cash flows<br />
I N T E L C O R P O R A T I O N 1 9 9 9<br />
Three years ended December 25, <strong>1999</strong><br />
(In millions) <strong>1999</strong> 1998 1997<br />
Cash and cash equivalents, beginning of year .............................................................................................................................. $ 2,038 $ 4,102 $ 4,165<br />
Cash flows provided by (used for) operating activities:<br />
Net income ........................................................................................................................................................................................................................................... 7,314 6,068 6,945<br />
Adjustments to reconcile net income to net cash provided by (used for) operating activities:<br />
Depreciation .................................................................................................................................................................................................................................... 3,186 2,807 2,192<br />
Amortization of goodwill and other acquisition-related intangibles ................................................................................. 411 56 —<br />
Purchased in-process research and development............................................................................................................................. 392 165 —<br />
Gains on sales of marketable strategic equity securities............................................................................................................ (883) (185) (106)<br />
Net loss on retirements of property, plant and equipment ....................................................................................................... 193 282 130<br />
Deferred taxes .............................................................................................................................................................................................................................. (219) 77 6<br />
Changes in assets and liabilities:<br />
Accounts receivable ........................................................................................................................................................................................................ 153 (38) 285<br />
Inventories................................................................................................................................................................................................................................... 169 167 (404)<br />
Accounts payable............................................................................................................................................................................................................... 79 (180) 438<br />
Accrued compensation and benefits ........................................................................................................................................................... 127 17 140<br />
Income taxes payable.................................................................................................................................................................................................... 726 (211) 179<br />
Tax benefit from employee stock plans..................................................................................................................................................... 506 415 224<br />
Other assets and liabilities ....................................................................................................................................................................................... (819) (249) (21)<br />
Total adjustments.......................................................................................................................................................................................................... 4,021 3,123 3,063<br />
Net cash provided by operating activities ............................................................................................................................................ 11,335 9,191 10,008<br />
Cash flows provided by (used for) investing activities:<br />
Additions to property, plant and equipment .............................................................................................................................................. (3,403) (3,557) (4,501)<br />
Acquisitions, net of cash acquired........................................................................................................................................................................ (2,979) (906) —<br />
Purchases of available-for-sale investments.............................................................................................................................................. (7,055) (10,925) (9,224)<br />
Sales of available-for-sale investments............................................................................................................................................................ 831 201 153<br />
Maturities and other changes in available-for-sale investments ......................................................................................... 7,156 8,681 6,713<br />
Net cash used for investing activities ........................................................................................................................................................ (5,450) (6,506) (6,859)<br />
Cash flows provided by (used for) financing activities:<br />
Increase (decrease) in short-term debt, net............................................................................................................................................... 69 (83) (177)<br />
Additions to long-term debt ......................................................................................................................................................................................... 118 169 172<br />
Retirement of long-term debt ..................................................................................................................................................................................... — — (300)<br />
Proceeds from sales of shares through employee stock plans and other ............................................................. 543 507 317<br />
Proceeds from exercise of 1998 step-up warrants ........................................................................................................................... — 1,620 40<br />
Proceeds from sales of put warrants................................................................................................................................................................. 20 40 288<br />
Repurchase and retirement of common stock ....................................................................................................................................... (4,612) (6,785) (3,372)<br />
Payment of dividends to stockholders............................................................................................................................................................. (366) (217) (180)<br />
Net cash used for financing activities........................................................................................................................................................ (4,228) (4,749) (3,212)<br />
Net increase (decrease) in cash and cash equivalents...................................................................................................... 1,657 (2,064) (63)<br />
Cash and cash equivalents, end of year ................................................................................................................................................. $ 3,695 $ 2,038 $ 4,102<br />
Supplemental disclosures of cash flow information:<br />
Cash paid during the year for:<br />
Interest .................................................................................................................................................................................................................................................. $ 40 $ 40 $ 37<br />
Income taxes ................................................................................................................................................................................................................................. $ 2,899 $ 2,784 $ 3,305<br />
See accompanying notes.
Consolidated statements of stockholders’ equity<br />
17<br />
Common stock and capital<br />
Accumulated<br />
in excess of par value<br />
other com-<br />
Three years ended December 25, <strong>1999</strong> Number Retained prehensive<br />
(In millions—except per share amounts) of shares Amount earnings income Total<br />
Balance at December 28, 1996 ....................................................................................................... 3,283 $ 2,897 $13,853 $ 122 $16,872<br />
Components of comprehensive income:<br />
Net income................................................................................................................................................................ — — 6,945 — 6,945<br />
Change in unrealized gain on available-for-sale investments,<br />
net of tax ........................................................................................................................................................ — — — (64) (64)<br />
Total comprehensive income.......................................................................................................... 6,881<br />
Proceeds from sales of shares through employee stock plans,<br />
tax benefit of $224 and other.............................................................................................................. 61 581 (1) — 580<br />
Proceeds from sales of put warrants .............................................................................................. — 288 — — 288<br />
Reclassification of put warrant obligation, net...................................................................... — (144) (1,622) — (1,766)<br />
Repurchase and retirement of common stock..................................................................... (88) (311) (3,061) — (3,372)<br />
Cash dividends declared ($0.058 per share) ......................................................................... — — (188) — (188)<br />
Balance at December 27, 1997........................................................................................................ 3,256 3,311 15,926 58 19,295<br />
Components of comprehensive income:<br />
Net income................................................................................................................................................................ — — 6,068 — 6,068<br />
Change in unrealized gain on available-for-sale investments,<br />
net of tax ........................................................................................................................................................ — — — 545 545<br />
Total comprehensive income.......................................................................................................... 6,613<br />
Proceeds from sales of shares through employee stock plans,<br />
tax benefit of $415 and other .............................................................................................................. 66 922 — — 922<br />
Proceeds from exercise of 1998 step-up warrants......................................................... 155 1,620 — — 1,620<br />
Proceeds from sales of put warrants .............................................................................................. — 40 — — 40<br />
Reclassification of put warrant obligation, net...................................................................... — 53 588 — 641<br />
Repurchase and retirement of common stock..................................................................... (162) (1,124) (4,462) — (5,586)<br />
Cash dividends declared ($0.050 per share) ......................................................................... — — (168) — (168)<br />
Balance at December 26, 1998 ....................................................................................................... 3,315 4,822 17,952 603 23,377<br />
Components of comprehensive income:<br />
Net income................................................................................................................................................................ — — 7,314 — 7,314<br />
Change in unrealized gain on available-for-sale investments,<br />
net of tax ........................................................................................................................................................ — — — 3,188 3,188<br />
Total comprehensive income.......................................................................................................... 10,502<br />
Proceeds from sales of shares through employee stock plans,<br />
tax benefit of $506 and other.............................................................................................................. 56 1,049 — — 1,049<br />
Proceeds from sales of put warrants .............................................................................................. — 20 — — 20<br />
Reclassification of put warrant obligation, net...................................................................... — 7 64 — 71<br />
Repurchase and retirement of common stock..................................................................... (71) (1,076) (3,536) — (4,612)<br />
Issuance of common stock in connection with<br />
Level One Communications acquisition ..................................................................................... 34 1,963 — — 1,963<br />
Stock options assumed in connection with acquisitions ......................................... — 531 — — 531<br />
Cash dividends declared ($0.110 per share) ......................................................................... — — (366) — (366)<br />
Balance at December 25, <strong>1999</strong> ....................................................................................................... 3,334 $ 7,316 $21,428 $ 3,791 $32,535<br />
I N T E L C O R P O R A T I O N 1 9 9 9<br />
See accompanying notes.
18<br />
Notes to consolidated financial statements<br />
I N T E L C O R P O R A T I O N 1 9 9 9<br />
Accounting policies<br />
Fiscal year. <strong>Intel</strong> <strong>Corporation</strong> has a fiscal year that ends<br />
the last Saturday in December. Fiscal years <strong>1999</strong>, 1998 and<br />
1997, each 52-week years, ended on December 25, 26 and<br />
27, respectively. Periodically, there will be a 53-week year.<br />
The next 53-week year will end on December 30, 2000.<br />
Basis of presentation. The consolidated financial statements<br />
include the accounts of <strong>Intel</strong> and its wholly owned<br />
subsidiaries. Significant intercompany accounts and transactions<br />
have been eliminated. Accounts denominated in foreign<br />
currencies have been remeasured using the U.S. dollar as<br />
the functional currency.<br />
The preparation of financial statements in conformity with<br />
generally accepted accounting principles requires management<br />
to make estimates and assumptions that affect the<br />
amounts reported in the financial statements and accompanying<br />
notes. Actual results could differ from those estimates.<br />
Investments. Highly liquid debt securities with insignificant<br />
interest rate risk and with original maturities of three<br />
months or less are classified as cash and cash equivalents.<br />
Debt securities with original maturities greater than three<br />
months and remaining maturities less than one year are<br />
classified as short-term investments. Debt securities with<br />
remaining maturities greater than one year are classified<br />
as other long-term investments. The company’s policy is<br />
to protect the value of its fixed income investment portfolio<br />
and to minimize principal risk by earning returns based on<br />
current interest rates.<br />
The company enters into certain equity investments for the<br />
promotion of business and strategic objectives, and typically<br />
does not attempt to reduce or eliminate the inherent market<br />
risks on these investments. The marketable portion of these<br />
strategic investments is classified separately as marketable<br />
strategic equity securities. The non-marketable equity and<br />
other investments are included in other assets.<br />
A substantial majority of the company’s marketable investments<br />
are classified as available-for-sale as of the balance<br />
sheet date and are reported at fair value, with unrealized<br />
gains and losses, net of tax, recorded in stockholders’ equity.<br />
The cost of securities sold is based on the specific identification<br />
method. Realized gains or losses and declines in value,<br />
if any, judged to be other than temporary on available-for-sale<br />
securities are reported in other income or expense. Nonmarketable<br />
investments are recorded at the lower of cost<br />
or market.<br />
Trading assets. The company maintains its trading asset<br />
portfolio to generate returns that offset changes in certain<br />
liabilities related to deferred compensation arrangements.<br />
The trading assets consist of marketable equity instruments<br />
and are stated at fair value. Both realized and unrealized<br />
gains and losses are included in other income or expense<br />
and generally offset the change in the deferred compensation<br />
liability, which is also included in other income or expense.<br />
Net gains on the trading asset portfolio were $44 million, $66<br />
million and $37 million in <strong>1999</strong>, 1998 and 1997, respectively.<br />
The deferred compensation liabilities amounted to $384<br />
million and $287 million in <strong>1999</strong> and 1998, respectively, and<br />
are included in other accrued liabilities on the consolidated<br />
balance sheets.<br />
Fair values of financial instruments. Fair values of cash<br />
and cash equivalents approximate cost due to the short<br />
period of time to maturity. Fair values of short-term investments,<br />
trading assets, marketable strategic equity securities,<br />
other long-term investments, non-marketable investments,<br />
short-term debt, long-term debt, swaps, currency forward<br />
contracts and options hedging marketable instruments are<br />
based on quoted market prices or pricing models using<br />
current market rates. For certain non-marketable equity securities,<br />
fair value is estimated based on prices recently paid for<br />
shares in that company. No consideration is given to liquidity<br />
issues in valuing the debt and investments. The estimated<br />
fair values are not necessarily representative of the amounts<br />
that the company could realize in a current transaction.<br />
Derivative financial instruments. The company utilizes<br />
derivative financial instruments to reduce financial market<br />
risks. These instruments are used to hedge foreign currency,<br />
interest rate and certain equity market exposures of underlying<br />
assets, liabilities and other obligations. The company<br />
also uses derivatives to create synthetic instruments, for<br />
example, buying and selling put and call options on the same<br />
underlying security, to generate money market like returns<br />
with a similar level of risk. The company does not use<br />
derivative financial instruments for speculative or trading<br />
purposes. The company’s accounting policies for these<br />
instruments are based on whether they meet the company’s<br />
criteria for designation as hedging transactions. The criteria<br />
the company uses for designating an instrument as a hedge<br />
include the instrument’s effectiveness in risk reduction and<br />
one-to-one matching of derivative instruments to underlying<br />
transactions. Gains and losses on currency forward contracts,<br />
and options that are designated and effective as hedges of<br />
anticipated transactions, for which a firm commitment has<br />
been attained, are deferred and recognized in income in the<br />
same period that the underlying transactions are settled.<br />
Gains and losses on currency forward contracts, options,<br />
and swaps that are designated and effective as hedges of<br />
existing transactions are recognized in income in the same<br />
period as losses and gains on the underlying transactions<br />
are recognized and generally offset. Gains and losses on any<br />
instruments not meeting the above criteria are recognized<br />
in income in the current period. If an underlying hedged<br />
transaction is terminated earlier than initially anticipated, the<br />
offsetting gain or loss on the related derivative instrument<br />
would be recognized in income in the same period. Subsequent<br />
gains or losses on the related derivative instrument<br />
would be recognized in income in each period until the<br />
instrument matures, is terminated or is sold. Income or<br />
expense on swaps is accrued as an adjustment to the yield<br />
of the related investments or debt they hedge.<br />
Inventories. Inventories are stated at the lower of cost<br />
or market. Cost is computed on a currently adjusted standard
Notes to consolidated financial statements<br />
19<br />
basis (which approximates actual cost on a current average<br />
or first-in, first-out basis). Inventories at fiscal year-ends were<br />
as follows:<br />
(In millions) <strong>1999</strong> 1998<br />
Raw materials $ 183 $ 206<br />
Work in process 755 795<br />
Finished goods 540 581<br />
Total $ 1,478 $ 1,582<br />
Property, plant and equipment. Property, plant and<br />
equipment are stated at cost. Depreciation is computed for<br />
financial reporting purposes principally using the straight-line<br />
method over the following estimated useful lives: machinery<br />
and equipment, 2–4 years; buildings, 4–40 years.<br />
Goodwill and other acquisition-related intangibles.<br />
Goodwill is recorded when the consideration paid for acquisitions<br />
exceeds the fair value of net tangible and intangible<br />
assets acquired. Goodwill and other acquisition-related<br />
intangibles are amortized on a straight-line basis over the<br />
periods indicated below. Reviews are regularly performed<br />
to determine whether facts or circumstances exist which<br />
indicate that the carrying values of assets are impaired. The<br />
company assesses the recoverability of its assets by comparing<br />
the projected undiscounted net cash flows associated<br />
with those assets against their respective carrying amounts.<br />
Impairment, if any, is based on the excess of the carrying<br />
amount over the fair value of those assets. No impairment<br />
has been indicated to date.<br />
Net goodwill and other acquisition-related intangibles at<br />
fiscal year-ends were as follows:<br />
(In millions) Life in years <strong>1999</strong> 1998<br />
Goodwill 2–6 $ 4,124 $ 52<br />
Developed technology 3–6 612 33<br />
Other intangibles 2–6 198 26<br />
$ 4,934 $ 111<br />
Other intangibles include items such as trademarks,<br />
workforce-in-place and customer lists. The total balances<br />
presented above are net of total accumulated amortization<br />
of $471 million and $60 million at December 25, <strong>1999</strong> and<br />
December 26, 1998, respectively.<br />
Amortization of goodwill and other acquisition-related<br />
intangibles of $411 million for <strong>1999</strong> consisted of $307 million<br />
of amortization of goodwill and $104 million of amortization<br />
of other acquisition-related intangibles, a majority of which<br />
was related to developed technology.<br />
Revenue recognition. The company generally recognizes<br />
net revenues upon the transfer of title. However, certain of the<br />
company’s sales are made to distributors under agreements<br />
allowing price protection and/or right of return on merchandise<br />
unsold by the distributors. Because of frequent sales price<br />
reductions and rapid technological obsolescence in the<br />
industry, <strong>Intel</strong> defers recognition of revenues on shipments<br />
to distributors until the merchandise is sold by the distributors.<br />
Advertising. Cooperative advertising obligations are<br />
accrued and the costs expensed at the same time the related<br />
revenues are recognized. All other advertising costs are expensed<br />
as incurred. Advertising expense was $1.7 billion, $1.3<br />
billion and $1.2 billion in <strong>1999</strong>, 1998 and 1997, respectively.<br />
Interest. Interest as well as gains and losses related to<br />
contractual agreements to hedge certain investment positions<br />
and debt (see “Derivative financial instruments”) are recorded<br />
as net interest income or expense. Interest expense capitalized<br />
as a component of construction costs was $5 million, $6<br />
million and $9 million for <strong>1999</strong>, 1998 and 1997, respectively.<br />
Earnings per share. The shares used in the computation<br />
of the company’s basic and diluted earnings per common<br />
share are reconciled as follows:<br />
(In millions) <strong>1999</strong> 1998 1997<br />
Weighted average common<br />
shares outstanding 3,324 3,336 3,271<br />
Dilutive effect of:<br />
Employee stock options 145 159 204<br />
Convertible notes 1 — —<br />
1998 step-up warrants — 22 115<br />
Weighted average common shares<br />
outstanding, assuming dilution 3,470 3,517 3,590<br />
Weighted average common shares outstanding, assuming<br />
dilution, includes the incremental shares that would be issued<br />
upon the assumed exercise of stock options, as well as<br />
the assumed conversion of the convertible notes and the<br />
incremental shares for the step-up warrants. Put warrants<br />
outstanding had no dilutive effect on diluted earnings per<br />
common share for the periods presented. For the three-year<br />
period ended December 25,<strong>1999</strong>, certain of the company’s<br />
stock options were excluded from the calculation of diluted<br />
earnings per share because they were antidilutive, but these<br />
options could be dilutive in the future. Net income for the<br />
purpose of computing diluted earnings per common share<br />
is not materially affected by the assumed conversion of the<br />
convertible notes. (See “Long-term debt” under “Borrowings.”)<br />
Stock distribution. On April 11, <strong>1999</strong>, the company<br />
effected a two-for-one stock split in the form of a special<br />
stock distribution to stockholders of record as of March 23,<br />
<strong>1999</strong>. On July 13, 1997, the company effected a two-for-one<br />
stock split in the form of a special stock distribution to stockholders<br />
of record as of June 10, 1997. All share, per share,<br />
common stock, stock option and warrant amounts herein<br />
have been restated to reflect the effects of these splits.<br />
Reclassifications. Certain amounts reported in previous<br />
years have been reclassified to conform to the <strong>1999</strong><br />
presentation.<br />
Recent accounting pronouncements. The company<br />
intends to adopt Statement of Financial Accounting Standards<br />
(SFAS) No. 133, “Accounting for Derivative Instruments and<br />
Hedging Activities,” as of the beginning of its fiscal year 2001.<br />
The standard will require the company to recognize all<br />
derivatives on the balance sheet at fair value. Derivatives that<br />
I N T E L C O R P O R A T I O N 1 9 9 9
20<br />
Notes to consolidated financial statements<br />
I N T E L C O R P O R A T I O N 1 9 9 9<br />
are not hedges must be adjusted to fair value through income.<br />
If the derivative is a hedge, depending on the nature of the<br />
hedge, changes in the fair value of derivatives will either be<br />
offset against the change in fair value of the hedged assets,<br />
liabilities or firm commitments through earnings, or recognized<br />
in other comprehensive income until the hedged item<br />
is recognized in earnings. The change in a derivative’s fair<br />
value related to the ineffective portion of a hedge, if any, will<br />
be immediately recognized in earnings. The effect of adopting<br />
the standard is currently being evaluated but is not expected<br />
to have a material effect on the company’s financial position<br />
or overall trends in results of operations.<br />
Common stock<br />
Stock repurchase program. The company has an ongoing<br />
authorization, as amended, from the Board of Directors<br />
to repurchase up to 760 million shares of <strong>Intel</strong>’s common<br />
stock in open market or negotiated transactions. During<br />
<strong>1999</strong>, the company repurchased 71.3 million shares of<br />
common stock at a cost of $4.6 billion. As of December 25,<br />
<strong>1999</strong>, the company had repurchased and retired approximately<br />
659.9 million shares at a cost of $18.2 billion since<br />
the program began in 1990. As of December 25, <strong>1999</strong>,<br />
after allowing for 2 million shares to cover outstanding put<br />
warrants, 98.1 million shares remained available under the<br />
repurchase authorization.<br />
1998 step-up warrants. In 1993, the company issued<br />
160 million 1998 step-up warrants to purchase 160 million<br />
shares of common stock. The warrants became exercisable<br />
in May 1993. Between December 27, 1997 and March 14,<br />
1998, approximately 155 million warrants were exercised<br />
and shares of common stock were issued for proceeds<br />
of $1.6 billion. The expiration date of these warrants was<br />
March 14, 1998.<br />
Put warrants<br />
In a series of private placements from 1991 through <strong>1999</strong>,<br />
the company sold put warrants that entitle the holder of each<br />
warrant to sell to the company, by physical delivery, one share<br />
of common stock at a specified price. Activity during the<br />
past three years is summarized as follows:<br />
Put warrants<br />
outstanding<br />
Cumulative<br />
net premium Number of Potential<br />
(In millions) received warrants obligation<br />
December 28, 1996 $ 335 18.0 $ 275<br />
Sales 288 92.6 3,525<br />
Expirations — (58.0) (1,759)<br />
December 27, 1997 623 52.6 2,041<br />
Sales 40 15.0 588<br />
Exercises — (30.0) (1,199)<br />
Expirations — (32.6) (1,229)<br />
December 26, 1998 663 5.0 201<br />
Sales 20 4.0 261<br />
Expirations — (7.0) (332)<br />
December 25, <strong>1999</strong> $ 683 2.0 $ 130<br />
The amount related to <strong>Intel</strong>’s potential repurchase obligation<br />
has been reclassified from stockholders’ equity to put<br />
warrants. The 2 million put warrants outstanding at December<br />
25, <strong>1999</strong> expired unexercised in January 2000 and had an<br />
average exercise price of $65 per share.<br />
Borrowings<br />
Short-term debt. Non-interest-bearing short-term debt<br />
at fiscal year-ends was as follows:<br />
(In millions) <strong>1999</strong> 1998<br />
Borrowed under lines of credit $ — $ 10<br />
Drafts payable 230 149<br />
Total $ 230 $ 159<br />
The company also borrows under commercial paper<br />
programs. Maximum borrowings under commercial paper<br />
programs reached $200 million during <strong>1999</strong> and $325 million<br />
during 1998. This debt is rated A-1+ by Standard and Poor’s<br />
and P-1 by Moody’s.<br />
Long-term debt. Long-term debt at fiscal year-ends was<br />
as follows:<br />
(In millions) <strong>1999</strong> 1998<br />
Payable in U.S. dollars:<br />
Puerto Rico bonds due 2013 at 3.9%–4.25% $ 110 $ 110<br />
Convertible subordinated notes due 2004 at 4% 210 —<br />
Other U.S. dollar debt 6 5<br />
Payable in other currencies:<br />
Irish punt due 2001–2027 at 4%–13% 583 541<br />
Other non-U.S. dollar debt 46 46<br />
Total $ 955 $ 702<br />
The company has guaranteed repayment of principal<br />
and interest on bonds issued by the Puerto Rico Industrial,<br />
Tourist, Educational, Medical and Environmental Control<br />
Facilities Financing Authority. The bonds are adjustable<br />
and redeemable at the option of either the company or the<br />
bondholder every five years through 2013 and are next<br />
adjustable and redeemable in 2003.<br />
During <strong>1999</strong>, the company assumed 4% convertible subordinated<br />
notes with a principal amount of $115 million as a<br />
result of the Level One Communications, Inc. acquisition (see<br />
“Acquisitions”). The value assigned to the notes was approximately<br />
$212 million, based upon the assumed conversion<br />
price at the date of acquisition. Amortization of the premium<br />
substantially offsets the interest expense on the notes. The<br />
notes are convertible into common stock of the company at<br />
a conversion price of $31.01 per share. After September<br />
2000, the notes are redeemable at the option of the company.<br />
The Irish punt borrowings were made in connection with<br />
the financing of manufacturing facilities in Ireland, and <strong>Intel</strong> has<br />
invested the proceeds in Irish punt denominated instruments<br />
of similar maturity to hedge foreign currency and interest<br />
rate exposures.<br />
Under shelf registration statements filed with the Securities<br />
and Exchange Commission, <strong>Intel</strong> may issue up to $1.4 billion<br />
of additional securities in the form of common stock, preferred
Notes to consolidated financial statements<br />
21<br />
stock, depositary shares, debt securities and warrants to<br />
purchase the company’s or other issuers’ common stock, preferred<br />
stock and debt securities, and, subject to certain limits,<br />
stock index warrants and foreign currency exchange units.<br />
As of December 25, <strong>1999</strong>, aggregate debt maturities were<br />
as follows: 2001–$62 million; 2002–$21 million; 2003–$134<br />
million; 2004–$236 million; and thereafter–$502 million.<br />
Available-for-sale investments<br />
The returns on a majority of the company’s marketable<br />
investments in long-term fixed rate debt and certain equity<br />
securities are swapped to U.S. dollar LIBOR-based returns.<br />
The currency risks of investments denominated in foreign currencies<br />
are hedged with foreign currency borrowings, currency<br />
forward contracts or currency interest rate swaps (see<br />
“Derivative financial instruments” under “Accounting policies”).<br />
Investments with maturities of greater than six months<br />
consist primarily of A and A2 or better rated financial instruments<br />
and counterparties. Investments with maturities of up<br />
to six months consist primarily of A-1 and P-1 or better rated<br />
financial instruments and counterparties. Foreign government<br />
regulations imposed upon investment alternatives of foreign<br />
subsidiaries, or the absence of A and A2 rated counterparties<br />
in certain countries, result in some minor exceptions. <strong>Intel</strong>’s<br />
practice is to obtain and secure available collateral from<br />
counterparties against obligations whenever <strong>Intel</strong> deems<br />
appropriate. At December 25, <strong>1999</strong>, investments were placed<br />
with approximately 175 different counterparties.<br />
Available-for-sale investments at December 25, <strong>1999</strong> were<br />
as follows:<br />
Gross Gross Estimated<br />
unrealized unrealized fair<br />
(In millions) Cost gains losses value<br />
U.S. government securities $ 2,746 $ — $ (5) $ 2,741<br />
Commercial paper 2,971 — (2) 2,969<br />
Floating rate notes 2,152 — (4) 2,148<br />
Bank time deposits 2,022 — (3) 2,019<br />
Corporate bonds 865 49 (9) 905<br />
Loan participations 625 — — 625<br />
Fixed rate notes 275 — (1) 274<br />
Securities of foreign<br />
governments 59 — — 59<br />
Other debt securities 33 — (1) 32<br />
Total debt securities 11,748 49 (25) 11,772<br />
Marketable strategic<br />
equity securities 1,277 5,882 (38) 7,121<br />
Preferred stock and<br />
other equity 121 — — 121<br />
Total equity securities 1,398 5,882 (38) 7,242<br />
Swaps hedging investments<br />
in debt securities — 12 (50) (38)<br />
Currency forward contracts<br />
hedging investments<br />
in debt securities — 2 — 2<br />
Total available-for-sale<br />
investments 13,146 5,945 (113) 18,978<br />
Less amounts classified<br />
as cash equivalents (3,362) — — (3,362)<br />
$ 9,784 $ 5,945 $ (113) $15,616<br />
Available-for-sale investments at December 26, 1998 were<br />
as follows:<br />
Gross Gross Estimated<br />
unrealized unrealized fair<br />
(In millions) Cost gains losses value<br />
U.S. government securities $ 2,824 $ — $ (11) $ 2,813<br />
Commercial paper 2,694 5 (2) 2,697<br />
Floating rate notes 1,273 2 (2) 1,273<br />
Corporate bonds 1,153 51 (17) 1,187<br />
Bank time deposits 1,135 1 (1) 1,135<br />
Loan participations 625 — — 625<br />
Repurchase agreements 124 — — 124<br />
Securities of foreign<br />
governments 36 1 (1) 36<br />
Other debt securities 160 — — 160<br />
Total debt securities 10,024 60 (34) 10,050<br />
Hedged equity 100 — (2) 98<br />
Marketable strategic<br />
equity securities 822 979 (44) 1,757<br />
Preferred stock and<br />
other equity 140 1 — 141<br />
Total equity securities 1,062 980 (46) 1,996<br />
Options creating synthetic<br />
money market instruments 474 — — 474<br />
Swaps hedging investments<br />
in debt securities — 19 (52) (33)<br />
Swaps hedging investments<br />
in equity securities — 2 — 2<br />
Currency forward contracts<br />
hedging investments<br />
in debt securities — 2 (4) (2)<br />
Total available-for-sale<br />
investments 11,560 1,063 (136) 12,487<br />
Less amounts classified<br />
as cash equivalents (1,850) — — (1,850)<br />
$ 9,710 $ 1,063 $ (136) $10,637<br />
Available-for-sale securities with a fair value at the date<br />
of sale of $1 billion, $227 million and $153 million were sold<br />
in <strong>1999</strong>, 1998 and 1997, respectively. The gross realized<br />
gains on these sales totaled $883 million, $185 million and<br />
$106 million, respectively.<br />
The amortized cost and estimated fair value of investments<br />
in debt securities at December 25, <strong>1999</strong>, by contractual<br />
maturity, were as follows:<br />
Estimated<br />
(In millions) Cost fair value<br />
Due in 1 year or less $11,031 $11,054<br />
Due in 1–2 years 192 194<br />
Due in 2–5 years 58 58<br />
Due after 5 years 467 466<br />
Total investments in debt securities $11,748 $11,772<br />
I N T E L C O R P O R A T I O N 1 9 9 9
22 Notes to consolidated financial statements<br />
I N T E L C O R P O R A T I O N 1 9 9 9<br />
Derivative financial instruments<br />
Outstanding notional amounts for derivative financial<br />
instruments at fiscal year-ends were as follows:<br />
(In millions) <strong>1999</strong> 1998<br />
Swaps hedging investments in debt securities $ 2,002 $ 2,526<br />
Swaps hedging investments in equity securities $ — $ 100<br />
Swaps hedging debt $ 156 $ 156<br />
Currency forward contracts $ 845 $ 830<br />
Options creating synthetic money<br />
market instruments $ — $ 2,086<br />
While the contract or notional amounts provide one<br />
measure of the volume of these transactions, they do not represent<br />
the amount of the company’s exposure to credit risk.<br />
The amounts potentially subject to credit risk (arising from<br />
the possible inability of counterparties to meet the terms of<br />
their contracts) are generally limited to the amounts, if any, by<br />
which a counterparty’s obligations exceed the obligations of<br />
<strong>Intel</strong> with that counterparty. The company controls credit<br />
risk through credit approvals, limits and monitoring procedures.<br />
Credit rating criteria for derivative financial instruments<br />
are similar to those for investments.<br />
Swap agreements. The company utilizes swap agreements<br />
to exchange the foreign currency, equity and interest<br />
rate returns of its investment and debt portfolios for floating<br />
U.S. dollar interest rate based returns. The floating rates on<br />
swaps are based primarily on U.S. dollar LIBOR and are<br />
reset on a monthly, quarterly or semiannual basis.<br />
Pay rates on swaps hedging investments in debt securities<br />
match the yields on the underlying investments they hedge.<br />
Payments on swaps hedging investments in equity securities<br />
match the equity returns on the underlying investments they<br />
hedge. Receive rates on swaps hedging debt match the<br />
expense on the underlying debt they hedge. Maturity dates of<br />
swaps match those of the underlying investment or the debt<br />
they hedge. There is approximately a one-to-one matching of<br />
swaps to investments and debt. Swap agreements generally<br />
remain in effect until expiration.<br />
Weighted average pay and receive rates, average maturities<br />
and range of maturities on swaps at December 25, <strong>1999</strong> were<br />
as follows:<br />
Weighted<br />
Weighted average Weighted<br />
average receive average Range of<br />
pay rate rate maturity maturities<br />
Swaps hedging investments<br />
in U.S. dollar debt securities 6.0% 6.0% 1.0 years 0–4 years<br />
Swaps hedging investments<br />
in foreign currency<br />
debt securities 5.6% 5.7% 1.6 years 0–4 years<br />
Swaps hedging debt 5.5% 5.7% 3.8 years 1–4 years<br />
Note: Pay and receive rates are based on the reset rates that were in effect at<br />
December 25, <strong>1999</strong>.<br />
Other foreign currency instruments. <strong>Intel</strong> transacts business<br />
in various foreign currencies, primarily Japanese yen and<br />
certain other Asian and European currencies. The company<br />
has established revenue and balance sheet hedging programs<br />
to protect against reductions in value and volatility of future<br />
cash flows caused by changes in foreign exchange rates. The<br />
company utilizes currency forward contracts and currency<br />
options in these hedging programs. The maturities on these<br />
instruments are less than 12 months.<br />
Fair values of financial instruments<br />
The estimated fair values of financial instruments outstanding<br />
at fiscal year-ends were as follows:<br />
<strong>1999</strong> 1998<br />
Carrying Estimated Carrying Estimated<br />
(In millions) amount fair value amount fair value<br />
Cash and cash equivalents $ 3,695 $ 3,695 $ 2,038 $ 2,038<br />
Short-term investments $ 7,740 $ 7,740 $ 4,821 $ 4,821<br />
Trading assets $ 388 $ 388 $ 316 $ 316<br />
Marketable strategic<br />
equity securities $ 7,121 $ 7,121 $ 1,757 $ 1,757<br />
Other long-term investments $ 791 $ 791 $ 3,618 $ 3,618<br />
Non-marketable instruments $ 1,177 $ 3,410 $ 571 $ 716<br />
Options creating synthetic<br />
money market instruments $ — $ — $ 474 $ 474<br />
Swaps hedging investments<br />
in debt securities $ (38) $ (38) $ (33) $ (33)<br />
Swaps hedging investments<br />
in equity securities $ — $ — $ 2 $ 2<br />
Short-term debt $ (230) $ (230) $ (159) $ (159)<br />
Long-term debt $ (955) $ (1,046) $ (702) $ (696)<br />
Swaps hedging debt $ — $ (5) $ — $ 1<br />
Currency forward contracts $ 1 $ — $ (1) $ (1)<br />
Concentrations of credit risk<br />
Financial instruments that potentially subject the company<br />
to concentrations of credit risk consist principally of investments<br />
and trade receivables. <strong>Intel</strong> places its investments with<br />
high-credit-quality counterparties and, by policy, limits the<br />
amount of credit exposure to any one counterparty based on<br />
<strong>Intel</strong>’s analysis of that counterparty’s relative credit standing.<br />
A majority of the company’s trade receivables are derived<br />
from sales to manufacturers of computer systems, with the<br />
remainder spread across various other industries. The<br />
company’s five largest customers accounted for approximately<br />
44% of net revenues for <strong>1999</strong>. At December 25, <strong>1999</strong>,<br />
these customers accounted for approximately 35% of net<br />
accounts receivable.<br />
The company endeavors to keep pace with the evolving<br />
computer and Internet-related industries, and has adopted<br />
credit policies and standards intended to accommodate industry<br />
growth and inherent risk. Management believes that credit<br />
risks are moderated by the diversity of its end customers<br />
and geographic sales areas. <strong>Intel</strong> performs ongoing credit<br />
evaluations of its customers’ financial condition and requires<br />
collateral or other credit support as deemed necessary.
Notes to consolidated financial statements<br />
23<br />
Interest income and other<br />
(In millions) <strong>1999</strong> 1998 1997<br />
Interest income $ 618 $ 593 $ 562<br />
Gains on sales of marketable<br />
strategic equity securities 883 185 106<br />
Foreign currency gains (losses), net (1) 11 63<br />
Other income (expense), net (3) 3 68<br />
Total $ 1,497 $ 792 $ 799<br />
Comprehensive income<br />
The components of other comprehensive income and<br />
related tax effects were as follows:<br />
(In millions) <strong>1999</strong> 1998 1997<br />
Gains on investments during the year,<br />
net of tax of $(2,026), $(357) and $(4)<br />
in <strong>1999</strong>, 1998 and 1997, respectively $ 3,762 $ 665 $ 5<br />
Less: adjustment for gains realized<br />
and included in net income, net of<br />
tax of $309, $65 and $37 in <strong>1999</strong>,<br />
1998 and 1997, respectively (574) (120) (69)<br />
Other comprehensive income $ 3,188 $ 545 $ (64)<br />
Accumulated other comprehensive income presented in<br />
the accompanying consolidated balance sheets consists of<br />
the accumulated net unrealized gain on available-for-sale<br />
investments.<br />
Provision for taxes<br />
Income before taxes and the provision for taxes consisted<br />
of the following:<br />
(In millions) <strong>1999</strong> 1998 1997<br />
Income before taxes:<br />
U.S. $ 7,239 $ 6,677 $ 8,033<br />
Foreign 3,989 2,460 2,626<br />
Total income before taxes $11,228 $ 9,137 $10,659<br />
Provision for taxes:<br />
Federal:<br />
Current $ 3,356 $ 2,321 $ 2,930<br />
Deferred (162) 145 30<br />
3,194 2,466 2,960<br />
State:<br />
Current 393 320 384<br />
Foreign:<br />
Current 384 351 394<br />
Deferred (57) (68) (24)<br />
327 283 370<br />
Total provision for taxes $ 3,914 $ 3,069 $ 3,714<br />
Effective tax rate 34.9% 33.6% 34.8%<br />
The provision for taxes reconciles to the amount computed<br />
by applying the statutory federal rate of 35% to income before<br />
taxes as follows:<br />
(In millions) <strong>1999</strong> 1998 1997<br />
Computed expected tax $ 3,930 $ 3,198 $ 3,731<br />
State taxes, net of federal benefits 255 208 249<br />
Foreign income taxed at different rates (239) (339) (111)<br />
Non-deductible acquisition-related costs 274 74 —<br />
Other (306) (72) (155)<br />
Provision for taxes $ 3,914 $ 3,069 $ 3,714<br />
Deferred income taxes reflect the net tax effects of temporary<br />
differences between the carrying amount of assets and<br />
liabilities for financial reporting purposes and the amounts<br />
used for income tax purposes.<br />
Significant components of the company’s deferred tax<br />
assets and liabilities at fiscal year-ends were as follows:<br />
(In millions) <strong>1999</strong> 1998<br />
Deferred tax assets<br />
Accrued compensation and benefits $ 111 $ 117<br />
Accrued advertising 66 62<br />
Deferred income 182 181<br />
Inventory valuation and related reserves 91 106<br />
Interest and taxes 48 52<br />
Other, net 175 100<br />
673 618<br />
Deferred tax liabilities<br />
Depreciation (703) (911)<br />
Acquired intangibles (214) —<br />
Unremitted earnings of certain subsidiaries (172) (152)<br />
Unrealized gain on investments (2,041) (324)<br />
(3,130) (1,387)<br />
Net deferred tax (liability) $ (2,457) $ (769)<br />
U.S. income taxes were not provided for on a cumulative<br />
total of approximately $2.2 billion of undistributed earnings<br />
for certain non-U.S. subsidiaries. The company intends to<br />
reinvest these earnings indefinitely in operations outside the<br />
United States.<br />
The years 1998 and 1997 are currently under examination<br />
by the Internal Revenue Service. Management believes that<br />
adequate amounts of tax and related interest and penalties,<br />
if any, have been provided for any adjustments that may<br />
result for these years.<br />
I N T E L C O R P O R A T I O N 1 9 9 9<br />
The tax benefit associated with dispositions from employee<br />
stock plans reduced taxes currently payable for <strong>1999</strong> by<br />
$506 million ($415 million and $224 million for 1998 and 1997,<br />
respectively).
24<br />
Notes to consolidated financial statements<br />
I N T E L C O R P O R A T I O N 1 9 9 9<br />
Employee benefit plans<br />
Stock option plans. <strong>Intel</strong> has a stock option plan under<br />
which officers, key employees and non-employee directors<br />
may be granted options to purchase shares of the company’s<br />
authorized but unissued common stock. The company also<br />
has a stock option plan under which stock options may be<br />
granted to employees other than officers and directors. The<br />
company’s Executive Long-Term Stock Option Plan, under<br />
which certain key employees, including officers, have been<br />
granted stock options, terminated in September 1998.<br />
Although this termination will not affect options granted<br />
prior to this date, no further grants may be made under this<br />
plan. Under all of the plans, the option exercise price is equal<br />
to the fair market value of <strong>Intel</strong> common stock at the date of<br />
grant. During <strong>1999</strong>, <strong>Intel</strong> also assumed the stock option<br />
plans and the outstanding options of certain acquired companies.<br />
No additional options will be granted under these<br />
assumed plans.<br />
Options granted by <strong>Intel</strong> currently expire no later than<br />
10 years from the grant date and generally vest within 5<br />
years. Proceeds received by the company from exercises<br />
are credited to common stock and capital in excess of par<br />
value. Additional information with respect to stock option<br />
plan activity was as follows:<br />
Outstanding options<br />
Weighted<br />
Shares<br />
average<br />
available Number exercise<br />
(Shares in millions) for options of shares price<br />
December 28, 1996 130.6 337.8 $ 7.49<br />
Additional shares reserved 260.0 — —<br />
Grants (63.0) 63.0 $ 36.23<br />
Exercises — (47.2) $ 3.06<br />
Cancellations 8.8 (8.8) $ 16.38<br />
December 27, 1997 336.4 344.8 $ 13.12<br />
Grants (48.0) 48.0 $ 38.35<br />
Exercises — (63.0) $ 4.59<br />
Cancellations 17.3 (17.3) $ 23.64<br />
Lapsed under terminated plans (38.5) — —<br />
December 26, 1998 267.2 312.5 $ 18.13<br />
Grants (40.6) 40.6 $ 63.91<br />
Options assumed in acquisitions — 12.8 $ 25.74<br />
Exercises — (48.0) $ 6.64<br />
Cancellations 12.3 (12.3) $ 32.85<br />
December 25, <strong>1999</strong> 238.9 305.6 $ 25.73<br />
Options exercisable at:<br />
December 27, 1997 115.2 $ 3.66<br />
December 26, 1998 103.8 $ 6.11<br />
December 25, <strong>1999</strong> 103.2 $ 9.42<br />
The range of option exercise prices for options outstanding<br />
at December 25, <strong>1999</strong> was $0.15 to $84.97. The range of<br />
exercise prices for options is wide due primarily to the<br />
increasing price of the company’s stock over the period in<br />
which the option grants were awarded, in addition to the<br />
impact of assumed options of acquired companies that had<br />
experienced even greater price appreciation.<br />
The following tables summarize information about options<br />
outstanding at December 25, <strong>1999</strong>:<br />
Outstanding options<br />
Weighted<br />
average Weighted<br />
Number of contract- average<br />
shares (in ual life exercise<br />
Range of exercise prices millions) (in years) price<br />
$0.15–$7.58 59.6 2.4 $ 4.28<br />
$8.66–$15.09 62.9 4.8 $ 10.46<br />
$15.12–$37.45 91.4 6.7 $ 25.61<br />
$37.47–$84.97 91.7 8.6 $ 50.28<br />
Total 305.6 6.0 $ 25.73<br />
Exercisable options<br />
Weighted<br />
Number of average<br />
shares (in exercise<br />
Range of exercise prices millions) price<br />
$0.15–$7.58 59.2 $ 4.29<br />
$8.66–$15.09 28.4 $ 9.11<br />
$15.12–$37.45 12.3 $ 25.87<br />
$37.47–$84.97 3.3 $ 43.04<br />
Total 103.2 $ 9.42<br />
These options will expire if not exercised at specific dates<br />
through December 2009. Option exercise prices for options<br />
exercised during the three-year period ended December 25,<br />
<strong>1999</strong> ranged from $0.15 to $61.41.<br />
Stock Participation Plan. Under this plan, eligible<br />
employees may purchase shares of <strong>Intel</strong>’s common stock at<br />
85% of fair market value at specific, predetermined dates.<br />
Of the 472 million shares authorized to be issued under the<br />
plan, 74.3 million shares remained available for issuance<br />
at December 25, <strong>1999</strong>. Employees purchased 5.4 million<br />
shares in <strong>1999</strong> (6.3 million in 1998 and 9.0 million in 1997)<br />
for $241 million ($229 million and $191 million in 1998 and<br />
1997, respectively).<br />
Pro forma information. The company has elected to<br />
follow APB Opinion No. 25, “Accounting for Stock Issued to<br />
Employees,” in accounting for its employee stock options<br />
because, as discussed below, the alternative fair value<br />
accounting provided for under SFAS No. 123, “Accounting<br />
for Stock-Based Compensation,” requires the use of option<br />
valuation models that were not developed for use in valuing<br />
employee stock options. Under APB No. 25, because the<br />
exercise price of the company’s employee stock options<br />
equals the market price of the underlying stock on the date<br />
of grant, no compensation expense is recognized in the<br />
company’s financial statements.<br />
Pro forma information regarding net income and earnings<br />
per share is required by SFAS No.123. This information is<br />
required to be determined as if the company had accounted<br />
for its employee stock options (including shares issued under<br />
the Stock Participation Plan, collectively called “options”)<br />
granted subsequent to December 31, 1994 under the fair
Notes to consolidated financial statements<br />
25<br />
value method of that statement. The fair value of options<br />
granted in <strong>1999</strong>, 1998 and 1997 reported below has been<br />
estimated at the date of grant using a Black-Scholes<br />
option pricing model with the following weighted average<br />
assumptions:<br />
Employee stock options <strong>1999</strong> 1998 1997<br />
Expected life (in years) 6.5 6.5 6.5<br />
Risk-free interest rate 5.2% 5.3% 6.6%<br />
Volatility .38 .36 .36<br />
Dividend yield .2% .2% .1%<br />
Stock Participation Plan shares <strong>1999</strong> 1998 1997<br />
Expected life (in years) .5 .5 .5<br />
Risk-free interest rate 4.9% 5.2% 5.3%<br />
Volatility .45 .42 .40<br />
Dividend yield .2% .2% .1%<br />
The Black-Scholes option valuation model was developed<br />
for use in estimating the fair value of traded options that have<br />
no vesting restrictions and are fully transferable. In addition,<br />
option valuation models require the input of highly subjective<br />
assumptions, including the expected stock price volatility.<br />
Because the company’s options have characteristics significantly<br />
different from those of traded options, and because<br />
changes in the subjective input assumptions can materially<br />
affect the fair value estimate, in the opinion of management,<br />
the existing models do not necessarily provide a reliable<br />
single measure of the fair value of its options. The weighted<br />
average estimated fair value of employee stock options<br />
granted during <strong>1999</strong>, 1998 and 1997 was $29.53, $17.91 and<br />
$17.67 per share, respectively, excluding options assumed<br />
through acquired companies. The weighted average estimated<br />
fair value of shares granted under the Stock Participation<br />
Plan during <strong>1999</strong>, 1998 and 1997 was $19.81, $10.92 and<br />
$11.04, respectively.<br />
For purposes of pro forma disclosures, the estimated fair<br />
value of the options is amortized to expense over the options’<br />
vesting periods. The company’s pro forma information follows:<br />
(In millions—except per share amounts) <strong>1999</strong> 1998 1997<br />
Pro forma net income $ 6,860 $ 5,755 $ 6,735<br />
Pro forma basic earnings per share $ 2.06 $ 1.73 $ 2.06<br />
Pro forma diluted earnings per share $ 1.98 $ 1.66 $ 1.88<br />
Retirement plans. The company provides tax-qualified<br />
profit-sharing retirement plans (the “Qualified Plans”) for the<br />
benefit of eligible employees in the U.S. and Puerto Rico and<br />
certain foreign countries. The plans are designed to provide<br />
employees with an accumulation of funds for retirement on<br />
a tax-deferred basis and provide for annual discretionary<br />
employer contributions to trust funds.<br />
The company also provides a non-qualified profit-sharing<br />
retirement plan (the “Non-Qualified Plan”) for the benefit of<br />
eligible employees in the U.S. This plan is designed to permit<br />
certain discretionary employer contributions in excess of the<br />
tax limits applicable to the Qualified Plans and to permit<br />
employee deferrals in excess of certain tax limits. This plan<br />
is unfunded.<br />
The company expensed $294 million for the Qualified Plans<br />
and the Non-Qualified Plan in <strong>1999</strong> ($291 million in 1998<br />
and $273 million in 1997). The company expects to fund<br />
approximately $333 million for the <strong>1999</strong> contribution to the<br />
Qualified Plans and to allocate approximately $9 million for<br />
the Non-Qualified Plan, including the utilization of amounts<br />
expensed in prior years. A remaining accrual of approximately<br />
$157 million carried forward from prior years is expected to<br />
be contributed to these plans when allowable under IRS<br />
regulations and plan rules.<br />
Contributions made by the company vest based on the<br />
employee’s years of service. Vesting begins after three years<br />
of service in 20% annual increments until the employee is<br />
100% vested after seven years.<br />
The company provides tax-qualified defined-benefit pension<br />
plans for the benefit of eligible employees in the U.S. and<br />
Puerto Rico. Each plan provides for minimum pension benefits<br />
that are determined by a participant’s years of service, final<br />
average compensation (taking into account the participant’s<br />
social security wage base) and the value of the company’s<br />
contributions, plus earnings, in the Qualified Plan. If the<br />
participant’s balance in the Qualified Plan exceeds the pension<br />
guarantee, the participant will receive benefits from the<br />
Qualified Plan only. <strong>Intel</strong>’s funding policy is consistent with<br />
the funding requirements of federal laws and regulations.<br />
The company also provides defined-benefit pension plans in<br />
certain foreign countries. The company’s funding policy for<br />
foreign defined-benefit pension plans is consistent with the<br />
local requirements in each country. These defined-benefit<br />
pension plans had no material impact on the company’s<br />
financial statements for the periods presented.<br />
The company provides postemployment benefits for retired<br />
employees in the U.S. Upon retirement, eligible employees<br />
are credited with a defined dollar amount based on years of<br />
service. These credits can be used to pay all or a portion of<br />
the cost to purchase coverage in an <strong>Intel</strong>-sponsored medical<br />
plan. These benefits had no material impact on the company’s<br />
financial statements for the periods presented.<br />
Acquisitions<br />
During <strong>1999</strong> and 1998, the company completed a number<br />
of acquisitions that were accounted for using the purchase<br />
method of accounting.<br />
In February <strong>1999</strong>, the company acquired Shiva <strong>Corporation</strong><br />
in a cash transaction. Shiva’s products include remote access<br />
and virtual private networking solutions for the small to medium<br />
enterprise market segment and the remote access needs of<br />
campuses and branch offices.<br />
I N T E L C O R P O R A T I O N 1 9 9 9
26<br />
Notes to consolidated financial statements<br />
I N T E L C O R P O R A T I O N 1 9 9 9<br />
In July <strong>1999</strong>, the company acquired privately held Softcom<br />
Microsystems, Inc. in a cash transaction. Softcom develops<br />
and markets semiconductor products for original equipment<br />
manufacturers in the networking and communications market<br />
segments. Softcom’s high-performance components are<br />
designed for networking gear (access devices, routers and<br />
switches) used to direct voice and data across the Internet<br />
as well as traditional enterprise networks.<br />
In July <strong>1999</strong>, the company acquired Dialogic <strong>Corporation</strong><br />
in a cash transaction. The acquisition is aimed at expanding<br />
the company’s standard high-volume server business in<br />
the networking and telecommunications market segments.<br />
Dialogic designs, manufactures and markets computer<br />
hardware and software enabling technology for computer<br />
telephony systems.<br />
In August <strong>1999</strong>, the company acquired Level One Communications<br />
in a stock-for-stock transaction. Approximately<br />
34 million shares of <strong>Intel</strong> common stock were issued in<br />
connection with the purchase. In addition, <strong>Intel</strong> assumed<br />
Level One Communications’ convertible debt with a fair value<br />
of approximately $212 million. Level One Communications<br />
provides silicon connectivity solutions for high-speed telecommunications<br />
and networking applications.<br />
In September <strong>1999</strong>, the company acquired privately held<br />
NetBoost <strong>Corporation</strong> in a cash transaction. NetBoost<br />
develops and markets hardware and software solutions for<br />
communications equipment suppliers and independent<br />
software vendors in the networking and communications<br />
market segments.<br />
In October <strong>1999</strong>, the company acquired privately held IPivot,<br />
Inc. in a cash transaction. IPivot designs and manufactures<br />
Internet commerce equipment that manages large volumes<br />
of Internet traffic more securely and efficiently.<br />
In November <strong>1999</strong>, the company acquired DSP Communications,<br />
Inc. in a cash transaction. DSP Communications is a<br />
leading supplier of solutions for digital cellular communications<br />
products, including chipsets, reference designs, software and<br />
other key technologies for lightweight wireless handsets.<br />
In January 1998, the company acquired Chips and Technologies,<br />
Inc. in a cash transaction. Chips and Technologies<br />
was a supplier of graphics accelerator chips for mobile<br />
computing products.<br />
In May 1998, the company purchased the semiconductor<br />
operations of Digital Equipment <strong>Corporation</strong>. Assets acquired<br />
consisted primarily of property, plant and equipment. Following<br />
the completion of the purchase, lawsuits between the companies<br />
that had been pending since 1997 were dismissed with<br />
prejudice.<br />
For <strong>1999</strong> and 1998, $392 million and $165 million, respectively,<br />
were allocated to purchased in-process research and<br />
development, and expensed upon acquisition of the above<br />
companies, because the technological feasibility of products<br />
under development had not been established and no future<br />
alternative uses existed.<br />
These purchase transactions are further described below:<br />
Purchased<br />
in-process<br />
research Goodwill &<br />
Consid- & devel- identified Form of<br />
(In millions) eration opment intangibles consideration<br />
<strong>1999</strong><br />
Shiva $ 132 $ — $ 99 Cash and options<br />
assumed<br />
Softcom $ 149 $ 9 $ 139 Cash and options<br />
assumed<br />
Dialogic $ 732 $ 83 $ 614 Cash and options<br />
assumed<br />
Level One<br />
Communications $ 2,137 $ 231 $ 2,007 Common stock<br />
and options<br />
assumed<br />
NetBoost $ 215 $ 10 $ 205 Cash and options<br />
assumed<br />
IPivot $ 496 $ — $ 505 Cash and options<br />
assumed<br />
DSP<br />
Communications $ 1,599 $ 59 $ 1,491 Cash and options<br />
assumed<br />
1998<br />
Chips and<br />
Technologies $ 337 $ 165 $ 126 Cash and options<br />
assumed<br />
Semiconductor<br />
operations<br />
of Digital $ 585 $ — $ 32 Cash<br />
Consideration includes the cash paid, less any cash acquired; the value<br />
of stock issued and options assumed; and excludes any debt assumed.<br />
In addition to the transactions described above, <strong>Intel</strong><br />
purchased other businesses in smaller transactions. The<br />
charge for purchased in-process research and development<br />
related to these other acquisitions was not significant. The<br />
total amount allocated to goodwill and identified intangibles<br />
for these transactions was $175 million, which represents a<br />
substantial majority of the consideration for these transactions.<br />
The consolidated financial statements include the operating<br />
results of acquired businesses from the dates of acquisition.<br />
The operating results of Softcom, Level One Communications<br />
and NetBoost have been included in the Network Communications<br />
Group operating segment. The operating results<br />
of Shiva, Dialogic and IPivot have been included in the<br />
Communications Products Group operating segment. The<br />
operating results of DSP Communications have been included<br />
in the Wireless Communications and Computing Group operating<br />
segment. All of these groups are part of the “all other”<br />
category for segment reporting purposes. The operating<br />
results of Chips and Technologies have been included in the<br />
<strong>Intel</strong> Architecture Business Group operating segment.
Notes to consolidated financial statements<br />
27<br />
The unaudited pro forma information below assumes that<br />
companies acquired in <strong>1999</strong> and 1998 had been acquired at<br />
the beginning of 1998 and includes the effect of amortization<br />
of goodwill and identified intangibles from that date. The<br />
impact of charges for purchased in-process research and<br />
development has been excluded. This is presented for informational<br />
purposes only and is not necessarily indicative of<br />
the results of future operations or results that would have<br />
been achieved had the acquisitions taken place at the<br />
beginning of 1998.<br />
(In millions, except per share amounts—unaudited) <strong>1999</strong> 1998<br />
Net revenues $29,894 $27,101<br />
Net income $ 6,948 $ 5,218<br />
Basic earnings per common share $ 2.08 $ 1.55<br />
Diluted earnings per common share $ 1.99 $ 1.46<br />
Commitments<br />
The company leases a portion of its capital equipment and<br />
certain of its facilities under operating leases that expire at<br />
various dates through 2010. Rental expense was $71 million<br />
in <strong>1999</strong>, $64 million in 1998 and $69 million in 1997. Minimum<br />
rental commitments under all non-cancelable leases with<br />
an initial term in excess of one year are payable as follows:<br />
2000–$68 million; 2001–$57 million; 2002–$53 million;<br />
2003–$41 million; 2004–$32 million; 2005 and beyond–<br />
$77 million. Commitments for construction or purchase of<br />
property, plant and equipment approximated $2.5 billion at<br />
December 25, <strong>1999</strong>. In connection with certain manufacturing<br />
arrangements, <strong>Intel</strong> had minimum purchase commitments<br />
of approximately $59 million at December 25, <strong>1999</strong> for<br />
flash memory.<br />
Contingencies<br />
In November 1997, Intergraph <strong>Corporation</strong> filed suit in<br />
Federal District Court in Alabama for patent infringement<br />
and generally alleging that <strong>Intel</strong> attempted to coerce Intergraph<br />
into relinquishing certain patent rights. The suit alleges that<br />
<strong>Intel</strong> infringes five Intergraph microprocessor-related patents,<br />
and includes alleged violations of antitrust laws and various<br />
state law claims. The suit seeks injunctive relief, damages<br />
and prejudgment interest, and further alleges that <strong>Intel</strong>’s<br />
infringement is willful and that any damages awarded should<br />
be trebled. Intergraph’s expert witness has claimed that<br />
Intergraph is entitled to damages of approximately $2.2 billion<br />
for <strong>Intel</strong>’s alleged patent infringement, $500 million for the<br />
alleged antitrust violations and an undetermined amount for<br />
the alleged state law violations. <strong>Intel</strong> has also counterclaimed<br />
that the Intergraph patents are invalid and further alleges<br />
infringement of seven <strong>Intel</strong> patents, breach of contract and<br />
misappropriation of trade secrets. In October <strong>1999</strong>, the court<br />
reconsidered an earlier adverse ruling and granted <strong>Intel</strong>’s<br />
motion for summary judgment that the Intergraph patents<br />
are licensed to <strong>Intel</strong>, and dismissed all of Intergraph’s patent<br />
infringement claims with prejudice. Intergraph has appealed<br />
this ruling. In November <strong>1999</strong>, the Court of Appeals for the<br />
Federal Circuit reversed the District Court’s April 1998 order<br />
requiring <strong>Intel</strong> to continue to deal with Intergraph on the<br />
same terms as it treats allegedly similarly situated customers<br />
with respect to confidential information and products supply.<br />
The company disputes Intergraph’s remaining antitrust and<br />
state law claims, and intends to defend the lawsuit vigorously.<br />
The company is currently party to various legal proceedings,<br />
including that noted above. While management, including<br />
internal counsel, currently believes that the ultimate outcome<br />
of these proceedings, individually and in the aggregate, will<br />
not have a material adverse effect on the company’s financial<br />
position or overall trends in results of operations, litigation is<br />
subject to inherent uncertainties. Were an unfavorable ruling to<br />
occur, there exists the possibility of a material adverse impact<br />
on the net income of the period in which the ruling occurs.<br />
<strong>Intel</strong> has been named to the California and U.S. Superfund<br />
lists for three of its sites and has completed, along with two<br />
other companies, a Remedial Investigation/Feasibility study<br />
with the U.S. Environmental Protection Agency (EPA) to<br />
evaluate the groundwater in areas adjacent to one of its<br />
former sites. The EPA has issued a Record of Decision with<br />
respect to a groundwater cleanup plan at that site, including<br />
expected costs to complete. Under the California and U.S.<br />
Superfund statutes, liability for cleanup of this site and the<br />
adjacent area is joint and several. The company, however, has<br />
reached agreement with those same two companies which<br />
significantly limits the company’s liabilities under the proposed<br />
cleanup plan. Also, the company has completed extensive<br />
studies at its other sites and is engaged in cleanup at several<br />
of these sites. In the opinion of management, including internal<br />
counsel, the potential losses to the company in excess of<br />
amounts already accrued arising out of these matters would<br />
not have a material adverse effect on the company’s financial<br />
position or overall trends in results of operations, even if<br />
joint and several liability were to be assessed.<br />
The estimate of the potential impact on the company’s<br />
financial position or overall results of operations for the above<br />
legal proceedings could change in the future.<br />
Operating segment and geographic information<br />
<strong>Intel</strong> designs, develops, manufactures and markets computer,<br />
networking and communications products at various<br />
levels of integration. The company is organized into five<br />
product-line operating segments: the <strong>Intel</strong> Architecture<br />
Business Group, the Wireless Communications and Computing<br />
Group (formed out of the former Computing Enhancement<br />
Group), the Communications Products Group (formed during<br />
<strong>1999</strong>), the Network Communications Group and the New<br />
Business Group. Each group has a vice president who reports<br />
directly to the Chief Executive Officer (CEO). The CEO<br />
allocates resources to each group using information on<br />
their revenues and operating profits before interest and<br />
taxes. The CEO has been identified as the Chief Operating<br />
Decision Maker.<br />
I N T E L C O R P O R A T I O N 1 9 9 9
28<br />
Notes to consolidated financial statements<br />
I N T E L C O R P O R A T I O N 1 9 9 9<br />
The <strong>Intel</strong> Architecture Business Group’s products include<br />
microprocessors and related board-level products based<br />
on the P6 microarchitecture (including the Pentium ® III, <strong>Intel</strong> ®<br />
Celeron TM and Pentium ® III Xeon TM processors). Sales of microprocessors<br />
and related board-level products based on the<br />
P6 microarchitecture represented a substantial majority<br />
of the company’s <strong>1999</strong> revenues and gross margin. As a<br />
result of a reorganization during <strong>1999</strong>, the <strong>Intel</strong> Architecture<br />
Business Group’s products also include chipsets. The<br />
Wireless Communications and Computing Group’s products<br />
are component-level hardware and software for digital<br />
cellular communications, including flash memory, low-power<br />
processors and digital signal processors. The Communications<br />
Products Group’s products consist of system-level hardware,<br />
software and support services for e-Business data centers<br />
and communications access solutions. The Network Communications<br />
Group’s products include communications silicon<br />
components and embedded control chips (formerly included<br />
in the Computing Enhancement Group) for networking and<br />
communications applications. The New Business Group<br />
provides e-Commerce data center services as well as products<br />
such as connected peripherals and security access software.<br />
<strong>Intel</strong>’s products in all operating groups are sold directly<br />
to original equipment manufacturers, retail and industrial<br />
distributors, and resellers throughout the world.<br />
In addition to these operating segments, the sales and<br />
marketing, manufacturing, finance and administration groups<br />
also report to the CEO. Expenses of these groups are<br />
allocated to the operating segments and are included in<br />
the operating results reported below. Certain corporate-level<br />
operating expenses (primarily the amount by which profitdependent<br />
bonus expenses differ from a targeted level<br />
recorded by the operating segments) and reserves for<br />
deferred income on shipments to distributors are not allocated<br />
to operating segments and are included in “all other” in the<br />
reconciliation of operating profits reported below.<br />
Although the company has five operating segments, only<br />
the <strong>Intel</strong> Architecture Business Group is a reportable segment.<br />
<strong>Intel</strong> had previously shown two reportable segments;<br />
however, as a result of a reorganization during <strong>1999</strong>, no<br />
segment other than the <strong>Intel</strong> Architecture Business Group now<br />
represents 10% or more of revenues or operating profit.<br />
Information for prior periods has been reclassified. <strong>Intel</strong> does<br />
not identify or allocate assets by operating segment, and<br />
does not allocate depreciation as such to the operating<br />
segments, nor does the CEO evaluate groups on these<br />
criteria. Operating segments do not record intersegment<br />
revenues, and, accordingly, there are none to be reported.<br />
<strong>Intel</strong> does not allocate interest and other income, interest<br />
expense or taxes to operating segments. The accounting<br />
policies for segment reporting are the same as for the<br />
company as a whole (see “Accounting policies”), except that<br />
operating segments recognize revenues upon shipment to<br />
distributors, and changes in the reserves for deferred<br />
income on these shipments are recorded at the corporate<br />
level only.<br />
Information on reportable segments for the three years<br />
ended December 25, <strong>1999</strong> is as follows:<br />
(In millions) <strong>1999</strong> 1998 1997<br />
<strong>Intel</strong> Architecture Business Group<br />
Revenues $25,274 $23,853 $22,606<br />
Operating profit $11,356 $ 9,413 $11,132<br />
All other<br />
Revenues $ 4,115 $ 2,420 $ 2,464<br />
Operating loss $ (1,589) $ (1,034) $ (1,245)<br />
Total<br />
Revenues $29,389 $26,273 $25,070<br />
Operating profit $ 9,767 $ 8,379 $ 9,887<br />
In <strong>1999</strong>, two customers each accounted for 13% of the<br />
company’s revenues. In 1998, one customer accounted for 13%<br />
of the company’s revenues and another accounted for 11%.<br />
In 1997, one customer accounted for 12% of the company’s<br />
revenues. A substantial majority of the sales to these customers<br />
were <strong>Intel</strong> Architecture Business Group products.<br />
Geographic revenue information for the three years ended<br />
December 25, <strong>1999</strong> is based on the location of the selling<br />
entity. Property, plant and equipment information is based<br />
on the physical location of the assets at the end of each of<br />
the fiscal years.<br />
Revenues from unaffiliated customers by geographic region<br />
were as follows:<br />
(In millions) <strong>1999</strong> 1998 1997<br />
United States $12,740 $11,663 $11,053<br />
Europe 7,798 7,452 6,774<br />
Asia-Pacific 6,704 5,309 4,754<br />
Japan 2,147 1,849 2,489<br />
Total revenues $29,389 $26,273 $25,070<br />
Net property, plant and equipment by country was as<br />
follows:<br />
(In millions) <strong>1999</strong> 1998<br />
United States $ 8,127 $ 8,076<br />
Ireland 1,312 1,287<br />
Other foreign countries 2,276 2,246<br />
Total property, plant and equipment, net $11,715 $11,609<br />
Supplemental information (unaudited)<br />
Quarterly information for the two years ended December<br />
25, <strong>1999</strong> is presented on page 37.
<strong>Report</strong> of Ernst & Young LLP, independent auditors<br />
29<br />
The Board of Directors and<br />
Stockholders, <strong>Intel</strong> <strong>Corporation</strong><br />
We have audited the accompanying consolidated balance<br />
sheets of <strong>Intel</strong> <strong>Corporation</strong> as of December 25, <strong>1999</strong> and<br />
December 26, 1998, and the related consolidated statements<br />
of income, stockholders’ equity, and cash flows for each of the<br />
three years in the period ended December 25, <strong>1999</strong>. These<br />
financial statements are the responsibility of the company’s<br />
management. Our responsibility is to express an opinion on<br />
these financial statements based on our audits.<br />
We conducted our audits in accordance with auditing<br />
standards generally accepted in the United States. Those<br />
standards require that we plan and perform the audit to obtain<br />
reasonable assurance about whether the financial statements<br />
are free of material misstatement. An audit includes examining,<br />
on a test basis, evidence supporting the amounts and disclosures<br />
in the financial statements. An audit also includes<br />
assessing the accounting principles used and significant<br />
estimates made by management, as well as evaluating the<br />
overall financial statement presentation. We believe that our<br />
audits provide a reasonable basis for our opinion.<br />
In our opinion, the consolidated financial statements<br />
referred to above present fairly, in all material respects,<br />
the consolidated financial position of <strong>Intel</strong> <strong>Corporation</strong><br />
at December 25, <strong>1999</strong> and December 26, 1998, and the<br />
consolidated results of its operations and its cash flows<br />
for each of the three years in the period ended December 25,<br />
<strong>1999</strong>, in conformity with accounting principles generally<br />
accepted in the United States.<br />
San Jose, California<br />
January 11, 2000<br />
I N T E L C O R P O R A T I O N 1 9 9 9
30<br />
Management’s discussion and analysis of financial condition and results of operations<br />
I N T E L C O R P O R A T I O N 1 9 9 9<br />
Results of operations<br />
<strong>Intel</strong> posted record net revenues in <strong>1999</strong>, for the 13th<br />
consecutive year, increasing by 12% from 1998, and by 5%<br />
from 1997 to 1998. Net revenues for the <strong>Intel</strong> Architecture<br />
Business Group operating segment increased by 6% from<br />
1998, and by 5.5% from 1997 to 1998. The increases for<br />
the <strong>Intel</strong> Architecture Business Group for both periods were<br />
primarily due to higher unit volumes of microprocessors,<br />
partially offset by lower average selling prices for microprocessors.<br />
As a result of a change in the company’s internal<br />
organization during <strong>1999</strong>, the <strong>Intel</strong> Architecture Business<br />
Group is the only remaining reportable operating segment.<br />
Within the “all other” category for operating segment reporting,<br />
revenues from sales of flash memory and networking<br />
and communications products grew significantly from 1998<br />
to <strong>1999</strong>. From 1997 to 1998,<br />
sales of flash memory and<br />
embedded products declined<br />
while networking and communications<br />
products grew<br />
29.4 30<br />
significantly.<br />
26.3<br />
During <strong>1999</strong>, sales of microprocessors<br />
and related board-<br />
25.1<br />
level products based on the<br />
20<br />
P6 microarchitecture (including<br />
the <strong>Intel</strong> ® Celeron TM<br />
,<br />
Pentium ® III and Pentium ® III<br />
Net<br />
revenues<br />
Xeon TM<br />
processors), which are<br />
included in the <strong>Intel</strong> Architecture<br />
Business Group’s oper-<br />
10<br />
6.9<br />
7.3<br />
6.1<br />
ations, comprised a substantial<br />
majority of <strong>Intel</strong>’s consol-<br />
Net<br />
income<br />
idated net revenues and gross<br />
0<br />
97 98 99<br />
margin. For 1998, these<br />
represented a majority of Revenues<br />
and income<br />
<strong>Intel</strong>’s consolidated net revenues<br />
and a substantial<br />
(Dollars in billions)<br />
majority of gross margin.<br />
Sales of the P6 microprocessors first became a significant<br />
portion of the company’s revenues and gross margin in<br />
1997. Sales of Pentium ® family processors, including Pentium ®<br />
processors with MMX TM technology, were not significant for<br />
<strong>1999</strong>, but were a rapidly declining but still significant portion<br />
of the company’s revenues and gross margin for 1998.<br />
During 1997, sales of Pentium family processors were a<br />
majority of the company’s revenues and gross margin.<br />
Total cost of sales decreased by 2% from 1998 to <strong>1999</strong>,<br />
primarily due to lower unit costs for microprocessors in <strong>1999</strong><br />
for the <strong>Intel</strong> Architecture Business Group operating segment.<br />
These lower unit costs were partially offset by higher unit<br />
sales volume in <strong>1999</strong>. The lower unit costs in <strong>1999</strong> were<br />
achieved primarily through redesigned microprocessor products<br />
with lower cost packaging, including packaging using<br />
fewer purchased components, as well as factory efficiencies<br />
and lower purchase prices on purchased components. Total<br />
cost of sales increased by 22% from 1997 to 1998, primarily<br />
due to microprocessor unit volume growth and additional<br />
costs associated with purchased components for the Single<br />
Edge Contact (SEC) cartridge housing the Pentium ® II processor.<br />
The total gross margin percentage increased to 60%<br />
in <strong>1999</strong> from 54% in 1998, primarily due to lower unit costs<br />
in the <strong>Intel</strong> Architecture Business Group operating segment,<br />
partially offset by lower average selling prices. The gross margin<br />
percentage decreased to 54% in 1998 from 60% in 1997,<br />
primarily due to the increased costs in the <strong>Intel</strong> Architecture<br />
Business Group related to the SEC cartridge in the Pentium II<br />
processor and the lower average selling prices of processors<br />
in the first half of 1998 compared to the first half of 1997.<br />
See “Outlook” for a discussion of gross margin expectations.<br />
Excluding charges of $392 million for purchased in-process<br />
research and development (IPR&D) related to the current<br />
year’s acquisitions and $165<br />
million in 1998, research and<br />
61<br />
97<br />
68<br />
98<br />
Costs and<br />
expenses<br />
(Percent of revenues)<br />
67<br />
99<br />
Acquisitionrelated<br />
costs<br />
60<br />
Marketing<br />
and G&A<br />
R&D<br />
40<br />
Cost of<br />
sales<br />
20<br />
0<br />
development spending increased<br />
$602 million, or 24%,<br />
from 1998 to <strong>1999</strong>, primarily<br />
due to increased spending<br />
on product development<br />
programs including product<br />
development of acquired<br />
companies. Research and<br />
development spending increased<br />
7% from 1997 to1998,<br />
primarily due to increased<br />
spending on development of<br />
microprocessor products.<br />
Marketing, general and administrative<br />
expenses increased<br />
$796 million, or 26%, from<br />
1998 to <strong>1999</strong>, primarily due<br />
to increases for the <strong>Intel</strong><br />
Inside ® cooperative advertising<br />
program, merchandising<br />
spending relating to new<br />
product launches and profit-dependent bonus expenses.<br />
From 1997 to 1998, marketing, general and administrative<br />
expenses increased $185 million, or 6%, primarily due to<br />
the <strong>Intel</strong> Inside program and merchandising spending,<br />
partially offset by lower profit-dependent bonus expenses.<br />
The fair value of the IPR&D for each of the acquisitions<br />
was determined using the income approach, which discounts<br />
expected future cash flows from projects under development<br />
to their net present value. Each project was analyzed<br />
to determine the technological innovations included; the<br />
utilization of core technology; the complexity, cost and time<br />
to complete the remaining development efforts; any alternative<br />
future use or current technological feasibility; and the<br />
stage of completion. Future cash flows were estimated based<br />
on forecasted revenues and costs, taking into account the<br />
expected life cycles of the products and the underlying technology,<br />
relevant market sizes and industry trends.<br />
Discount rates were derived from a weighted average
Management’s discussion and analysis of financial condition and results of operations<br />
31<br />
cost of capital analysis, adjusted to reflect the relative<br />
risks inherent in each entity’s development process, including<br />
the probability of achieving technological success and<br />
market acceptance. The IPR&D charge includes the fair<br />
value of IPR&D completed. The fair value assigned to developed<br />
technology is included in identifiable intangible assets,<br />
and no value is assigned to IPR&D to be completed or to<br />
future development. <strong>Intel</strong> believes the amounts determined<br />
for IPR&D, as well as developed technology, are representative<br />
of fair value and do not exceed the amounts an<br />
independent party would pay for these projects. Failure to<br />
deliver new products to the market on a timely basis, or<br />
to achieve expected market acceptance or revenue and<br />
expense forecasts, could have a significant impact on the<br />
financial results and operations of the acquired businesses.<br />
The total charge for IPR&D<br />
for the Dialogic <strong>Corporation</strong><br />
acquisition, completed in July<br />
<strong>1999</strong>, was approximately $83<br />
799 792<br />
97<br />
27 34 36<br />
98<br />
Other income<br />
and expense<br />
(Dollars in millions)<br />
1,497<br />
99<br />
1,500<br />
1,000<br />
Interest<br />
income<br />
& other<br />
500<br />
Interest<br />
expense<br />
million. Dialogic designs, manufactures<br />
and markets computer<br />
hardware and software<br />
enabling technology for computer<br />
telephony systems.<br />
Twelve IPR&D projects were<br />
identified and valued, with two<br />
projects under the Springware<br />
and CT Server product groups<br />
accounting for 65% of the<br />
value assigned to IPR&D.<br />
Springware is a line of voice<br />
and intelligent network interface<br />
boards that provides<br />
signal processing features<br />
that can be reconfigured by<br />
developers for special applications.<br />
The next-generation<br />
Springware project was estimated<br />
to be approximately 60% complete, with estimated<br />
costs to complete of $3 million and an estimated completion<br />
date of the first quarter of 2000. The CT Server project is<br />
designed to converge voice, media and packet communications<br />
within enterprise or public networking systems by providing<br />
a single platform for telecommunications switching,<br />
media processing and other communications services. The<br />
CT Server project was estimated to be approximately 55%<br />
complete, with estimated costs to complete of $11.5 million.<br />
The estimated completion date for the CT Server project was<br />
originally the first quarter of 2000 but is now estimated to be<br />
the second quarter of 2000. Dialogic’s other IPR&D projects<br />
ranged from 10% to 90% complete and averaged approximately<br />
60% complete. Total estimated costs to complete<br />
all other projects were $17.5 million, with expected completion<br />
dates from the third quarter of <strong>1999</strong> through the third<br />
quarter of 2000. Projects expected to complete during <strong>1999</strong><br />
completed on schedule. The average discount rates used<br />
were 22% for IPR&D projects and 14% for developed technology.<br />
Dialogic’s weighted average cost of capital was 17%.<br />
The total charge for IPR&D for the Level One Communications,<br />
Inc. acquisition, completed in August <strong>1999</strong>, was<br />
approximately $231 million. Level One Communications provides<br />
silicon connectivity, switching and access solutions for<br />
high-speed telecommunications and networking applications.<br />
Eight IPR&D projects were identified and valued, with each<br />
project representing from 5% to 18% of the total IPR&D<br />
value for this acquisition. Current Level One Communications<br />
products provide silicon connectivity, local area network (LAN)<br />
switching and wide area network (WAN) access solutions for<br />
high-speed telecommunications and networking applications.<br />
In-process projects include transceivers, routers and switch<br />
chipsets using current and emerging technologies for the<br />
networking and telecommunications<br />
markets. These<br />
projects ranged from 39% to<br />
86% complete, with total<br />
2.0<br />
5.3<br />
98<br />
1.8<br />
3.6 3.7<br />
Cash and<br />
investments<br />
(Dollars in billions)<br />
7.7<br />
7.1<br />
99<br />
9<br />
Short-term<br />
investments<br />
6<br />
Marketable<br />
strategic equity<br />
securities<br />
3<br />
Cash & cash<br />
equivalents<br />
0.8 Other<br />
long-term<br />
investments<br />
0<br />
remaining costs to complete<br />
of $19.1 million. Expected<br />
project completion dates<br />
ranged from the third quarter<br />
of <strong>1999</strong> through the third<br />
quarter of 2000, and projects<br />
expected to complete during<br />
<strong>1999</strong> completed on schedule.<br />
The discount rates used were<br />
30% for IPR&D projects and<br />
20% for developed technology.<br />
Level One Communications’<br />
weighted average<br />
cost of capital was 23%.<br />
The total charge for IPR&D<br />
for the DSP Communications,<br />
Inc. acquisition, completed<br />
in November <strong>1999</strong>,<br />
was approximately $59<br />
million. DSP Communications develops and supplies form-fit<br />
reference designs, chipsets and software for mobile telephone<br />
manufacturers. Four IPR&D projects were identified and<br />
valued, with each project representing from 9% to 31% of the<br />
total IPR&D value. The in-process projects are enhancements<br />
of DSP Communications’ existing digital cellular chipsets,<br />
new third-generation chipsets and new products designed for<br />
use in other emerging wireless personal communications services.<br />
These projects ranged from 10% to 90% complete, with<br />
expected project completion dates from 2000 to 2003, and<br />
total remaining costs to complete of $13 million. The average<br />
discount rates used for DSP Communications were 20%<br />
for IPR&D projects and 11% for developed technology. DSP<br />
Communications’ weighted average cost of capital was 17%.<br />
In the first quarter of 1998, the company purchased Chips<br />
and Technologies, Inc. and recorded a charge for IPR&D of<br />
$165 million. Chips and Technologies had a product line of<br />
mobile graphics controllers based on 2D and video graphics<br />
I N T E L C O R P O R A T I O N 1 9 9 9
32<br />
Management’s discussion and analysis of financial condition and results of operations<br />
I N T E L C O R P O R A T I O N 1 9 9 9<br />
technologies. Their major development activities included<br />
new technologies for embedded memory and 3D graphics.<br />
Other development projects included improvements to the<br />
existing 2D and video technologies and several other new<br />
business product lines. The discount rates applied were 15%<br />
for developed technology and 20% for IPR&D projects, compared<br />
to an estimated weighted average cost of capital of<br />
approximately 10%. Costs to complete all of the in-process<br />
projects were estimated to be $30 million. Approximately<br />
70% of the estimated IPR&D was attributable to the embedded<br />
memory technology and the 3D technology that were<br />
expected to be used together and separately in products<br />
under development. Development of the first in a series of<br />
mobile graphics products using the embedded memory<br />
technology was estimated to be approximately 80% complete<br />
and was completed in August 1998. The 3D technology<br />
was at an earlier stage of development with a minimal<br />
amount of work completed at the time of the acquisition.<br />
Close to the time of the acquisition, <strong>Intel</strong> also began working<br />
with another company to license their 3D technology for<br />
a line of desktop graphics controllers. Subsequent to the<br />
acquisition, a decision was made that the mobile and desktop<br />
product lines should have compatible 3D technologies,<br />
and further development of the Chips and Technologies<br />
3D technology was stopped. During <strong>1999</strong>, <strong>Intel</strong> realigned<br />
its discrete graphics resources to focus on integrated<br />
graphics chipsets utilizing the core technology acquired<br />
from Chips and Technologies.<br />
Amortization of goodwill and other acquisition-related<br />
intangibles increased $355 million from 1998 to <strong>1999</strong>, primarily<br />
due to the impact of acquisitions made in <strong>1999</strong>, including<br />
Level One Communications, Dialogic, DSP Communications<br />
and IPivot, Inc. For <strong>1999</strong>, a substantial majority of this amortization<br />
was included in the calculation of the operating loss for<br />
the “all other” category for segment reporting purposes.<br />
Interest expense increased $2 million from 1998 to <strong>1999</strong><br />
due to higher average borrowing balances and lower interest<br />
capitalization. Interest and other income increased $705 million<br />
from 1998 to <strong>1999</strong>, primarily due to higher realized gains on<br />
sales of equity investments. For 1998 compared to 1997, interest<br />
expense increased $7 million due to higher average borrowing<br />
balances and lower interest capitalization. Interest and<br />
other income was essentially unchanged for the same period,<br />
with higher realized gains on sales of equity securities and<br />
higher interest income offset by lower foreign currency gains.<br />
The company’s effective income tax rate was 34.9% in <strong>1999</strong>,<br />
33.6% in 1998 and 34.8% in 1997. Excluding the impact of<br />
the non-deductible charges for IPR&D and the amortization<br />
of goodwill and other acquisition-related intangibles, the company’s<br />
effective income tax rate was approximately 33% for<br />
both <strong>1999</strong> and 1998. Foreign income taxed at rates different<br />
from U.S. rates contributed to the lower tax rate in <strong>1999</strong> and<br />
1998 compared to 1997, excluding the impact of acquisitions.<br />
Financial condition<br />
The company’s financial condition remains very strong.<br />
At December 25, <strong>1999</strong>, total cash, trading assets and shortand<br />
long-term investments, excluding marketable strategic<br />
equity securities, totaled $13 billion, up from $11 billion at<br />
December 26, 1998. Cash provided by operating activities<br />
was $11 billion in <strong>1999</strong>, compared to $9.2 billion and $10<br />
billion in 1998 and 1997, respectively.<br />
The company used $5.5 billion in net cash for investing<br />
activities during <strong>1999</strong>, compared to $6.5 billion during 1998<br />
and $6.9 billion during 1997. Capital expenditures totaled<br />
$3.4 billion in <strong>1999</strong>, as the company continued to invest in<br />
property, plant and equipment, primarily for additional microprocessor<br />
manufacturing capacity and the transition of<br />
manufacturing technology. The company also paid $3 billion<br />
in cash for acquisitions, net of cash acquired, including the<br />
purchases of Shiva <strong>Corporation</strong>, Softcom Microsystems, Inc.,<br />
Dialogic, NetBoost <strong>Corporation</strong>, IPivot and DSP Communications.<br />
In addition, the company issued approximately 34<br />
million shares of common stock and assumed convertible debt<br />
valued at approximately $212 million in connection with the<br />
purchase of Level One Communications. Sales of availablefor-sale<br />
investments provided $831 million in cash. The company<br />
also had committed approximately $2.5 billion for the<br />
purchase or construction of property, plant and equipment<br />
as of December 25, <strong>1999</strong>. See “Outlook” for a discussion of<br />
capital expenditure expectations in 2000.<br />
Inventory levels in total decreased in <strong>1999</strong>, with raw materials,<br />
work-in-process and finished goods inventory all contributing<br />
to the decrease. For <strong>1999</strong>, the impact of the increase<br />
in revenues on the accounts receivable balance was offset<br />
by a decrease in the days sales outstanding. The company’s<br />
five largest customers accounted for approximately 44%<br />
of net revenues for <strong>1999</strong>. Two customers each accounted<br />
for 13% of revenues in <strong>1999</strong>. One customer accounted for<br />
13% of revenues and another accounted for 11% in 1998,<br />
and one customer accounted for 12% of revenues in 1997.<br />
At December 25, <strong>1999</strong>, the five largest customers accounted<br />
for approximately 35% of net accounts receivable.<br />
The company used $4.2 billion for financing activities in<br />
<strong>1999</strong>, compared to $4.7 billion and $3.2 billion in 1998 and<br />
1997, respectively. The major financing applications of cash<br />
in <strong>1999</strong> were for the repurchase of 71.3 million shares of<br />
common stock for $4.6 billion and payment of dividends of<br />
$366 million. The major financing applications of cash in<br />
1998 and 1997 were for stock repurchases totaling $6.8<br />
billion and $3.4 billion, respectively; payments of dividends<br />
of $217 million and $180 million, respectively; and for 1997,<br />
a $300 million repayment under a private reverse repurchase<br />
arrangement. Financing sources of cash during <strong>1999</strong> were<br />
primarily $543 million in proceeds from the sale of shares<br />
mainly pursuant to employee stock plans ($507 million in<br />
1998 and $317 million in 1997). Financing sources of cash<br />
during 1998 also included $1.6 billion in proceeds from the<br />
exercise of the 1998 step-up warrants ($40 million in 1997).<br />
As part of its authorized stock repurchase program, the<br />
company had outstanding put warrants at the end of <strong>1999</strong>,<br />
with the potential obligation to buy back 2 million shares of its<br />
common stock at an aggregate price of $130 million. Subsequent<br />
to the year-end, these put warrants expired unexercised.
Management’s discussion and analysis of financial condition and results of operations<br />
33<br />
At December 25, <strong>1999</strong>, marketable strategic equity securities<br />
totaled $7.1 billion with approximately $5.8 billion in<br />
unrealized appreciation, an increase in total value of $5.3<br />
billion compared to December 26, 1998 and an increase<br />
in unrealized appreciation of approximately $4.9 billion.<br />
Other sources of liquidity include authorized commercial<br />
paper borrowings of $700 million. The company also maintains<br />
the ability to issue an aggregate of approximately $1.4<br />
billion in debt, equity and other securities under Securities<br />
and Exchange Commission shelf registration statements.<br />
The company believes that it has the financial resources<br />
needed to meet business requirements for the next 12 months,<br />
including potential future acquisitions or strategic investments,<br />
capital expenditures for the expansion or upgrading<br />
of worldwide manufacturing capacity, working capital requirements<br />
and the dividend program.<br />
Financial market risks<br />
The company is exposed to financial market risks, including<br />
changes in interest rates, foreign currency exchange rates<br />
and marketable equity security prices. To mitigate these<br />
risks, the company utilizes derivative financial instruments.<br />
The company does not use derivative financial instruments<br />
for speculative or trading purposes. All of the potential<br />
changes noted below are based on sensitivity analyses performed<br />
on the company’s financial positions at December<br />
25, <strong>1999</strong>. Actual results may differ materially.<br />
The primary objective of the company’s investments in debt<br />
securities is to preserve principal while maximizing yields,<br />
without significantly increasing risk. To achieve this objective,<br />
the returns on a substantial majority of the company’s marketable<br />
investments in long-term fixed rate debt securities are<br />
swapped to U.S. dollar LIBOR-based returns. The company<br />
considered the historical volatility of the three-month LIBOR<br />
rate experienced in the past year and determined that it<br />
was reasonably possible that an adverse change of 60 basis<br />
points, approximately 10% of the rate at the end of <strong>1999</strong>,<br />
could be experienced in the near term. A hypothetical 60-<br />
basis-point increase in interest rates would result in an<br />
approximate $16 million decrease in the fair value of the<br />
company’s investments in debt securities as of the end<br />
of <strong>1999</strong> ($30 million as of the end of 1998).<br />
The company hedges currency risks of investments<br />
denominated in foreign currencies with foreign currency<br />
borrowings, currency forward contracts and currency interest<br />
rate swaps. Gains and losses on these foreign currency<br />
investments would generally be offset by corresponding<br />
losses and gains on the related hedging instruments, resulting<br />
in negligible net exposure to the company.<br />
A substantial majority of the company’s revenue, expense<br />
and capital purchasing activities are transacted in U.S. dollars.<br />
However, the company does enter into these transactions<br />
in other currencies, primarily Japanese yen and certain other<br />
Asian and European currencies. To protect against reductions<br />
in value and the volatility of future cash flows caused<br />
by changes in currency exchange rates, the company has<br />
established revenue, expense and balance sheet hedging<br />
programs. Currency forward contracts and currency options<br />
are utilized in these hedging programs. The company’s<br />
hedging programs reduce, but do not always entirely eliminate,<br />
the impact of currency exchange rate movements.<br />
The company considered the historical trends in currency<br />
exchange rates and determined that it was reasonably possible<br />
that adverse changes in exchange rates of 20% for<br />
certain Asian currencies and 10% for all other currencies<br />
could be experienced in the near term. Such an adverse<br />
change would result in an adverse impact on income before<br />
taxes of less than $20 million as of the end of each of<br />
<strong>1999</strong> and 1998.<br />
The company is exposed to equity price risks on the<br />
marketable portion of its portfolio of strategic equity securities.<br />
The company typically does not attempt to reduce or<br />
eliminate its market exposure on these securities. These<br />
investments are generally in companies in the high-technology<br />
industry, and a substantial majority of the market value<br />
of the portfolio is in three sectors: Internet, semiconductor<br />
and networking. As of December 25, <strong>1999</strong>, five equity positions<br />
constituted approximately 49% of the market value<br />
of the portfolio, of which approximately $1.2 billion, or 17%<br />
of the market value of the portfolio, consisted of an investment<br />
in Micron Technology, Inc.<br />
The company analyzed the historical movements over<br />
the past several years of high-technology stock indices that<br />
the company considered appropriate. Based on the analysis,<br />
the company estimated that it was reasonably possible<br />
that the prices of the stocks in the company’s portfolio<br />
could experience a 30% adverse change in the near term.<br />
Assuming a 30% adverse change, the company’s marketable<br />
strategic equity securities would decrease in value by<br />
approximately $2.1 billion, based on the value of the portfolio<br />
as of December 25, <strong>1999</strong>. Assuming the same 30% adverse<br />
change as of December 26, 1998, the company’s marketable<br />
strategic equity securities would have decreased in value by<br />
approximately $525 million. The increase in the impact of the<br />
assumed adverse change from 1998 to <strong>1999</strong> reflects the<br />
increase in size of the portfolio, a significant portion of which<br />
represents unrealized appreciation. The portfolio’s concentrations<br />
in specific companies or sectors may vary over time<br />
and may be different from the compositions of the indices<br />
analyzed, and these factors may affect the portfolio’s price<br />
volatility. This estimate is not necessarily indicative of future<br />
performance, and actual results may differ materially.<br />
Outlook<br />
This outlook section contains a number of forward-looking<br />
statements, all of which are based on current expectations.<br />
Actual results may differ materially. These statements do not<br />
reflect the potential impact of any mergers or acquisitions<br />
that had not closed as of the end of <strong>1999</strong>.<br />
<strong>Intel</strong>’s goal is to be the preeminent building block supplier to<br />
the worldwide Internet economy. The company’s primary focus<br />
areas are the client platform, server platform, networking and<br />
communications, and solutions and services. The company’s<br />
five product-line operating segments support these initiatives.<br />
I N T E L C O R P O R A T I O N 1 9 9 9
34<br />
Management’s discussion and analysis of financial condition and results of operations<br />
I N T E L C O R P O R A T I O N 1 9 9 9<br />
<strong>Intel</strong>’s strategy for client and server platforms is to introduce<br />
ever higher performance microprocessors and chipsets,<br />
tailored for the different market segments of the worldwide<br />
computing market, using a tiered branding approach. In<br />
line with this strategy, the company is seeking to develop<br />
higher performance microprocessors based on the P6 microarchitecture<br />
specifically for each computing segment: the<br />
<strong>Intel</strong> Celeron processor for the value segment; Pentium III<br />
processors for home and business applications, and for entrylevel<br />
servers and workstations; and Pentium III Xeon processors<br />
for mid-range and high-end servers and workstations.<br />
During 2000, the company also expects to introduce processors<br />
for high-end servers based on the IA-64 architecture,<br />
under the Itanium TM brand. In addition, the client platform<br />
strategy includes providing low-power processors and flash<br />
memory for handheld wireless devices. The <strong>Intel</strong> Architecture<br />
Business Group operating segment supports the client<br />
and server platform initiatives. The Wireless Communications<br />
and Computing Group supports the handheld wireless<br />
device initiatives for the client platform.<br />
<strong>Intel</strong> plans to cultivate new businesses as well as continue<br />
to work with the computing industry to expand Internet<br />
capabilities and product offerings, and develop compelling<br />
software applications that can take advantage of higher<br />
performance microprocessors and chipsets, thus driving<br />
demand toward <strong>Intel</strong>’s newer products in each computing<br />
market segment. The company may continue to take various<br />
steps, including reducing microprocessor prices at<br />
such times as it deems appropriate, in order to increase<br />
acceptance of its latest technology and to remain competitive<br />
within each relevant market segment.<br />
In the network and communications infrastructure area,<br />
<strong>Intel</strong>’s strategy is to deliver both system-level communications<br />
products and component-level silicon building blocks<br />
for networking and communications systems for the home<br />
and small- and medium-sized businesses. <strong>Intel</strong> has made<br />
acquisitions and expects to make additional acquisitions to<br />
grow new networking and communications areas. Initiatives<br />
in these areas are supported by the Communications<br />
Products Group operating segment, focusing on systemlevel<br />
products, and the Network Communications Group,<br />
focusing on component-level products.<br />
<strong>Intel</strong> also intends to build new service businesses around<br />
the Internet. During <strong>1999</strong>, the company launched <strong>Intel</strong> Online<br />
Services, which provides Web hosting and e-Commerce<br />
services for customers. <strong>Intel</strong> intends to deliver a consistent<br />
worldwide platform for developing and delivering e-Business<br />
solutions. The New Business Group operating segment supports<br />
the service business initiatives.<br />
<strong>Intel</strong> expects that the total number of computers using<br />
<strong>Intel</strong>’s P6 microarchitecture processors and other semiconductor<br />
components sold worldwide will continue to grow<br />
in 2000. In addition, <strong>Intel</strong> expects to grow revenues in the<br />
networking, communications and wireless businesses by 50%<br />
or more in 2000. However, the company’s financial results<br />
are substantially dependent on sales of microprocessors<br />
and related components by the <strong>Intel</strong> Architecture Business<br />
Group. Revenues are also a function of the mix of microprocessor<br />
types and speeds sold as well as the mix of<br />
related motherboards, purchased components and other<br />
semiconductor products, all of which are difficult to forecast.<br />
Because of the wide price difference among types of microprocessors,<br />
this mix affects the average price that <strong>Intel</strong> will<br />
realize and has a large impact on <strong>Intel</strong>’s revenues. The<br />
company’s expectations regarding growth in the computing<br />
industry worldwide are dependent in part on the growth in<br />
usage of the Internet and the expansion of Internet product<br />
offerings. The expectations are also subject to the impact<br />
of economic conditions in various geographic regions.<br />
<strong>Intel</strong>’s expectations regarding growth in the networking,<br />
communications and wireless areas, as well as in new<br />
service businesses, are subject to the company’s ability to<br />
acquire businesses as well as to integrate and operate<br />
them successfully, and to grow new businesses internally.<br />
<strong>Intel</strong>’s current gross margin expectation for 2000 is 61%<br />
plus or minus a few points compared to 60% for <strong>1999</strong>. The<br />
company’s gross margin varies depending on the mix of<br />
types and speeds of processors sold as well as the mix of<br />
microprocessors and related motherboards and purchased<br />
components. The company has been implementing new<br />
packaging formats that have reduced costs on certain microprocessor<br />
products, and this is expected to be the primary<br />
driver of cost reductions for 2000 as the transition to the<br />
new packaging formats continues. The company also expects<br />
to have reduced costs due to continued productivity improvements<br />
on its existing manufacturing processes, including<br />
the new 0.18-micron manufacturing process. Various other<br />
factors—including unit volumes, yield issues associated with<br />
production at factories, ramp of new technologies, the<br />
reusability of factory equipment, excess or obsolete inventory,<br />
variations in inventory valuation and mix of shipments of<br />
other semiconductor and non-semiconductor products—<br />
will also continue to affect the amount of cost of sales and<br />
the variability of gross margin percentages.<br />
<strong>Intel</strong>’s primary goal is to get its advanced technology to<br />
the marketplace, and at the same time increase gross<br />
margin dollars. The company’s plans to grow in non-microprocessor<br />
areas, particularly those areas that have the<br />
potential to expand networking and communications capabilities,<br />
are intended to increase gross margin dollars but<br />
may lower the gross margin percentage. In addition, from<br />
time to time the company may forecast a range of gross<br />
margin percentages for the coming quarter. Actual results<br />
may differ from these estimates.<br />
The company has expanded its semiconductor manufacturing<br />
and assembly and test capacity over the last few years,<br />
and continues to plan capacity based on the assumed continued<br />
success of its strategy as well as the acceptance of<br />
its products in specific market segments. The company<br />
expects that capital spending will increase to approximately<br />
$5 billion in 2000 from $3.4 billion in <strong>1999</strong>. The increase<br />
is primarily a result of expected spending related to the
Management’s discussion and analysis of financial condition and results of operations<br />
35<br />
development of next-generation 0.13-micron process technology<br />
for both 300 millimeter and 200 millimeter manufacturing,<br />
in addition to increased spending on new fabrication facility<br />
construction and equipment purchases to add 0.18-micron<br />
capacity. If the market demand does not continue to grow and<br />
move rapidly toward higher performance products in the<br />
various market segments, revenues and gross margin may<br />
be affected, the capacity installed might be under-utilized<br />
and capital spending may be slowed. Revenues and gross<br />
margin may also be affected if the company does not add<br />
capacity fast enough to meet market demand. This spending<br />
plan is dependent upon expectations regarding production<br />
efficiencies and delivery times of various machinery and<br />
equipment, and construction schedules for new facilities.<br />
Depreciation for 2000 is expected to be approximately $3.4<br />
billion, an increase of approximately $200 million from <strong>1999</strong>.<br />
Most of this increase would be included in cost of sales and<br />
research and development spending. Amortization of goodwill<br />
and other acquisition-related intangibles is expected to be<br />
approximately $1.2 billion for 2000.<br />
The industry in which <strong>Intel</strong> operates is characterized by<br />
very short product life cycles, and the company’s continued<br />
success is dependent on technological advances, including<br />
the development and implementation of new processes<br />
and new strategic products for specific market segments.<br />
Because <strong>Intel</strong> considers it imperative to maintain a strong<br />
research and development program, spending for research<br />
and development in 2000, excluding in-process research<br />
and development, is expected to increase to approximately<br />
$3.8 billion from $3.1 billion in <strong>1999</strong>. The higher spending is<br />
driven primarily by the full-year impact of acquisitions and<br />
investments in new businesses as well as increased investment<br />
in <strong>Intel</strong> architecture-related businesses. The company<br />
intends to continue spending to promote its products and to<br />
increase the value of its product brands. Based on current<br />
forecasts, spending for marketing, general and administrative<br />
expenses is also expected to increase in 2000.<br />
The company currently expects its tax rate to be 31.7% for<br />
2000, excluding the impact of costs related to prior and any<br />
future acquisitions.This estimate is based on current tax law, the<br />
current estimate of earnings and the expected distribution of<br />
income among various tax jurisdictions, and is subject to change.<br />
During 1998, <strong>Intel</strong> established a team to address the issues<br />
raised by the introduction of the Single European Currency,<br />
the Euro, on January 1, <strong>1999</strong>. The team is continuing to<br />
work on the conversion issues during the transition period<br />
through January 1, 2002. <strong>Intel</strong>’s internal systems that were<br />
affected by the initial introduction of the Euro were made<br />
Euro capable without material system modification costs.<br />
Further internal systems changes are being made during the<br />
three-year transition phase in preparation for the ending of<br />
bilateral rates in January 2002 and the ultimate withdrawal<br />
of the legacy currencies in July 2002. The costs of these<br />
changes are not expected to be material. The introduction of<br />
the Euro has not materially affected the company’s foreign<br />
exchange and hedging activities, or the company’s use of<br />
derivative instruments, and is not expected to result in any<br />
material increase in costs to the company. While <strong>Intel</strong> will<br />
continue to evaluate the impact of the ongoing Euro conversion<br />
over time, based on currently available information,<br />
management does not believe that the Euro conversion will<br />
have a material adverse impact on the company’s financial<br />
condition or overall trends in results of operations.<br />
<strong>Intel</strong> established a comprehensive program to deal with<br />
issues related to the year 2000 computer programming problem.<br />
By the end of <strong>1999</strong>, all of the company’s internal systems<br />
categorized as critical, priority or important were determined<br />
to be year 2000 capable. To date, there have been no material<br />
problems caused by year 2000 issues related to the company’s<br />
internal systems or non-performance of suppliers.<br />
<strong>Intel</strong> also established a program to assess the year 2000<br />
capability of its products. The definition of “Year 2000 Capable”<br />
is available on <strong>Intel</strong>’s Web site. To assist customers in evaluating<br />
their year 2000 issues, the company developed a<br />
Web-enabled database indicating the capability of <strong>Intel</strong>’s<br />
current branded products and certain branded products no<br />
longer being produced. The capabilities of certain non-<strong>Intel</strong><br />
branded products of certain subsidiaries are posted on the<br />
Web sites of those entities.<br />
All <strong>Intel</strong> processors and microcontrollers (embedded processors)<br />
are Year 2000 Capable, with the exception of two<br />
custom microcontroller products sold to a limited number<br />
of customers. However, the ability of a complete system to<br />
operate correctly depends on firmware (BIOS) capability<br />
and software design and integration, which for many end<br />
users includes firmware and software provided by companies<br />
other than <strong>Intel</strong>.<br />
Except as specifically provided in the limited warranties<br />
offered on certain of its current and some discontinued<br />
products, the company does not believe it is legally responsible<br />
for costs incurred by customers to ensure their year<br />
2000 capability. Nevertheless, the company has incurred<br />
various costs to provide customer support and customer<br />
satisfaction services regarding year 2000 issues.<br />
The company currently expects that the total cost of<br />
these programs will be approximately $100 million. Approximately<br />
$96 million has been spent on the programs to date,<br />
of which approximately $54 million was incurred in <strong>1999</strong>.<br />
Costs include estimated payroll costs for redeployed personnel<br />
and the costs of consultants, software and hardware<br />
upgrades, and dedicated program offices.<br />
No significant internal systems projects were deferred due<br />
to year 2000 program efforts. The installation schedule of<br />
certain new software and hardware was accelerated to solve<br />
year 2000 capability issues, for which related costs were<br />
estimated to be an additional amount of approximately $15<br />
million. These estimated costs do not include any potential<br />
costs related to customer or other claims.<br />
Based on currently available information, management<br />
does not believe that the year 2000 matters discussed<br />
above will have a material adverse impact on the company’s<br />
financial condition or overall trends in results of operations.<br />
I N T E L C O R P O R A T I O N 1 9 9 9
36<br />
Management’s discussion and analysis of financial condition and results of operations<br />
I N T E L C O R P O R A T I O N 1 9 9 9<br />
The company is currently party to various legal proceedings.<br />
Although litigation is subject to inherent uncertainties,<br />
management, including internal counsel, does not believe<br />
that the ultimate outcome of these legal proceedings will<br />
have a material adverse effect on the company’s financial<br />
position or overall trends in results of operations. However,<br />
were an unfavorable ruling to occur in any specific period,<br />
there exists the possibility of a material adverse impact<br />
on the results of operations of that period. Management<br />
believes, given the company’s current liquidity and cash<br />
and investment balances, that even an adverse judgment<br />
would not have a material impact on cash and investments<br />
or liquidity.<br />
The company’s future results of operations and the other<br />
forward-looking statements contained in this outlook—in<br />
particular the statements regarding expected product introductions,<br />
expectations regarding additional acquisitions,<br />
intentions regarding building new service businesses around<br />
the Internet, the number of computers using <strong>Intel</strong> processors,<br />
gross margin and cost savings, capital spending, depreciation<br />
and amortization, research and development, marketing and<br />
general and administrative expenses, the tax rate, the conversion<br />
to the Euro, the year 2000 issue and pending legal<br />
proceedings—involve a number of risks and uncertainties.<br />
In addition to the factors discussed above, among the other<br />
factors that could cause actual results to differ materially are<br />
the following: changes in end user demand due to usage of<br />
the Internet; changes in customer order patterns; competitive<br />
factors such as rival chip architectures and manufacturing<br />
technologies, competing software-compatible microprocessors<br />
and acceptance of new products in specific market<br />
segments; pricing pressures; development and timing of the<br />
introduction of compelling software applications; execution<br />
of the manufacturing ramp, including the transition to the<br />
0.18-micron process technology; the ability to grow new<br />
networking, communications, wireless and other Internetrelated<br />
businesses and successfully integrate and operate<br />
any acquired businesses; unanticipated costs or other adverse<br />
effects associated with processors and other products<br />
containing errata (deviations from published specifications);<br />
impact on the company’s business by year 2000 problems<br />
and claims; and litigation involving antitrust, intellectual<br />
property, consumer and other issues.<br />
<strong>Intel</strong> believes that it has the product offerings, facilities, personnel,<br />
and competitive and financial resources for continued<br />
business success, but future revenues, costs, margins and<br />
profits are all influenced by a number of factors, including those<br />
discussed above, all of which are inherently difficult to forecast.
Financial information by quarter (unaudited)<br />
37<br />
(In millions—except per share amounts)<br />
<strong>1999</strong> for quarter ended December 25 September 25 June 26 March 27<br />
Net revenues............................................................................................................................ $ 8,212 $ 7,328 $ 6,746 $ 7,103<br />
Cost of sales ............................................................................................................................ $ 3,176 $ 3,026 $ 2,740 $ 2,894<br />
Net income A .............................................................................................................................. $ 2,108 $ 1,458 $ 1,749 $ 1,999<br />
Basic earnings per share ........................................................................................... $ .63 $ .44 $ .53 $ .60<br />
Diluted earnings per share ....................................................................................... $ .61 $ .42 $ .51 $ .57<br />
Dividends per share B Declared ................................................................. $ — $ .060 $ — $ .050<br />
Paid ............................................................................. $ .030 $ .030 $ .030 $ .020<br />
Market price range common stock C High ............................ $ 83.13 $ 89.31 $ 66.06 $ 70.47<br />
Low ............................. $ 65.13 $ 57.00 $ 50.50 $ 54.91<br />
I N T E L C O R P O R A T I O N 1 9 9 9<br />
(In millions—except per share amounts)<br />
1998 for quarter ended December 26 September 26 June 27 March 28<br />
Net revenues............................................................................................................................ $ 7,614 $ 6,731 $ 5,927 $ 6,001<br />
Cost of sales D ......................................................................................................................... $ 3,160 $ 3,176 $ 3,012 $ 2,740<br />
Net income A .............................................................................................................................. $ 2,064 $ 1,559 $ 1,172 $ 1,273<br />
Basic earnings per share ........................................................................................... $ .62 $ .46 $ .35 $ .39<br />
Diluted earnings per share ....................................................................................... $ .59 $ .44 $ .33 $ .36<br />
Dividends per share B Declared ................................................................. $ — $ .035 $ — $ .015<br />
Paid ............................................................................. $ .020 $ .015 $ .015 $ .015<br />
Market price range common stock C High ............................ $ 62.50 $ 45.72 $ 42.41 $ 47.09<br />
Low ............................. $ 39.22 $ 35.59 $ 32.97 $ 35.13<br />
Market price range step-up warrants C High ............................ $ — $ — $ — $ 36.56<br />
Low ............................. $ — $ — $ — $ 24.73<br />
ANet income for the third and fourth quarters of <strong>1999</strong> reflects charges of $333 million and $59 million, respectively, for purchased in-process research and development<br />
related to acquisitions. Net income for the first quarter of 1998 reflects a similar charge of $165 million.<br />
BAs of the second quarter of 1998, the company had adopted a new dividend declaration schedule which results in the Board of Directors considering two dividend<br />
declarations in the first and third quarters of the year and no declarations in the second and fourth quarters. A dividend was paid in each quarter of <strong>1999</strong> and 1998.<br />
C<strong>Intel</strong>’s common stock (symbol INTC) trades on The Nasdaq Stock Market* and is quoted in the Wall Street Journal and other newspapers. <strong>Intel</strong>’s 1998 step-up<br />
warrants traded on The Nasdaq Stock Market prior to their March 1998 expiration. <strong>Intel</strong>’s common stock also trades on The Swiss Exchange. At December 25,<br />
<strong>1999</strong>, there were approximately 238,000 registered holders of common stock. All stock and warrant prices are closing prices per The Nasdaq Stock Market, as<br />
adjusted for stock splits.<br />
DCost<br />
of sales for 1998 reflects the reclassification of amortization of goodwill and other acquisition-related intangibles to a separate line item.
38 Corporate directory<br />
I N T E L C O R P O R A T I O N 1 9 9 9<br />
Board of directors<br />
Gordon E. Moore 4† 5†<br />
Chairman Emeritus<br />
of the Board<br />
Andrew S. Grove 4<br />
Chairman of the Board<br />
Craig R. Barrett 4<br />
President and<br />
Chief Executive Officer<br />
John P. Browne 1 2<br />
Group Chief Executive<br />
BP Amoco p.l.c.<br />
An integrated oil company<br />
Winston H. Chen 1† 2<br />
Chairman<br />
Paramitas Foundation<br />
A private foundation<br />
D. James Guzy 1 3 6†<br />
Chairman<br />
Arbor Company<br />
A limited partnership<br />
David S. Pottruck 1 2 5<br />
President and<br />
Co-Chief Executive Officer<br />
The Charles Schwab<br />
<strong>Corporation</strong><br />
A securities brokerage firm<br />
Jane E. Shaw 2† 3 6<br />
Chairman and<br />
Chief Executive Officer<br />
AeroGen, Inc.<br />
A private company<br />
Leslie L. Vadasz<br />
Executive Vice President<br />
President,<br />
<strong>Intel</strong> Capital<br />
David B. Yoffie 3† 4 5 6 7<br />
Max and Doris Starr<br />
Professor of International<br />
Business Administration<br />
Harvard Business School<br />
Charles E. Young 3 5 6<br />
Chancellor Emeritus<br />
University of California<br />
at Los Angeles and<br />
Interim President<br />
University of Florida<br />
1 Member of Audit<br />
Committee<br />
2 Member of Compensation<br />
Committee<br />
3 Member of Corporate<br />
Governance Committee<br />
4 Member of Executive<br />
Committee<br />
5 Member of Finance<br />
Committee<br />
6 Member of Nominating<br />
Committee<br />
7 Lead Independent<br />
Director<br />
† Committee Chairman<br />
Directors emeriti<br />
Max Palevsky<br />
Industrialist<br />
Arthur Rock<br />
Venture capitalist<br />
Corporate officers<br />
Gordon E. Moore<br />
Chairman Emeritus<br />
of the Board<br />
Andrew S. Grove<br />
Chairman of the Board<br />
Craig R. Barrett<br />
President and<br />
Chief Executive Officer<br />
Paul S. Otellini<br />
Executive Vice President<br />
General Manager,<br />
<strong>Intel</strong> Architecture<br />
Business Group<br />
Gerhard H. Parker<br />
Executive Vice President<br />
General Manager,<br />
New Business Group<br />
Leslie L. Vadasz<br />
Executive Vice President<br />
President,<br />
<strong>Intel</strong> Capital<br />
Andy D. Bryant<br />
Senior Vice President<br />
Chief Financial and<br />
Enterprise Services Officer<br />
Sean M. Maloney<br />
Senior Vice President<br />
Director,<br />
Sales and Marketing Group<br />
Michael R. Splinter<br />
Senior Vice President<br />
General Manager,<br />
Technology and<br />
Manufacturing Group<br />
Ronald J. Whittier<br />
Senior Vice President<br />
General Manager,<br />
<strong>Intel</strong> Content Services<br />
Albert Y. C. Yu<br />
Senior Vice President<br />
General Manager,<br />
Microprocessor<br />
Products Group<br />
Michael A. Aymar<br />
Vice President;<br />
President,<br />
<strong>Intel</strong> Online Services, Inc.<br />
Robert J. Baker<br />
Vice President<br />
General Manager,<br />
Fab/Sort Manufacturing<br />
Louis J. Burns<br />
Vice President<br />
General Manager,<br />
Platform Components Group<br />
Dennis L. Carter<br />
Vice President<br />
Director,<br />
Strategic Marketing<br />
Sunlin Chou<br />
Vice President<br />
General Manager,<br />
Technology and<br />
Manufacturing Group<br />
Mark A. Christensen<br />
Vice President<br />
General Manager,<br />
Network Communications<br />
Group<br />
Jami K. Dover<br />
Vice President<br />
Director,<br />
Worldwide Marketing<br />
Operations<br />
F. Thomas Dunlap, Jr.<br />
Vice President<br />
General Counsel and Secretary<br />
Kirby A. Dyess<br />
Vice President<br />
Director,<br />
New Business Development<br />
Michael J. Fister<br />
Vice President<br />
General Manager,<br />
Enterprise Server Group<br />
Thomas R. Franz<br />
Vice President<br />
General Manager,<br />
Network Processing Group<br />
Patrick P. Gelsinger<br />
Vice President<br />
General Manager,<br />
Desktop Products Group<br />
Hans G. Geyer<br />
Vice President<br />
General Manager,<br />
Cellular Communications<br />
Division<br />
D. Craig Kinnie<br />
Vice President<br />
Director,<br />
<strong>Intel</strong> Architecture Labs<br />
John H. F. Miner<br />
Vice President<br />
General Manager,<br />
Communications<br />
Products Group<br />
Patricia Murray<br />
Vice President<br />
Director,<br />
Human Resources<br />
Stephen P. Nachtsheim<br />
Vice President<br />
Director of Operations,<br />
<strong>Intel</strong> Capital<br />
Ronald J. Smith<br />
Vice President<br />
General Manager,<br />
Wireless Communications<br />
and Computing Group<br />
Stephen L. Smith<br />
Vice President<br />
General Manager,<br />
IA-64 Processor Division<br />
Arvind Sodhani<br />
Vice President<br />
Treasurer<br />
Appointed officers<br />
Frank Alvarez<br />
Vice President<br />
Technology and<br />
Manufacturing Group<br />
General Manager,<br />
Systems Manufacturing<br />
Shmuel Arditi<br />
Vice President<br />
Wireless Communications<br />
and Computing Group<br />
General Manager,<br />
Cellular Communications<br />
Division<br />
Alan C. Baldwin<br />
Vice President<br />
New Business Group<br />
General Manager,<br />
International Internet Services<br />
John Breslin<br />
Vice President<br />
Sales and Marketing Group<br />
General Manager,<br />
Asia-Pacific Operations<br />
Howard G. Bubb<br />
Vice President<br />
Communications<br />
Products Group;<br />
President,<br />
Dialogic <strong>Corporation</strong><br />
Ling I. Bundgaard<br />
Vice President<br />
Technology and<br />
Manufacturing Group<br />
Site Manager,<br />
Philippine Operations<br />
Douglas F. Busch<br />
Vice President<br />
Information Technology<br />
Director,<br />
Information Technology<br />
Anand Chandrasekher<br />
Vice President<br />
<strong>Intel</strong> Architecture<br />
Business Group<br />
General Manager,<br />
Workstation Products Group<br />
Jason Chun Shen Chen<br />
Vice President<br />
Sales and Marketing Group<br />
General Manager,<br />
Asia-Pacific Operations<br />
David M. Cowan<br />
Vice President<br />
Microprocessor<br />
Products Group<br />
General Manager,<br />
Server and Workstation<br />
Chipset Division<br />
Leslie S. Culbertson<br />
Vice President<br />
Technology and<br />
Manufacturing Group<br />
Director,<br />
Materials<br />
John E. Davies<br />
Vice President<br />
<strong>Intel</strong> Architecture<br />
Business Group<br />
Director,<br />
e-Business Marketing<br />
Richard A. DeLateur<br />
Vice President<br />
<strong>Intel</strong> Capital<br />
Director,<br />
International<br />
Nobuyuki Denda<br />
Vice President<br />
Sales and Marketing Group;<br />
President,<br />
<strong>Intel</strong> K.K. (Japan)<br />
Peter N. Detkin<br />
Vice President<br />
Legal<br />
Assistant General Counsel<br />
Robert L. Eckelmann<br />
Vice President<br />
Sales and Marketing Group<br />
General Manager,<br />
Europe, Middle East,<br />
Africa Operations<br />
Edward D. Ekstrom<br />
Vice President<br />
Communications<br />
Products Group<br />
General Manager,<br />
Systems Management Division<br />
Carlene M. Ellis<br />
Vice President<br />
Human Resources<br />
Director,<br />
Education<br />
Youssef A. El-Mansy<br />
Vice President<br />
Technology and<br />
Manufacturing Group<br />
Director,<br />
Logic Technology Development<br />
Dov Frohman<br />
Vice President<br />
Microprocessor<br />
Products Group<br />
General Manager,<br />
Israel Operations<br />
Jai K. Hakhu<br />
Vice President<br />
Technology and<br />
Manufacturing Group<br />
General Manager,<br />
Technology Manufacturing<br />
Engineering<br />
Brian L. Harrison<br />
Vice President<br />
Technology and<br />
Manufacturing Group<br />
General Manager,<br />
Assembly Test Manufacturing<br />
William M. Holt<br />
Vice President<br />
Technology and<br />
Manufacturing Group<br />
Director,<br />
Advanced Technology<br />
Planning and Development<br />
James W. Jarrett<br />
President<br />
<strong>Intel</strong> PRC <strong>Corporation</strong><br />
Robert M. Jecmen<br />
Vice President<br />
<strong>Intel</strong> Architecture<br />
Business Group<br />
General Manager,<br />
Mobile Computing Group<br />
James B. Johnson<br />
Vice President<br />
Technology and<br />
Manufacturing Group<br />
Oregon Site Manager<br />
John L. Kehoe<br />
Vice President<br />
Network Communications<br />
Group<br />
General Manager,<br />
Level One Communications
Corporate directory<br />
39<br />
Thomas A. Lacey<br />
Vice President<br />
Sales and Marketing Group;<br />
President,<br />
<strong>Intel</strong> Americas, Inc.<br />
Gregory S. Lang<br />
Vice President<br />
Network Communications<br />
Group<br />
General Manager,<br />
Network Interface Division<br />
Claude M. Leglise<br />
Vice President<br />
<strong>Intel</strong> Architecture<br />
Business Group<br />
General Manager,<br />
Home Products Group<br />
Bruce H. Leising<br />
Vice President<br />
Technology and<br />
Manufacturing Group<br />
General Manager,<br />
Fab/Sort Manufacturing<br />
Ann Lewnes<br />
Vice President<br />
Sales and Marketing Group<br />
Director,<br />
Consumer Marketing<br />
Maria A. Marced-Martin<br />
Vice President<br />
Sales and Marketing Group<br />
General Manager,<br />
Europe, Middle East,<br />
Africa Operations<br />
David B. Marsing<br />
Vice President<br />
Technology and<br />
Manufacturing Group<br />
General Manager,<br />
Assembly/Test Manufacturing<br />
Lena J. McCleary<br />
Vice President<br />
Finance and Enterprise<br />
Services<br />
Director of Finance<br />
Steven D. McGeady<br />
Vice President<br />
New Business Group<br />
Director,<br />
Internet Health Initiative<br />
<strong>Intel</strong> Content Services<br />
W. Eric Mentzer<br />
Vice President<br />
Sales and Marketing Group<br />
Director,<br />
Sales Applications, Marketing<br />
and Services<br />
Sandra K. Morris<br />
Vice President<br />
Finance and Enterprise<br />
Services<br />
Director,<br />
e-Business<br />
Jon A. Olson<br />
Vice President<br />
Finance and Enterprise<br />
Services<br />
Director of Finance<br />
Boon Chye Ooi<br />
Vice President<br />
Desktop Products Group<br />
General Manager,<br />
OEM Platform Solutions<br />
Division<br />
Jeffrey A. Pancottine<br />
Vice President<br />
Sales and Marketing Group<br />
Director,<br />
Business Marketing Strategy<br />
Sanjay D. Panditji<br />
Vice President<br />
New Business Group<br />
Director,<br />
Platform Architecture Lab<br />
<strong>Intel</strong> Architecture Labs<br />
Robert S. Pepper<br />
Vice President<br />
Network Communications<br />
Group<br />
Chief Technical Officer,<br />
Level One Communications<br />
Robert H. Perlman<br />
Vice President<br />
Finance and Enterprise<br />
Services<br />
Director,<br />
Tax, Customs and Licensing<br />
David Perlmutter<br />
Vice President<br />
Microprocessor<br />
Products Group<br />
General Manager,<br />
Basic Microprocessor Division<br />
Pamela L. Pollace<br />
Vice President<br />
Sales and Marketing Group<br />
Director,<br />
Worldwide Press Relations<br />
Joseph D. Schutz<br />
Vice President<br />
Technology and<br />
Manufacturing Group<br />
Director,<br />
Logic Technology<br />
Development Microprocessor<br />
Design<br />
Willard F. Sheppard<br />
Vice President<br />
Technology and<br />
Manufacturing Group<br />
Director,<br />
Corporate Services<br />
Gidu K. Shroff<br />
Vice President<br />
Technology and<br />
Manufacturing Group<br />
Director,<br />
Materials<br />
Gadi Singer<br />
Vice President<br />
Microprocessor<br />
Products Group<br />
General Manager,<br />
IA-64 Processor Division<br />
William M. Siu<br />
Vice President<br />
Microprocessor<br />
Products Group<br />
General Manager,<br />
Performance<br />
Microprocessor Division<br />
Jon F. Slusser<br />
Vice President<br />
Technology and<br />
Manufacturing Group<br />
Director,<br />
Corporate Quality Network<br />
Edward Y. So<br />
Vice President<br />
Technology and<br />
Manufacturing Group<br />
Director,<br />
California Technology<br />
and Manufacturing<br />
Frank E. Spindler<br />
Vice President<br />
<strong>Intel</strong> Architecture<br />
Business Group<br />
Director of Marketing,<br />
Mobile Computing Group<br />
Gregory S. Spirakis<br />
Vice President<br />
Microprocessor<br />
Products Group<br />
General Manager,<br />
Design Technology<br />
Randy L. Steck<br />
Vice President<br />
Microprocessor<br />
Products Group<br />
General Manager,<br />
Performance<br />
Microprocessor Division<br />
William A. Swope<br />
Vice President<br />
<strong>Intel</strong> Architecture<br />
Business Group<br />
Director,<br />
Platform Planning,<br />
Integration and<br />
Communication<br />
David L. Tennenhouse<br />
Vice President<br />
Director of Research<br />
Dalibor F. Vrsalovic<br />
Vice President<br />
New Business Group<br />
Chief Technology Officer<br />
Earl L. Whetstone<br />
Vice President<br />
<strong>Intel</strong> Architecture<br />
Business Group<br />
Director,<br />
Sales and Market<br />
Development<br />
Home Products Group<br />
Siew Hai Wong<br />
Vice President<br />
Technology and<br />
Manufacturing Group<br />
Site Manager,<br />
Malaysian Operations<br />
James H. Yasso<br />
Vice President<br />
<strong>Intel</strong> Architecture<br />
Business Group<br />
General Manager,<br />
Reseller Products Division<br />
Fellows<br />
Matthew J. Adiletta<br />
Network Communications<br />
Group<br />
Director,<br />
Communication Processor<br />
Architecture<br />
Network Processing Group<br />
Gregory E. Atwood<br />
Technology and<br />
Manufacturing Group<br />
Director,<br />
Flash Memory Architecture<br />
Bryant E. Bigbee<br />
Microprocessor<br />
Products Group<br />
Director,<br />
Systems Software<br />
Mark T. Bohr<br />
Technology and<br />
Manufacturing Group<br />
Director,<br />
Process Architecture<br />
and Integration<br />
Shekhar Y. Borkar<br />
Microprocessor<br />
Products Group<br />
Director,<br />
Circuit Research<br />
Yan A. Borodovsky<br />
Technology and<br />
Manufacturing Group<br />
Director,<br />
Advanced Lithography<br />
Kenneth C. Cadien<br />
Technology and<br />
Manufacturing Group<br />
Director,<br />
Innovative Technology<br />
Robert P. Colwell<br />
Microprocessor<br />
Products Group<br />
Director,<br />
IA-32 Architecture<br />
Richard L. Coulson<br />
New Business Group<br />
Director,<br />
I/O Architecture<br />
<strong>Intel</strong> Architecture Labs<br />
John H. Crawford<br />
Microprocessor<br />
Products Group<br />
Director,<br />
Microprocessor Architecture<br />
Steven G. Duvall<br />
Technology and<br />
Manufacturing Group<br />
Director,<br />
Optimization and<br />
Statistical Modeling<br />
Paolo A. Gargini<br />
Technology and<br />
Manufacturing Group<br />
Director,<br />
Technology Strategy<br />
Glenn J. Hinton<br />
Microprocessor<br />
Products Group<br />
Director,<br />
IA-32 Microarchitecture<br />
Development<br />
Kevin C. Kahn<br />
New Business Group<br />
Director,<br />
Communications Architecture<br />
<strong>Intel</strong> Architecture Labs<br />
Karl G. Kempf<br />
Technology and<br />
Manufacturing Group<br />
Director,<br />
Decision Technologies<br />
Ellen R. Konar<br />
Sales and Marketing Group<br />
Peter D. MacWilliams<br />
New Business Group<br />
Director,<br />
Platform Architecture<br />
<strong>Intel</strong> Architecture Labs<br />
Paul D. Madland<br />
Microprocessor<br />
Products Group<br />
Director,<br />
Circuit Technology<br />
Eugene S. Meieran<br />
Technology and<br />
Manufacturing Group<br />
Director,<br />
Manufacturing<br />
Strategic Support<br />
David B. Papworth<br />
Microprocessor<br />
Products Group<br />
Director,<br />
Microprocessor Product<br />
Development<br />
Frederick J. Pollack<br />
Microprocessor<br />
Products Group<br />
Director,<br />
Microcomputer<br />
Research Lab<br />
Justin R. Rattner<br />
<strong>Intel</strong> Architecture<br />
Business Group<br />
Director,<br />
Server Architecture Lab<br />
Enterprise Server Group<br />
George E. Sery<br />
Technology and<br />
Manufacturing Group<br />
Director,<br />
Device Technology<br />
Optimization<br />
Carl J. Simonsen<br />
Technology and<br />
Manufacturing Group<br />
Director,<br />
Advanced Library<br />
Architecture and<br />
Design Integration<br />
Clair Webb<br />
Technology and<br />
Manufacturing Group<br />
Director,<br />
Circuit Technology<br />
Uri C. Weiser<br />
Microprocessor<br />
Products Group<br />
Director,<br />
Texas Development Center<br />
Richard B. Wirt<br />
Microprocessor<br />
Products Group<br />
Director,<br />
Microcomputer Software Lab<br />
Leo D. Yau<br />
Technology and<br />
Manufacturing Group<br />
Director,<br />
Innovative Technology Modules<br />
Ian A. Young<br />
Technology and<br />
Manufacturing Group<br />
Director,<br />
Advanced Circuit and<br />
Technology Integration<br />
I N T E L C O R P O R A T I O N 1 9 9 9
40<br />
Investor information<br />
I N T E L C O R P O R A T I O N 1 9 9 9<br />
Investor materials<br />
<strong>Intel</strong>’s Investor Relations home page on the Internet contains background on the company and its products, financial information,<br />
frequently asked questions and our animated online annual report, as well as other useful information.<br />
For investor information, including additional annual reports, 10-Ks, 10-Qs or any other financial literature, please see our<br />
Web site at www.intc.com or contact Harris Trust & Savings Bank at (800) 298-0146 (U.S. and Canada) or (312) 360-5123<br />
(worldwide); or call <strong>Intel</strong> at (44) 1793 403 000 (Europe); (852) 3955 4555 (Hong Kong); (81) 298 47 8511 (Japan).<br />
<strong>Intel</strong> on Nasdaq<br />
<strong>Intel</strong>’s common stock trades on The Nasdaq Stock Market* under the symbol INTC.<br />
Dividend reinvestment program<br />
<strong>Intel</strong>’s Dividend Reinvestment Program allows stockholders to reinvest dividends and contribute additional cash to purchase<br />
<strong>Intel</strong> common stock on an occasional or monthly basis. For more information, call <strong>Intel</strong>’s transfer agent, Harris Trust &<br />
Savings Bank, at (800) 298-0146 (U.S. and Canada) or (312) 360-5123 (worldwide).<br />
Transfer agent and registrar<br />
Harris Trust & Savings Bank, 311 West Monroe, P.O. Box A3504, Chicago, IL 60690-3504 USA. Stockholders may call<br />
(800) 298-0146 (U.S. and Canada) or (312) 360-5123 (worldwide) with any questions regarding transfer of ownership<br />
of <strong>Intel</strong> stock.<br />
Independent auditors<br />
Ernst & Young LLP, San Jose, California, USA<br />
Environment, health and safety<br />
<strong>Intel</strong> employees continued to improve their world-class health and safety performance by again dramatically reducing workplace<br />
injuries and illnesses in <strong>1999</strong>. Over the past four years, the company has reduced the Occupational Safety and Health<br />
Administration (OSHA) recordable injury rate an average of 40% each year and the lost-day case rate an average of 38%<br />
each year. The Center for Office Ergonomics, an external organization of computer users and manufacturers, recognized <strong>Intel</strong><br />
with its annual Outstanding Office Ergonomics Award for promoting the successful implementation of a sound office ergonomics<br />
program that is measurable and sustainable. Our Design for Environment efforts have reduced air emissions as well as water<br />
and energy use per manufacturing unit in each of our last five product generations. <strong>Intel</strong>’s Northwest Region received the U.S.<br />
Environmental Protection Agency’s Evergreen Award for environmental excellence, and our Costa Rica site received the<br />
Preventico Global Award for exhibiting the highest OSHA standards. Our inaugural Environmental Excellence Award went to a<br />
team implementing a program for reusing shipping trays that reduced waste generation and saved <strong>Intel</strong> more than $50 million.<br />
Please see our Environmental, Health and Safety Performance <strong>Report</strong> at www.intel.com/go/ehs. For a printed copy,<br />
call (800) 316-5542 (U.S. and Canada) or (480) 552-2771 (worldwide).<br />
Workplace of choice<br />
We strive to be a workplace in which people of diverse backgrounds are valued, challenged, acknowledged and rewarded,<br />
leading to increasingly higher levels of fulfillment and productivity. For more information, see our Workplace of Choice report<br />
at www.intel.com/intel/employment/workplace/choice.htm.<br />
<strong>Intel</strong> and education<br />
Our vision of a billion connected computers around the world can only become a reality if our industry and others continue<br />
to be driven by bright, creative, educated employees. We are committed to empowering teachers with the skills and resources<br />
necessary to prepare students for success in higher education and the competitive workforce of the 21st century.<br />
<strong>Intel</strong> now donates more than $100 million per year to initiatives that support education in math, science and technology. We<br />
have a particular goal to provide professional development for 400,000 K-12 math and science teachers by training them<br />
how to incorporate computers into their curriculum. Teachers’ skills and motivation are critical to improving student achievement<br />
in mathematics and science.<br />
We are pleased that Craig Barrett was appointed to the National Commission on Mathematics and Science Teaching for<br />
the 21st Century. This area is a priority not just for <strong>Intel</strong> or our industry, but for the future of the country. As we work to build<br />
the Internet economy, we also intend to support the educational initiatives that will make it a success.
About <strong>Intel</strong><br />
Today, <strong>Intel</strong> supplies the computing and communications industries with chips,<br />
boards, systems and software that are the “ingredients” of computers, servers, and<br />
networking and communications products. These products are used by industry members<br />
to create advanced computing and communications systems. <strong>Intel</strong>’s mission is<br />
to be the preeminent building block supplier to the worldwide Internet economy.<br />
Principal products<br />
<strong>Intel</strong> ® architecture platform products. Microprocessors, also called central processing units (CPUs) or chips, are frequently<br />
described as the “brains” of a computer, because they control the central processing of data in personal computers (PCs),<br />
servers, workstations and other computers. <strong>Intel</strong> offers microprocessors optimized for each segment of the computing market:<br />
• Pentium ® III Xeon TM<br />
processor for mid-range to high-end servers and workstations<br />
• Pentium ® III processor for entry-level servers and workstations and performance desktop PCs<br />
• <strong>Intel</strong> ® Celeron TM<br />
processor for value PC desktop systems<br />
• Mobile Pentium ® II and Pentium III processors for performance in mobile PC systems<br />
Chipsets perform essential logic functions surrounding the CPU in computers, and support and extend the graphics, video<br />
and other capabilities of many <strong>Intel</strong> processor-based systems.<br />
Motherboards combine <strong>Intel</strong> microprocessors and chipsets to form the basic subsystem of a PC or server.<br />
I N T E L C O R P O R A T I O N 1 9 9 9<br />
Wireless communications and computing products. These products are component-level hardware and software focusing<br />
on digital cellular communications and other applications needing both low-power processing and reprogrammable, retained<br />
memory capability (flash memory). These products are used in mobile phones, handheld devices, two-way pagers and many<br />
other products.<br />
Networking and communications products. System-level products consist of hardware, software and support services<br />
for e-Business data centers and building blocks for communications access solutions. These products include e-Commerce<br />
infrastructure appliances; hubs, switches and routers for Ethernet networks; and computer telephony components.<br />
Component-level products include communications silicon components and embedded control chips designed to perform<br />
specific functions in networking and communications applications, such as telecommunications, hubs, routers and wide<br />
area networking. Embedded control chips are also used in laser printers, imaging, storage media, automotive systems and<br />
other applications.<br />
Solutions and services. These products and services include e-Commerce data center services as well as connected<br />
peripherals and security access software.<br />
Major customers<br />
<strong>Intel</strong>’s major customers include:<br />
Original equipment manufacturers (OEMs) of computer systems, telecommunications and data communications equipment,<br />
and peripherals.<br />
PC users—including individuals, large and small businesses, and Internet service providers—who buy <strong>Intel</strong>’s PC enhancements,<br />
business communications products and networking products through reseller, retail and OEM channels.<br />
Other manufacturers, including makers of a wide range of industrial and communications equipment.<br />
We would like to thank Compaq Computer <strong>Corporation</strong>, Dell Computer <strong>Corporation</strong>, International Business Machines <strong>Corporation</strong>, Nokia <strong>Corporation</strong> and Psion Incorporated for the use of<br />
their products and/or images shown in this report. We would also like to thank International Data <strong>Corporation</strong> (IDC) for data provided.<br />
Printed on recycled paper with soy-based inks. <strong>Intel</strong>, the <strong>Intel</strong> logo, <strong>Intel</strong> Inside, the <strong>Intel</strong> Inside logo, <strong>Intel</strong> StrataFlash, Pentium, the Pentium processor logo and Profusion are registered<br />
trademarks and AnyPoint, Celeron, <strong>Intel</strong> Internet Exchange, <strong>Intel</strong> Play, Itanium, MMX, Pentium ® II Xeon and Pentium ® III Xeon are trademarks of <strong>Intel</strong> <strong>Corporation</strong>. <strong>Intel</strong> WebOutfitter is a trademark<br />
and service mark of <strong>Intel</strong> <strong>Corporation</strong>. ARM and StrongARM are trademarks of Advanced RISC Machines, Ltd. * All other brands and names are the property of their respective owners.<br />
Printed in the USA. 0400/3.3M/AL/MD/LS/HP. Copyright © 2000, <strong>Intel</strong> <strong>Corporation</strong>. All rights reserved.
<strong>Intel</strong> around the world<br />
United States and Canada<br />
<strong>Intel</strong> <strong>Corporation</strong><br />
Robert Noyce Building<br />
2200 Mission College Boulevard<br />
P.O. Box 58119<br />
Santa Clara, CA 95052-8119<br />
USA<br />
Phone<br />
General information: (408) 765-8080<br />
Customer support: (800) 628-8686<br />
Europe<br />
<strong>Intel</strong> <strong>Corporation</strong> (UK) Ltd.<br />
Pipers Way<br />
Swindon<br />
Wiltshire SN3 1RJ<br />
UK<br />
Phone<br />
England: (44) 1793 403 000<br />
Germany: (49) 89 99143 0<br />
France: (33) 1 4571 7171<br />
Italy: (39) 2 575 441<br />
Israel: (972) 2 589 7111<br />
Netherlands: (31) 10 286 6111<br />
Sweden: (46) 8 705 5600<br />
Asia-Pacific<br />
<strong>Intel</strong> Semiconductor Ltd.<br />
32/F Two Pacific Place<br />
88 Queensway, Central<br />
Hong Kong, SAR<br />
intc.com<br />
Phone: (852) 2844 4555<br />
Japan<br />
<strong>Intel</strong> Kabushiki Kaisha<br />
P.O. Box 115 Tsukuba-gakuen<br />
5-6 Tokodai, Tsukuba-shi<br />
Ibaraki-ken 305<br />
Japan<br />
Phone: (81) 298 47 8522<br />
South America<br />
<strong>Intel</strong> Semicondutores do Brazil<br />
Rue Florida, 1703-2 and CJ22<br />
CEP 04565-001 Sao Paulo-SP<br />
Brazil<br />
Phone: (55) 11 5505 2296<br />
For more information<br />
To learn more about <strong>Intel</strong> <strong>Corporation</strong>,<br />
visit our site on the World Wide Web<br />
at www.intel.com<br />
Visit <strong>Intel</strong> on the Internet any time for stock quotes,<br />
earnings and the latest news.<br />
Just a click away. With a simple mouse click, you are connected to<br />
our in-depth investor resources. Analysis and graphs. Historical financials.<br />
Handy links to other sites. It’s all here.<br />
Most recent earnings report. Each quarter, we release our earnings<br />
results and broadcast management’s comments on the quarter live<br />
on our Web site. Come to www.intc.com to find earnings release<br />
schedules and hear the live broadcast.<br />
Current quotes. <strong>Intel</strong>’s stock quote, daily trading range and historical<br />
price information at your fingertips.<br />
The latest <strong>Intel</strong> news. Want it now? Want it fast? Get all the <strong>Intel</strong><br />
news you need at www.intc.com. You can even subscribe to our e-mail<br />
alerts and have the information sent to you online.