Economy of Jaffna and Business
Economy of Jaffna and Business
Economy of Jaffna and Business

You also want an ePaper? Increase the reach of your titles
YUMPU automatically turns print PDFs into web optimized ePapers that Google loves.
2/19/2009<br />
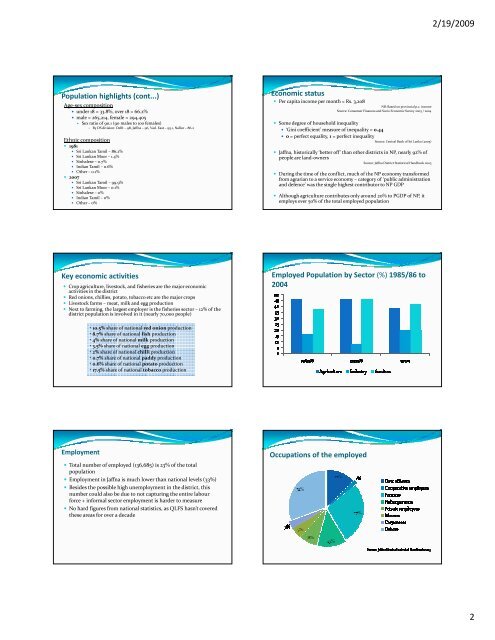
Population highlights (cont...)<br />
Age‐sex composition<br />
• under 18 = 33.8%, over 18 = 66.2%<br />
• male = 265,214, female = 294,405<br />
• Sex ratio <strong>of</strong> 90.1 (90 males to 100 females)<br />
• By DS division: Delft – 98, <strong>Jaffna</strong> – 96, Vad. East – 95.1, Nallur – 86.2<br />
Ethnic composition<br />
• 1981<br />
• Sri Lankan Tamil – 86.2%<br />
• Sri Lankan Moor – 1.4%<br />
• Sinhalese –0.7%<br />
• Indian Tamil – 0.6%<br />
• Other –0.1%<br />
• 2007<br />
• Sri Lankan Tamil – 99.9%<br />
• Sri Lankan Moor – 0.1%<br />
• Sinhalese –0%<br />
• Indian Tamil – 0%<br />
• Other –0%<br />
Economic status<br />
• Per capita income per month ≈ Rs. 3,208<br />
NB: Based on provincial p.c. income<br />
Source: Consumer Finances <strong>and</strong> Socio Economic Survey 2003 / 2004<br />
• Some degree <strong>of</strong> household inequality<br />
• ‘Gini coefficient’ measure <strong>of</strong> inequality ≈ 0.44<br />
• 0 = perfect equality, 1 = perfect inequality<br />
Source: Central Bank <strong>of</strong> Sri Lanka (2005)<br />
• <strong>Jaffna</strong>, historically ‘better <strong>of</strong>f’ than other districts in NP, nearly 92% <strong>of</strong><br />
people are l<strong>and</strong>‐owners<br />
Source: <strong>Jaffna</strong> District Statistical H<strong>and</strong>book 2003<br />
• During the time <strong>of</strong> the conflict, much <strong>of</strong> the NP economy transformed<br />
from agrarian to a service economy –category <strong>of</strong> ‘public administration<br />
<strong>and</strong> defence’ was the single highest contributor to NP GDP<br />
• Although agriculture contributes only around 20% to PGDP <strong>of</strong> NP, it<br />
employs over 50% <strong>of</strong> the total employed population<br />
Key economic activities<br />
• Crop agriculture, livestock, <strong>and</strong> fisheries are the major economic<br />
activities in the district<br />
• Red onions, chillies, potato, tobacco etc are the major crops<br />
• Livestock farms –meat, milk <strong>and</strong> egg production<br />
• Next to farming, the largest employer is the fisheries sector – 12% <strong>of</strong> the<br />
district population is involved in it (nearly 70,000 people)<br />
Employed Population by Sector (%) 1985/86 to<br />
2004<br />
• 10.5% share <strong>of</strong> national red onion production<br />
• 8.7% share <strong>of</strong> national fish production<br />
• 4% share <strong>of</strong> national milk production<br />
• 3.5% share <strong>of</strong> national egg production<br />
• 2% share <strong>of</strong> national chilli production<br />
• 0.7% share <strong>of</strong> national paddy production<br />
• 0.6% share <strong>of</strong> national potato production<br />
• 17.5% share <strong>of</strong> national tobacco production<br />
Employment<br />
• Total number <strong>of</strong> employed (136,685) is 23% <strong>of</strong> the total<br />
population<br />
• Employment in <strong>Jaffna</strong> is much lower than national levels (33%)<br />
• Besides the possible high unemployment in the district, this<br />
number could also be due to not capturing the entire labour<br />
force + informal sector employment is harder to measure<br />
• No hard figures from national statistics, as QLFS hasn’t covered<br />
these areas for over a decade<br />
Occupations <strong>of</strong> the employed<br />
2