Economy of Jaffna and Business
Economy of Jaffna and Business
Economy of Jaffna and Business

You also want an ePaper? Increase the reach of your titles
YUMPU automatically turns print PDFs into web optimized ePapers that Google loves.
2/19/2009<br />
Economic Affairs Division<br />
SCOPP<br />
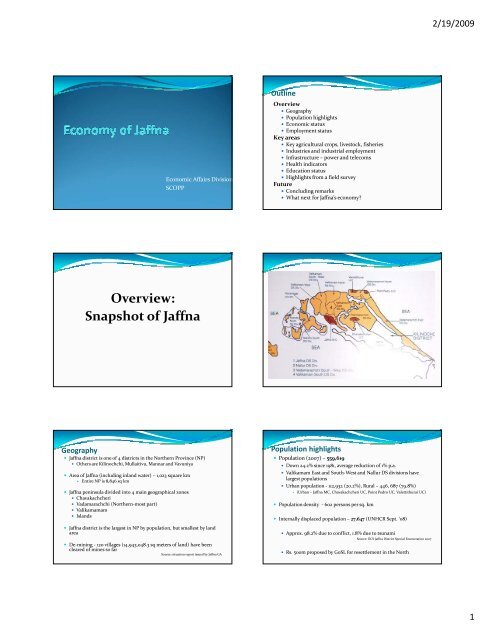
Outline<br />
Overview<br />
• Geography<br />
• Population highlights<br />
• Economic status<br />
• Employment status<br />
Key areas<br />
• Key agricultural l crops, livestock, fisheries<br />
i<br />
• Industries <strong>and</strong> industrial employment<br />
• Infrastructure –power <strong>and</strong> telecoms<br />
• Health indicators<br />
• Education status<br />
• Highlights from a field survey<br />
Future<br />
• Concluding remarks<br />
• What next for <strong>Jaffna</strong>’s economy?<br />
Overview:<br />
Snapshot <strong>of</strong> <strong>Jaffna</strong><br />
Geography<br />
• <strong>Jaffna</strong> district is one <strong>of</strong> 4 districts in the Northern Province (NP)<br />
• Others are Kilinochchi, Mullaitivu, Mannar <strong>and</strong> Vavuniya<br />
• Area <strong>of</strong> <strong>Jaffna</strong> (including inl<strong>and</strong> water) –1,023 square km<br />
• Entire NP is 8,846 sq km<br />
• <strong>Jaffna</strong> peninsula divided into 4 main geographical zones<br />
• Chavakachcheri<br />
h h • Vadamarachchi (Northern‐most part)<br />
• Valikamamam<br />
• Isl<strong>and</strong>s<br />
• <strong>Jaffna</strong> district is the largest in NP by population, but smallest by l<strong>and</strong><br />
area<br />
• De‐mining ‐ 120 villages (14,943,048.3 sq meters <strong>of</strong> l<strong>and</strong>) have been<br />
cleared <strong>of</strong> mines so far<br />
Source: situation report issued by <strong>Jaffna</strong> GA<br />
Population highlights<br />
• Population (2007) – 559,619<br />
• Down 24.2% since 1981, average reduction <strong>of</strong> 1% p.a.<br />
• Valikamam East <strong>and</strong> South‐West <strong>and</strong> Nallur DS divisions have<br />
largest populations<br />
• Urban population ‐ 112,932 (20.2%), Rural – 446, 687 (79.8%)<br />
• (Urban – <strong>Jaffna</strong> MC, Chavakachcheri UC, Point Pedro UC, Valettithurai UC)<br />
• Population density ‐ 602 persons per sq. km<br />
• Internally displaced population – 27,647 (UNHCR Sept. ‘08)<br />
• Approx. 98.2% due to conflict, 1.8% due to tsunami<br />
Source: DCS <strong>Jaffna</strong> District Special Enumeration 2007<br />
• Rs. 500m proposed by GoSL for resettlement in the North<br />
1
2/19/2009<br />
Population highlights (cont...)<br />
Age‐sex composition<br />
• under 18 = 33.8%, over 18 = 66.2%<br />
• male = 265,214, female = 294,405<br />
• Sex ratio <strong>of</strong> 90.1 (90 males to 100 females)<br />
• By DS division: Delft – 98, <strong>Jaffna</strong> – 96, Vad. East – 95.1, Nallur – 86.2<br />
Ethnic composition<br />
• 1981<br />
• Sri Lankan Tamil – 86.2%<br />
• Sri Lankan Moor – 1.4%<br />
• Sinhalese –0.7%<br />
• Indian Tamil – 0.6%<br />
• Other –0.1%<br />
• 2007<br />
• Sri Lankan Tamil – 99.9%<br />
• Sri Lankan Moor – 0.1%<br />
• Sinhalese –0%<br />
• Indian Tamil – 0%<br />
• Other –0%<br />
Economic status<br />
• Per capita income per month ≈ Rs. 3,208<br />
NB: Based on provincial p.c. income<br />
Source: Consumer Finances <strong>and</strong> Socio Economic Survey 2003 / 2004<br />
• Some degree <strong>of</strong> household inequality<br />
• ‘Gini coefficient’ measure <strong>of</strong> inequality ≈ 0.44<br />
• 0 = perfect equality, 1 = perfect inequality<br />
Source: Central Bank <strong>of</strong> Sri Lanka (2005)<br />
• <strong>Jaffna</strong>, historically ‘better <strong>of</strong>f’ than other districts in NP, nearly 92% <strong>of</strong><br />
people are l<strong>and</strong>‐owners<br />
Source: <strong>Jaffna</strong> District Statistical H<strong>and</strong>book 2003<br />
• During the time <strong>of</strong> the conflict, much <strong>of</strong> the NP economy transformed<br />
from agrarian to a service economy –category <strong>of</strong> ‘public administration<br />
<strong>and</strong> defence’ was the single highest contributor to NP GDP<br />
• Although agriculture contributes only around 20% to PGDP <strong>of</strong> NP, it<br />
employs over 50% <strong>of</strong> the total employed population<br />
Key economic activities<br />
• Crop agriculture, livestock, <strong>and</strong> fisheries are the major economic<br />
activities in the district<br />
• Red onions, chillies, potato, tobacco etc are the major crops<br />
• Livestock farms –meat, milk <strong>and</strong> egg production<br />
• Next to farming, the largest employer is the fisheries sector – 12% <strong>of</strong> the<br />
district population is involved in it (nearly 70,000 people)<br />
Employed Population by Sector (%) 1985/86 to<br />
2004<br />
• 10.5% share <strong>of</strong> national red onion production<br />
• 8.7% share <strong>of</strong> national fish production<br />
• 4% share <strong>of</strong> national milk production<br />
• 3.5% share <strong>of</strong> national egg production<br />
• 2% share <strong>of</strong> national chilli production<br />
• 0.7% share <strong>of</strong> national paddy production<br />
• 0.6% share <strong>of</strong> national potato production<br />
• 17.5% share <strong>of</strong> national tobacco production<br />
Employment<br />
• Total number <strong>of</strong> employed (136,685) is 23% <strong>of</strong> the total<br />
population<br />
• Employment in <strong>Jaffna</strong> is much lower than national levels (33%)<br />
• Besides the possible high unemployment in the district, this<br />
number could also be due to not capturing the entire labour<br />
force + informal sector employment is harder to measure<br />
• No hard figures from national statistics, as QLFS hasn’t covered<br />
these areas for over a decade<br />
Occupations <strong>of</strong> the employed<br />
2
2/19/2009<br />
Key <strong>Business</strong><br />
Opportunities<br />
Red Onion production<br />
• Sri Lanka ‐109,281 Mt<br />
• Northern Province ‐ 22,484 Mt<br />
• <strong>Jaffna</strong> District ‐ 11,422 Mt (largest producer in the<br />
NP)<br />
• <strong>Jaffna</strong> has approx. 10.5% share <strong>of</strong> national red onion<br />
output(NP has 20.6%)<br />
• Dramatic decline since 1990 (54%) <strong>and</strong> even more recently since<br />
2000 (24%)<br />
Source: PPID <strong>and</strong> DCS<br />
35000<br />
30000<br />
Red Onion production (in Metric tons)<br />
Chilli production<br />
• Sri Lanka ‐60,870 Mt<br />
• Northern Province ‐ 5,142 Mt<br />
• <strong>Jaffna</strong> District ‐ 1,301 Mt<br />
25000<br />
20000<br />
15000<br />
10000<br />
• <strong>Jaffna</strong> has approx. 2% share <strong>of</strong> national chillie output, down<br />
from 6% in 1990<br />
• NP has around 9%<br />
5000<br />
0<br />
1990 2000 2001 2002 2003 2004 2005<br />
Source: PPID <strong>and</strong> DCS<br />
7000<br />
6000<br />
5000<br />
4000<br />
3000<br />
2000<br />
1000<br />
0<br />
Chilli production (in Metric tons)<br />
1990 2000 2001 2002 2003 2004 2005<br />
Tobacco production<br />
• Sri Lanka ‐4,204 Mt<br />
• Northern Province ‐1,147 Mt<br />
• <strong>Jaffna</strong> District ‐ 736 Mt (largest producer in the NP)<br />
• <strong>Jaffna</strong> has approx. 17.5% share <strong>of</strong> national tobacco<br />
output, significantly up from 10.7% in 2001<br />
• NP has a 27.3% share<br />
Source: PPID <strong>and</strong> DCS<br />
• Comments by CTC<br />
• NP tobacco traditionally used for ‘beedi’ <strong>and</strong> cigars –for which dem<strong>and</strong><br />
is now dropping<br />
• High chloride levels <strong>and</strong> a different type <strong>of</strong> soil mainly in the coastal<br />
areas, therefore not suitable for growing cigarette tobacco<br />
• But with new agriculture technology, possibility <strong>of</strong> exploring interior<br />
l<strong>and</strong>s for growing cigarette tobacco?<br />
• Lack <strong>of</strong> adequate transport facilities<br />
3
2/19/2009<br />
Tobacco production (in Metric tons)<br />
Paddy Production<br />
1200<br />
1000<br />
800<br />
600<br />
400<br />
200<br />
• Sri Lanka ‐2,628 thous<strong>and</strong> Mt<br />
• Northern Province – 160 thous<strong>and</strong> Mt<br />
• <strong>Jaffna</strong> District ‐ 14 thous<strong>and</strong> Mt<br />
• <strong>Jaffna</strong> has approx. 0.7% share <strong>of</strong> national paddy output(NP<br />
has 8.3%)<br />
• Except for 3% in 1980 <strong>and</strong> 1.3% in 1990, since 2000 this share has<br />
been roughly in the same region ‐ between 0.3 –0.7%<br />
0<br />
1990 2000 2001 2002 2003 2004 2005<br />
Source: PPID <strong>and</strong> DCS<br />
35<br />
30<br />
25<br />
Paddy (in thous<strong>and</strong> metric tons)<br />
Potato Production<br />
• Sri Lanka<br />
‐79,445 Mt<br />
• Northern Province ‐ 464 Mt<br />
• <strong>Jaffna</strong> District ‐ 443 Mt (largest producer in NP)<br />
20<br />
15<br />
• <strong>Jaffna</strong> has approx. 0.6% share <strong>of</strong> national potato output(NP<br />
has around 0.6%), down from 1.2% in 2000<br />
10<br />
5<br />
0<br />
1990 2000 2001 2002 2003 2004 2005<br />
Source: PPID <strong>and</strong> DCS<br />
1200<br />
1000<br />
800<br />
600<br />
400<br />
200<br />
0<br />
Potato production (in Metric tons)<br />
1990 2000 2001 2002 2003 2004 2005<br />
Livestock, Milk <strong>and</strong> Egg production<br />
• Mostly a household self‐employment activity rather than a commercial<br />
activity<br />
MILK<br />
• Sri Lanka<br />
‐192.7 million ltrs<br />
• Northern Province ‐19.6 million ltrs<br />
• <strong>Jaffna</strong> District ‐ 7.7 million ltrs (largest producer in NP)<br />
• <strong>Jaffna</strong> has a 4% share <strong>of</strong> national milk output, <strong>and</strong> has remained in this<br />
region since 1980/1990<br />
• NP has around 10.2%<br />
EGGS<br />
• Sri Lanka<br />
‐864.6 million<br />
• Northern Province ‐66.3 million<br />
• <strong>Jaffna</strong> District ‐ 30.1 million (largest producer in NP)<br />
• <strong>Jaffna</strong> has a 3.5% share <strong>of</strong> national egg output, <strong>and</strong> steadily growing since<br />
2000 (1.3%)<br />
• NP has around 7.7%<br />
Source: PPID <strong>and</strong> DCS<br />
4
2/19/2009<br />
8<br />
7.5<br />
7<br />
6.5<br />
6<br />
35<br />
30<br />
25<br />
20<br />
15<br />
10<br />
5<br />
0<br />
Milk production (in million litres)<br />
1990 2000 2001 2002 2003 2004 2005<br />
Egg production (in millions)<br />
1990 2000 2001 2002 2003 2004 2005<br />
Fisheries<br />
• Sri Lanka ‐153,180 Mt<br />
• Northern Province ‐ 56,550 Mt<br />
• <strong>Jaffna</strong> District ‐ 33,980 (largest producer in NP)<br />
• <strong>Jaffna</strong> has a 8.7% share <strong>of</strong> national fish output, steadily growing<br />
since 4.9% in 2000, but dramatically down from 29% in<br />
1980, pre‐conflict time.<br />
• NP has around 16% share<br />
Source: PPID <strong>and</strong> DCS<br />
60000<br />
50000<br />
40000<br />
Fish catch (in Metric tons)<br />
Industries<br />
• Around 2,800 industries in <strong>Jaffna</strong><br />
• Industries with < 10 employees ≈ 2,684<br />
• Industries with 10 or more employees ≈ 113<br />
Source: DCS: Census <strong>of</strong> Industries 2003<br />
30000<br />
20000<br />
• NP has 4,828 industries, <strong>Jaffna</strong> has the largest number in the<br />
province<br />
10000<br />
0<br />
1980 1990 2000 2001 2002 2003 2004 2005<br />
Source: PPID <strong>and</strong> DCS<br />
Employment in Industries<br />
• Around 9,200 are employed in industries<br />
• in industries with < 10 employees ≈ 6,933<br />
• in industries with 10 or more employees ≈ 2,224<br />
Source: DCS Census <strong>of</strong> Industries 2003<br />
• NP has 17,176 industries, <strong>Jaffna</strong> is the largest employer in the<br />
province<br />
Resource<br />
Limestone<br />
Livestock<br />
Marine resources<br />
Palmyrah<br />
Fruits & vegetables<br />
Coconut<br />
Paddy & rice<br />
Potential industry<br />
Cement <strong>and</strong> limekiln<br />
Processed milk, yoghurt, ice cream, dairy & poultry farm, bio<br />
gas, <strong>and</strong> manufacture <strong>of</strong> compost manure<br />
Fish, dry fish, manufacture <strong>of</strong> fishing gear, ice plants, boat building, <strong>and</strong><br />
processing <strong>of</strong> lobsters for exports<br />
Bottling <strong>of</strong> toddy & sweet toddy, jaggery & palm sugar, distilling arrack, odiel<br />
flour, fibre & fibre products, mat weaving, <strong>and</strong> palmyrah leaves products<br />
Fruit processing, jams, cordials, savouries, pickles, dehydrated fruits &<br />
vegetables<br />
Coconut oil, soap, animal fodder, charcoal, fibre & coir products<br />
Rice milling, rice flour<br />
Chillies<br />
Tobacco<br />
Sauces & powder<br />
Cigars <strong>and</strong> cigarettes<br />
Clay<br />
Pottery<br />
Source: Ministry <strong>of</strong> Rehabilitation, Reconstruction & Refugees, <strong>Jaffna</strong> Plan, 2003<br />
5
2/19/2009<br />
Tourism<br />
• Domestic tourism to <strong>Jaffna</strong> increased during the ceasefire period<br />
• <strong>Jaffna</strong> boasts historically important sites as well as sites <strong>of</strong> religious<br />
worship that attract thous<strong>and</strong>s <strong>of</strong> people to the peninsula –<br />
Naagadeepa Vihare, Nallur Kovil, ancient temples on the isl<strong>and</strong>s etc<br />
• However, tourism authorities note the total lack <strong>of</strong> infrastructure to<br />
support the industry –everything needs to be built from scratch<br />
• Industry actors also note some lack <strong>of</strong> interest by central govt. in<br />
developing the tourism sector<br />
Minerals<br />
• The Vadamarachchi East area <strong>of</strong> the peninsula said to be endowed with<br />
large deposits <strong>of</strong> silica s<strong>and</strong>, which can be used in the manufacturing <strong>of</strong><br />
glass products<br />
• Distinction between silica <strong>and</strong> pure silica –only pure silica (free <strong>of</strong> iron<br />
stains) can be used for manufacturing glass<br />
• Deposits <strong>of</strong> normal construction s<strong>and</strong><br />
• Has not been systematically ti tapped, but will be a very useful resource<br />
when Eastern <strong>and</strong> Northern revival takes <strong>of</strong>f<br />
• Limestone deposits at Kankasanthurai (KKS)<br />
• Some <strong>of</strong> it already being tapped by the cement factory there<br />
• No recent data with GSMB regarding deposits <strong>and</strong> utilisation in <strong>Jaffna</strong><br />
• <strong>Jaffna</strong> can benefit from proximity to Pulmodai mineral s<strong>and</strong> deposit <strong>and</strong><br />
Seruwavila iron copper deposit<br />
Power <strong>and</strong> Telecoms in <strong>Jaffna</strong><br />
• No. <strong>of</strong> electricity connections ‐ 81,536<br />
• 108,507 in NP<br />
• No. <strong>of</strong> l<strong>and</strong> phone connections* ‐ 9,743<br />
*(Sri Lanka Telecom, Suntel, <strong>and</strong> Lanka Bell)<br />
• 20,059 in NP<br />
Source: CEB <strong>and</strong> TRC<br />
• Mobile phones – <strong>Jaffna</strong> shows one <strong>of</strong> the highest usage rates, possibly<br />
due to lack <strong>of</strong> fixed line coverage<br />
• <strong>Jaffna</strong> mobile users spend as much as 12% <strong>of</strong> income on<br />
telecommunications<br />
• High spending on making/receiving international calls<br />
• Removing a major constraint to business, <strong>Jaffna</strong> has just received highspeed<br />
internet coverage from Mobitel<br />
Selected health indicators<br />
• Infant mortality rate ‐ 22.3%<br />
• Maternal mortality ratio –62%<br />
• Low birth weight ‐ 30.5%<br />
• Underweight 0‐5 years ‐ 43.1%<br />
• Home births ‐ 4.4%<br />
• Safe sanitation ‐ 79.0%<br />
Source: WHO 2002<br />
• Shortage <strong>of</strong> doctors in the district, those passing out from the <strong>Jaffna</strong><br />
medical faculty shift elsewhere to work<br />
• Some reports <strong>of</strong> as much as 200 vacancies for doctors, not filled<br />
• Some govt. doctors spending more time practising in private hospitals<br />
<strong>and</strong> clinics after work than in govt. hospitals <strong>and</strong> clinics<br />
• Patients are charged high consultation fees (as a proportion <strong>of</strong> their<br />
income) at these private clinics (around Rs. 300‐350)<br />
Education status<br />
• Literacy rate, Net Initial Intake rate in Grade 1 not available as in<br />
depth household survey not conducted<br />
• Survival rate from Grade 1 to 9 in NP (2007) = 78.3%<br />
• Male = 73.5%, Female = 83.3%<br />
• Second lowest, after Eastern Province<br />
• National average is 87.09%<br />
• Even lagging provinces <strong>of</strong> Uva <strong>and</strong> Sabaragamuwa are higher, h at 86.8% 8% <strong>and</strong><br />
87.6% respectively<br />
Source: ‘Student flow analysis’ based on Min. <strong>of</strong> Educ. School Census 2006 & 2007<br />
Performance at Secondary School Examinations (2004)<br />
• G.C.E O/L pass rate – 40% (up from 34% in 1998)<br />
• G.C.E A/L pass rate – 58% (down from 67% in 1998)<br />
Source: Dept. Of Examinations<br />
Education status –GCE A/L<br />
• 51.6% <strong>of</strong> students enrolled for GCE A/Ls in 2008, having sat GCE<br />
O/Ls in 2007<br />
• Recent A/L examinations ‐ breakdown by subject stream:<br />
• Science – 20.2%<br />
• Commerce – 12.1%<br />
• Arts – 67.7%<br />
• Due to appear for A/Ls in 2009 – breakdown by subject<br />
• Science – 18.8%<br />
• Commerce – 14.8%<br />
• Arts – 66.4%<br />
Source: Calculations by M. Sivagnanam, Former Director Primary Education, Ministry <strong>of</strong> Education, based<br />
on School Census 2007 & 2008<br />
6
2/19/2009<br />
Results from a field survey – PPID/ILO<br />
• Survey carried out by PPID; included all districts in the North;<br />
target group was children <strong>and</strong> youth (aged 15‐19 yrs)<br />
• 57% <strong>of</strong> the respondents were female <strong>and</strong> 43% male<br />
• 85% <strong>of</strong> respondents in <strong>Jaffna</strong> wanted to pursue further or higher<br />
education – within this, a higher proportion <strong>of</strong> females (49%)<br />
than males (36%)<br />
• 28% preferred to follow arts <strong>and</strong> humanities, 25% preferred commerce,<br />
21% preferred biological sciences, 15% preferred physical sciences,<br />
7% preferred to follow teaching education, <strong>and</strong> 5% social sciences<br />
• A further 7% wanted to follow vocational studies<br />
• Around 7.4% wished to work immediately after formal schooling<br />
• Preference <strong>of</strong> sector <strong>and</strong> category <strong>of</strong> employment<br />
• 36% sought the pr<strong>of</strong>essional/technical category <strong>of</strong> employment, 19%<br />
administrative, 15% managerial in the public sector<br />
• 4% <strong>of</strong> children sought managerial, 3% sought administrative <strong>and</strong> 2%<br />
sought pr<strong>of</strong>essional/technical positions in the private sector<br />
• So significant preference away from working in primary sector<br />
(agric., fisheries, farming etc) –only around 6% in total<br />
Desired skills training ‐ results from a field survey<br />
(cont...)<br />
• Computer studies topped the preference <strong>of</strong> all respondents all the five<br />
districts <strong>of</strong> the North, followed by accounting studies<br />
• 50% <strong>of</strong> the children <strong>and</strong> 53% <strong>of</strong> their parents stated a preference for<br />
computer studies training<br />
• 24% <strong>of</strong> the children <strong>and</strong> 22% <strong>of</strong> their parents stated a preference for<br />
accounting studies training<br />
• Females showed a stronger preference than males, in both<br />
categories<br />
• Preferences for training in electrical/electronic/telecommunication<br />
(4%), clerical/typing/secretarial (4%), <strong>and</strong> hairdressing/beauty culture<br />
(3%) were also noted<br />
• On the supply side, <strong>of</strong> the firms interviewed, 37% stated that lack <strong>of</strong><br />
English language skill is the main problem among the employees, 23%<br />
lack IT awareness, <strong>and</strong> 19% lack Sinhala language skills<br />
Source: Sarvananthan, M. (2005), ‘Identification <strong>of</strong> Economic Opportunities for Children Affected by War in the<br />
Northern Province <strong>of</strong> Sri Lanka’<br />
What next?<br />
Reconstruction <strong>and</strong> revival<br />
• ‘Uthuru Wasanthaya’ – Northern revival plan by GoSL<br />
• Rs. 3 billion for rebuilding 80,000 houses <strong>and</strong> to restore livelihoods<br />
• Rs. 500 million for resettlement programmes<br />
• The World Bank<br />
• North‐East Irrigated Agriculture Project (NEIAP)<br />
• North East Emergency Rehabilitation Project (NEERP)<br />
• Education Sector Development Project (ESDP) – includes N‐E among other provinces<br />
• Community Livelihoods in Conflict Affected Areas Project<br />
• Latest Country‐Assistance Strategy (2009‐2012) notes in the section on post‐conflict<br />
development:<br />
• Integrated rural infrastructure <strong>and</strong> livelihood project<br />
• Addressing needs in public service delivery –rebuilding schools <strong>and</strong> clinics<br />
• Support for housing, rehabilitation <strong>of</strong> inter‐village roads <strong>and</strong> community<br />
infrastructure, improving the business environment<br />
• Support for reducing youth unemployment, introducing trauma counselling at village<br />
level<br />
• Enhancing inter‐ethnic awareness – learning a ‘link’ language plus learning each others<br />
languages etc<br />
• Asian Development Bank<br />
• North East Community Restoration <strong>and</strong> Development Project (NECORD)<br />
• Conflict Affected Area Rehabilitation Project (CAARP)<br />
Concluding remarks<br />
• Large untapped, unmarketed potential in the key agricultural crops <strong>of</strong> the area<br />
(paddy, red onion, chilli, potato, tobacco) <strong>and</strong> livestock produce – creating better<br />
market linkages, better utilisation <strong>of</strong> agricultural/farming capacity <strong>and</strong> skills, better<br />
access to micro‐funding/SME loan guarantees etc<br />
• However, aspirations <strong>of</strong> the youth appear to lie in the services industry, not the<br />
agriculture cum fisheries sector<br />
• Having traditionally enjoyed high levels <strong>of</strong> education achievement <strong>and</strong><br />
intellectual capital, are knowledge‐based businesses the way forward for <strong>Jaffna</strong>?<br />
• Immediate need for matching the keen interest among the youth population in<br />
higher education services, skills <strong>and</strong> vocational training, with the provision <strong>of</strong> such<br />
services<br />
• Potent to train a workforce suitable to tap the BPO industry, other knowledgeeconomy<br />
industries<br />
• Meanwhile, building up essential infrastructure <strong>and</strong> create a business friendly<br />
environment – electricity, telecoms, financial services, roads <strong>and</strong> transport<br />
• Innovative measures to attract investment <strong>and</strong> business interest from the displaced<br />
<strong>Jaffna</strong> Diaspora – converting the accumulated financial <strong>and</strong> human capital among<br />
the Diaspora into assets in the development process –as the case in India –<br />
converting the ‘brain drain’ into a ‘brain gain’<br />
• Anecdotal evidence suggests that as much as 75% <strong>of</strong> the Tamils who fled Sri Lanka to<br />
Western countries are from the Northern Province, particularly from the <strong>Jaffna</strong><br />
peninsula<br />
• Formal <strong>and</strong> informal foreign remittances received by <strong>Jaffna</strong> labour might be<br />
creating a disincentive to supplying more labour hours – needs more investigation<br />
• Urgent need to gather data <strong>and</strong> statistics on the region – providing necessary<br />
funding <strong>and</strong> administrative measures to conduct surveys following resettlement<br />
7