Predicting Fault-prone Components in a Java Legacy System
Predicting Fault-prone Components in a Java Legacy System
Predicting Fault-prone Components in a Java Legacy System

You also want an ePaper? Increase the reach of your titles
YUMPU automatically turns print PDFs into web optimized ePapers that Google loves.
<strong>Predict<strong>in</strong>g</strong> <strong>Fault</strong>-<strong>prone</strong> <strong>Components</strong><br />
<strong>in</strong> a <strong>Java</strong> <strong>Legacy</strong> <strong>System</strong><br />
Erik Arisholm § and Lionel C. Briand §‡<br />
§ Simula Research Laboratory<br />
Department of Software Eng<strong>in</strong>eer<strong>in</strong>g<br />
Mart<strong>in</strong> L<strong>in</strong>ges v 17, Fornebu<br />
P.O.Box 134,<br />
1325 Lysaker, Norway<br />
erika@simula.no<br />
ABSTRACT<br />
This paper reports on the construction and validation of fault<strong>prone</strong>ness<br />
prediction models <strong>in</strong> the context of an object-oriented,<br />
evolv<strong>in</strong>g, legacy system. The goal is to help QA eng<strong>in</strong>eers focus<br />
their limited verification resources on parts of the system likely to<br />
conta<strong>in</strong> faults. A number of measures <strong>in</strong>clud<strong>in</strong>g code quality,<br />
class structure, changes <strong>in</strong> class structure, and the history of classlevel<br />
changes and faults are <strong>in</strong>cluded as candidate predictors of<br />
class fault-<strong>prone</strong>ness. A cross-validated classification analysis<br />
shows that the obta<strong>in</strong>ed model has less than 20% of false positives<br />
and false negatives, respectively. However, as shown <strong>in</strong> this<br />
paper, statistics regard<strong>in</strong>g the classification accuracy tend to<br />
<strong>in</strong>flate the potential usefulness of the fault-<strong>prone</strong>ness prediction<br />
models. We thus propose a simple and pragmatic methodology for<br />
assess<strong>in</strong>g the cost-effectiveness of the predictions to focus<br />
verification effort. On the basis of the cost-effectiveness analysis<br />
we show that change and fault data from previous releases is<br />
paramount to develop<strong>in</strong>g a practically useful prediction model.<br />
When our model is applied to predict faults <strong>in</strong> a new release, the<br />
estimated potential sav<strong>in</strong>gs <strong>in</strong> verification effort is about 29%. In<br />
contrast, the estimated sav<strong>in</strong>gs <strong>in</strong> verification effort drops to 0%<br />
when history data is not <strong>in</strong>cluded.<br />
Categories and Subject Descriptors<br />
D.2.8 [Software Eng<strong>in</strong>eer<strong>in</strong>g]: Metrics – process metrics,<br />
product metrics. D.2.9 [Software Eng<strong>in</strong>eer<strong>in</strong>g]: Management –<br />
software quality assurance (SQA).<br />
General Terms<br />
Measurement, Design, Verification.<br />
1. INTRODUCTION<br />
The study presented <strong>in</strong> this paper was motivated by a practical<br />
problem encountered <strong>in</strong> a large telecom company. A large <strong>Java</strong><br />
legacy system was be<strong>in</strong>g ma<strong>in</strong>ta<strong>in</strong>ed and there was a constant<br />
shortage of resources and time for verification (test<strong>in</strong>g,<br />
‡ Carleton University<br />
Department of <strong>System</strong>s and Computer Eng<strong>in</strong>eer<strong>in</strong>g<br />
Software Quality Eng<strong>in</strong>eer<strong>in</strong>g Laboratory<br />
1125 Colonel By Drive<br />
Ottawa, ON K1S5B6, Canada<br />
briand@sce.carleton.ca<br />
<strong>in</strong>spection). The quality assurance eng<strong>in</strong>eers wanted to <strong>in</strong>vestigate<br />
means to focus verification on parts of the system where faults<br />
were more likely to be detected. Though many studies on<br />
predict<strong>in</strong>g fault-<strong>prone</strong> classes on the basis of the structural<br />
properties of object-oriented systems have been reported (Section<br />
5), one specificity of the study presented here is the fact that we<br />
need to predict fault-<strong>prone</strong>ness of a chang<strong>in</strong>g legacy system. We<br />
therefore not only need to account for the structural properties of<br />
classes across the system, but also for changes and fault<br />
corrections on specific releases and their impact on the code,<br />
among a number of factors potentially impact<strong>in</strong>g fault-<strong>prone</strong>ness.<br />
Another <strong>in</strong>terest<strong>in</strong>g issue to be <strong>in</strong>vestigated is related to the fact<br />
that past change and fault data are typically available <strong>in</strong> legacy<br />
systems and such data could be useful to help predict<strong>in</strong>g fault<strong>prone</strong>ness,<br />
e.g., by identify<strong>in</strong>g what subset of classes have shown<br />
to be <strong>in</strong>herently fault <strong>prone</strong> <strong>in</strong> the past.<br />
The legacy system studied is a middleware system serv<strong>in</strong>g the<br />
mobile division <strong>in</strong> a large telecom company. It provides more<br />
than 40 client systems with a consistent view across multiple<br />
back-end systems, and has evolved through 17 major releases<br />
dur<strong>in</strong>g the past seven years. At any time, somewhere between 30<br />
and 60 software eng<strong>in</strong>eers have been <strong>in</strong>volved <strong>in</strong> the project. The<br />
core system consists of about 1700 <strong>Java</strong> classes <strong>in</strong> about 110K<br />
SLOC 1 . The project had used the XRadar system [16] for some<br />
time to monitor the quality of the software as it evolved [11], but<br />
as the system expanded <strong>in</strong> size and complexity, QA eng<strong>in</strong>eers felt<br />
they needed more sophisticated techniques to focus verification<br />
activities on fault-<strong>prone</strong> parts of the system.<br />
This paper will attempt to build a fault-<strong>prone</strong>ness prediction<br />
model for this system and assess not only its accuracy but also its<br />
potential cost-effectiveness to focus verification on future<br />
releases. We will do so us<strong>in</strong>g measures of the history of changes<br />
and faults, code quality, class structure, and changes <strong>in</strong> class<br />
structure. We will discuss the factors that appear to be important<br />
<strong>in</strong>dicators of fault-<strong>prone</strong>ness and expla<strong>in</strong> why that is the case. A<br />
simple and pragmatic methodology for assess<strong>in</strong>g the costeffectiveness<br />
of such fault-<strong>prone</strong>ness models will also be<br />
described and used on our case study.<br />
Note that this paper is the first one that reports on the construction<br />
and validation of fault <strong>prone</strong>ness prediction models <strong>in</strong> the context<br />
of an object-oriented, evolv<strong>in</strong>g, legacy system and that explores <strong>in</strong><br />
1 In addition, the system consists of 1000K SLOC of generated<br />
code, but this code is not considered <strong>in</strong> our study.
this context the issue of cost-effectiveness of us<strong>in</strong>g such models.<br />
We believe this is a crucial issue that is far too rarely addressed.<br />
As shown <strong>in</strong> this paper, results regard<strong>in</strong>g the fault-<strong>prone</strong>ness<br />
classification of components are often mislead<strong>in</strong>g and tend to<br />
<strong>in</strong>flate the potential usefulness of such predictions. The<br />
relationship between our study and related works will be further<br />
discussed <strong>in</strong> Section 5.<br />
The rema<strong>in</strong>der of this paper is organized as follows. Section 2<br />
expla<strong>in</strong>s how we developed the fault-prediction model for the<br />
abovementioned system. Section 3 evaluates the result<strong>in</strong>g<br />
prediction model. Section 4 describes the ma<strong>in</strong> threats to validity.<br />
Section 5 relates our approach and results to exist<strong>in</strong>g research.<br />
Section 6 concludes and outl<strong>in</strong>es directions for future research.<br />
2. METHODOLOGY<br />
2.1 Goal<br />
Our goal is to build a prediction model for the quality assurance<br />
staff to determ<strong>in</strong>e where to focus verification effort <strong>in</strong> one<br />
important legacy, <strong>Java</strong> system. We therefore want to identify fault<br />
<strong>prone</strong> classes which can then be targeted by specific verification<br />
activities. Though many studies have been reported on detect<strong>in</strong>g<br />
fault-<strong>prone</strong> classes <strong>in</strong> object-oriented systems, the specificity of<br />
this work is the legacy nature of the system under study. This has<br />
a number of implications that will be further described below.<br />
2.2 <strong>Fault</strong>-<strong>prone</strong>ness factors<br />
The fundamental hypothesis underly<strong>in</strong>g our work is that the fault<strong>prone</strong>ness<br />
of classes <strong>in</strong> a legacy, object-oriented system can be<br />
affected by the follow<strong>in</strong>g factors:<br />
• the structural characteristics of classes (i.e., their coupl<strong>in</strong>g)<br />
• the amount of change (requirements or fault corrections)<br />
undertaken by the class to obta<strong>in</strong> the current release<br />
• the cod<strong>in</strong>g quality of classes: cod<strong>in</strong>g style and practices,<br />
presence of redundant code<br />
• other, unknown factors that are captured by the fault history<br />
of classes <strong>in</strong> previous releases<br />
• the skills and experience of the <strong>in</strong>dividual perform<strong>in</strong>g the<br />
changes<br />
Furthermore, it is also likely that these factors <strong>in</strong>teract <strong>in</strong> the way<br />
they affect fault-<strong>prone</strong>ness. For example, changes may be more<br />
fault-<strong>prone</strong> on larger, more complex classes. However, there is<br />
little theory we can rely on to help us uncover such <strong>in</strong>teractions<br />
and we will see below how this is addressed <strong>in</strong> our analysis. We<br />
have no data on the skills and experience of developers <strong>in</strong> this<br />
study and therefore the last factor listed above will not be<br />
considered at this po<strong>in</strong>t <strong>in</strong> our analysis.<br />
2.3 Dependent and <strong>in</strong>dependent variables<br />
The dependent variable <strong>in</strong> our analysis is the occurrences of fault<br />
corrections <strong>in</strong> classes of a release. Typically a fault correction<br />
<strong>in</strong>volves several classes and <strong>in</strong> our case, s<strong>in</strong>ce our level of<br />
analysis is at the class level, we count the number of times a<br />
dist<strong>in</strong>ct fault correction was required <strong>in</strong> that class for develop<strong>in</strong>g a<br />
given release. This aims at captur<strong>in</strong>g the fault-<strong>prone</strong>ness of a<br />
class.<br />
The <strong>in</strong>dependent variables are summarized <strong>in</strong> Table 1 and attempt<br />
to measure the factors <strong>in</strong> Section 2.2. They <strong>in</strong>clude various<br />
measures of class size, <strong>in</strong>heritance, coupl<strong>in</strong>g, and cohesion. These<br />
were captured on each release us<strong>in</strong>g two code analyzers: XRadar<br />
[16] and JHawk [10]. In addition, measures captur<strong>in</strong>g the level of<br />
redundancy <strong>in</strong> the code, conformance to desirable cod<strong>in</strong>g<br />
practices and cod<strong>in</strong>g style have been captured us<strong>in</strong>g the XRadar<br />
system. Note that some of the variable names <strong>in</strong> Table 1 are not<br />
follow<strong>in</strong>g standard term<strong>in</strong>ology (e.g., LOC, which refers to<br />
number of local methods). However, this is how the variables are<br />
def<strong>in</strong>ed <strong>in</strong> the tools, and we decided to keep the names to<br />
facilitate replications <strong>in</strong> future studies that might use the same<br />
tools.<br />
In addition, for each class, we capture the number of requirement<br />
changes and fault corrections performed on release n-1 that were<br />
required to obta<strong>in</strong> the current release n. The amount of change<br />
across classes <strong>in</strong> release n-1 is expected to affect the likelihood of<br />
fault corrections <strong>in</strong> release n.<br />
Ideally, we would also want to measure the size of changes and<br />
fault corrections, for example <strong>in</strong> terms of l<strong>in</strong>es of code changed,<br />
deleted, and added. However, because this data could not easily<br />
be obta<strong>in</strong>ed, we use surrogate measures that compute the variation<br />
<strong>in</strong> coupl<strong>in</strong>g, cohesion, and size measures between release n and n-<br />
1. These measures aim at captur<strong>in</strong>g the size of change undergone<br />
by each class to build release n.<br />
We also thought that history data, tell<strong>in</strong>g us about requirement<br />
changes and fault corrections <strong>in</strong> previous releases might be useful<br />
as they would tell us about the <strong>in</strong>herent fault-<strong>prone</strong>ness and<br />
change-<strong>prone</strong>ness of classes <strong>in</strong> past releases. This type of data is<br />
usually available for legacy systems as there is usually a long<br />
history of changes and fault corrections for most classes <strong>in</strong> a<br />
release. In this paper, due to the current limitations of our data, we<br />
cannot look further back than release n-2.<br />
Last, we also collect <strong>in</strong>formation on the number of releases <strong>in</strong><br />
which the class had been present, assum<strong>in</strong>g that older classes<br />
were more stable and less likely to conta<strong>in</strong> faults than newer<br />
classes.<br />
2.4 Assumptions and caveats<br />
Our analysis strategies and the <strong>in</strong>dependent variables we have<br />
def<strong>in</strong>ed above assume that most of the faults corrected <strong>in</strong> a release<br />
n are related to changes and code characteristics of release n-1<br />
and to a lesser extent n-2. This is, however, not true <strong>in</strong> general<br />
and it would have been desirable to obta<strong>in</strong> precise <strong>in</strong>formation<br />
regard<strong>in</strong>g the cause-effect relationships between changes and fault<br />
corrections. However, this assumption was deemed reasonable<br />
based on our discussion with developers and more precise<br />
<strong>in</strong>formation was impossible to obta<strong>in</strong> at the time of writ<strong>in</strong>g. This<br />
assumption may, however, affect the ability of our model to<br />
accurately predict fault-<strong>prone</strong> classes.<br />
2.5 Design of the study<br />
Recall that we model the probability of a fault correction <strong>in</strong> a<br />
class as a function of the <strong>in</strong>dependent variables mentioned above.<br />
Class fault-<strong>prone</strong>ness <strong>in</strong> release n is therefore modeled as the<br />
probability that a given class will undergo a fault correction <strong>in</strong><br />
release n+1.
Table 1. Summary of the <strong>in</strong>dependent variables <strong>in</strong> the study<br />
Variable Description Source<br />
Violations Number of violations <strong>in</strong> the code, e.g., "X def<strong>in</strong>ed but not used" XRadar<br />
Duplications Number of “copy+paste” duplication segments <strong>in</strong> the code XRadar<br />
StyleErrors Number of cod<strong>in</strong>g style errors, e.g., "L<strong>in</strong>e is longer than 80 characters" XRadar<br />
Functions Number of implemented methods <strong>in</strong> a class XRadar<br />
Ncss Number of non-commentary source statements (SLOC) XRadar<br />
<strong>Java</strong>docs Number of formal <strong>Java</strong>doc comments XRadar<br />
Ccn Cyclomatic complexity XRadar<br />
LCOM Lack of Cohesion JHawk<br />
EXT Number of external methods called JHawk<br />
HIER Number of methods called <strong>in</strong> class hierarchy JHawk<br />
LOC Number of local methods called JHawk<br />
INST Number of <strong>in</strong>stance variables JHawk<br />
MOD Number of modifiers, i.e., the number of methods that can change the objects’ state JHawk<br />
INTR Number of <strong>in</strong>terfaces implemented JHawk<br />
PACK Number of packages imported JHawk<br />
RFC Response for a class JHawk<br />
MPC Message pass<strong>in</strong>g coupl<strong>in</strong>g JHawk<br />
FIN The sum of the number of unique methods that call the methods <strong>in</strong> the class JHawk<br />
FOUT Number of dist<strong>in</strong>ct non-<strong>in</strong>heritance related classes on which a class depends (CBO) JHawk<br />
NSUP Number of superclasses JHawk<br />
NSUB Number of subclasses JHawk<br />
dLCOM Abs(LCOM(n)-LCOM(n-1)) JHawk<br />
dLOC Abs(LOC(n)-LOC(n-1)) JHawk<br />
dMOD Abs(MOD(n)-MOD(n-1)) JHawk<br />
dFOUT Abs(FOUT(n)-FOUT(n-1)) JHawk<br />
dNSUP Abs(NSUP(n)-NSUP(n-1)) JHawk<br />
dNSUB Abs(NSUB(n)-NSUB(n-1)) JHawk<br />
<strong>Fault</strong>Corrections Number of faults corrected <strong>in</strong> release n-1 to build release n Release Data<br />
ChangeCount Number of requirement changes <strong>in</strong> release n-1 to build release n Release Data<br />
PrevVersionCount Number of releases <strong>in</strong> which the class has been present before release n Release Data<br />
n1<strong>Fault</strong>Corrections Number of faults corrected <strong>in</strong> release n-2 to build release n-1 Release Data<br />
n1ChangeCount Number of requirement changes <strong>in</strong> release n-2 to build release n-1 Release Data<br />
We use logistic regression [6] to derive an optimal prediction<br />
model from the available data. More precisely, we have four<br />
releases (denoted R1 to R4) on which we collected fault and<br />
change data. We build a prediction model with R3 fault<br />
corrections as the dependent variable and R2 measurements<br />
(<strong>in</strong>clud<strong>in</strong>g number of requirement changes and fault corrections,<br />
code measures and structural change measures s<strong>in</strong>ce R1) plus the<br />
change and fault history of R1 as the <strong>in</strong>dependent variables. Then<br />
the model is applied to predict R4 fault corrections, us<strong>in</strong>g R3<br />
measurements (<strong>in</strong>clud<strong>in</strong>g number of requirement changes and<br />
fault corrections, code measures and structural change measures<br />
s<strong>in</strong>ce R2) plus the change and fault history of R2 as the predictor<br />
variables. The rationale is that we want not only to see how well<br />
such a model can fit our data (on R3) but we also want to<br />
determ<strong>in</strong>e how well it can predict the future (R4) and help focus<br />
verification on future releases.<br />
2.6 Data analysis<br />
Many of our <strong>in</strong>dependent variables have distributions skewed to<br />
the right, with a number of extreme values. Because regression is<br />
<strong>in</strong> general sensitive to outliers (e.g., very large values), we<br />
perform a logarithm transformation of <strong>in</strong>dependent variables 2 <strong>in</strong><br />
order to obta<strong>in</strong> less skewed distributions [6]. This has also the<br />
advantage to account for <strong>in</strong>teractions between variables without<br />
hav<strong>in</strong>g to explicitly specify them 3 , an important issue <strong>in</strong> our<br />
context where we know <strong>in</strong>teractions to be plausible but difficult to<br />
predict beforehand.<br />
2 x’ = ln (x+1). We refer to these variables as log-transformed<br />
<strong>in</strong>dependent variables.<br />
3 a ln x1 + b ln x2 + c ln x1x2 = (a+c) ln x1 + (b+c) ln x2
Follow<strong>in</strong>g a common analysis procedure [2], we perform a<br />
Pr<strong>in</strong>cipal Component Analysis (PCA) to identify the dimensions<br />
actually present <strong>in</strong> the data (for release R2) and to help us<br />
<strong>in</strong>terpret subsequent results. We then use logistic regression to<br />
perform a univariate analysis of each <strong>in</strong>dependent variable to<br />
identify which ones are significant predictors of fault-<strong>prone</strong>ness<br />
(fault corrections to build release R3) and whether their<br />
relationship is <strong>in</strong> the expected direction. This allows us to check<br />
whether our <strong>in</strong>itial hypotheses are supported. The next step is then<br />
to build a multivariate prediction model, us<strong>in</strong>g stepwise logistic<br />
regression, <strong>in</strong> order to predict class fault-<strong>prone</strong>ness us<strong>in</strong>g all<br />
available measures 4 . Note that <strong>in</strong> order to obta<strong>in</strong> a balanced<br />
model for both faulty and non-faulty classes, we randomly extract<br />
a subset of non-faulty classes of identical size to the number of<br />
faulty classes. This is necessary <strong>in</strong> order to avoid bias<strong>in</strong>g the fitted<br />
model towards non-faulty classes as those typically represent the<br />
vast majority of classes <strong>in</strong> a release 5 . We thus obta<strong>in</strong> a total of 82<br />
observations to build the model. The goodness of fit of the model<br />
is then assessed by comput<strong>in</strong>g the percentage of false positives<br />
and false negatives when us<strong>in</strong>g it to classify classes <strong>in</strong> the<br />
model<strong>in</strong>g dataset as fault-<strong>prone</strong> or not. To get a more realistic<br />
result of what classification accuracy to expect on other datasets,<br />
we perform the same assessment aga<strong>in</strong> but us<strong>in</strong>g a Leave-one-out<br />
cross validation procedure [6].<br />
We then apply the multivariate model to determ<strong>in</strong>e how well it<br />
can predict the fault corrections (to build release R4), now<br />
<strong>in</strong>clud<strong>in</strong>g all 1758 observations. This step of our analysis is<br />
related to assess<strong>in</strong>g the cost-effectiveness of us<strong>in</strong>g the prediction<br />
model that was built. Typically, fault-<strong>prone</strong>ness models are found<br />
useful to focus verification activities, such as test<strong>in</strong>g and<br />
<strong>in</strong>spections, on parts of a large system. The acceptance criteria for<br />
test<strong>in</strong>g (e.g., control flow coverage) may, for example, be more<br />
demand<strong>in</strong>g for parts predicted as fault-<strong>prone</strong>. Regardless of the<br />
details of its application, the cost-benefit of us<strong>in</strong>g such a<br />
prediction model to focus verification decreases as fault-<strong>prone</strong><br />
parts represent an <strong>in</strong>creas<strong>in</strong>gly larger part of the system and<br />
conta<strong>in</strong> a lower percentage of the faults. Therefore, we will<br />
<strong>in</strong>vestigate the percentage of classes, functions, and l<strong>in</strong>es of code<br />
classified as fault-<strong>prone</strong> and the relationship of such percentages<br />
to the percentage of faults conta<strong>in</strong>ed <strong>in</strong> these artifacts. These<br />
faults represent the fault subset that can potentially be detected by<br />
additional verification activities target<strong>in</strong>g fault-<strong>prone</strong> components.<br />
3. RESULTS<br />
3.1 Pr<strong>in</strong>cipal Component Analysis<br />
A Pr<strong>in</strong>cipal Component Analysis (PCA) shows that the data<br />
captures a number of dist<strong>in</strong>ct dimensions (pr<strong>in</strong>cipal components<br />
or PCs) which is far lower than the number of <strong>in</strong>dependent<br />
variables considered, given the criterion of an eigenvalue above<br />
4 We do not make use of PCA to select a subset of <strong>in</strong>dependent<br />
variables s<strong>in</strong>ce, as discussed <strong>in</strong> [2], experience has shown this<br />
usually leads to suboptimal prediction models, though<br />
regression coefficients are easier to <strong>in</strong>terpret.<br />
5<br />
In the univariate case, we also tried an alternative (and<br />
computationally expensive) approach known as exact logistic<br />
regression [9], which computes unbiased coefficients even with<br />
sparse or skewed data sets. With our data, the differences<br />
between the two approaches are negligible.<br />
1.0 to determ<strong>in</strong>e the number of components. That type of<br />
redundancy <strong>in</strong> software eng<strong>in</strong>eer<strong>in</strong>g data is very common [2] and<br />
needs to be identified to better <strong>in</strong>terpret the results of our study.<br />
PCA is performed here on the log-transformed variables which<br />
are used as <strong>in</strong>dependent variables, and then rotated us<strong>in</strong>g the<br />
VariMax rotation to facilitate the <strong>in</strong>terpretation. The raw PCA<br />
results are provided <strong>in</strong> Appendix A. The PCs can be described as<br />
follows:<br />
• PC1: The first pr<strong>in</strong>cipal component mostly captures class<br />
size (e.g., <strong>in</strong> terms of methods, l<strong>in</strong>e of code, control flow<br />
complexity) and import coupl<strong>in</strong>g from other classes (e.g.<br />
PACK, RFC, MPC, EXT, FOUT), which is <strong>in</strong> most studies<br />
associated with size [2]. Violations, Duplications, and<br />
StyleErrors are also part of this PC. So is dLOC, <strong>in</strong>dicat<strong>in</strong>g<br />
that the amount of change <strong>in</strong> local methods called is related<br />
to class size. ChangeCount and n1ChangeCount are also part<br />
of this PC, due probably to the strong impact of class size on<br />
the likelihood of a class to undergo change. We note that<br />
<strong>Fault</strong>Corrections and n1<strong>Fault</strong>Corrections do not load above<br />
0.5 on any of the components, but seem to be partly related<br />
to PC1, <strong>in</strong>dicat<strong>in</strong>g that fault <strong>prone</strong>ness is related to class size<br />
but also other dimensions (PC6).<br />
• PC2: The number of releases <strong>in</strong> which the class has been<br />
present (PrevVersionCount), plus a number of structural<br />
change measures (dLCOM, dFOUT, dMOD) we collect to<br />
assess the impact of change from one release to the next on<br />
class structure. This is to be expected as, <strong>in</strong> our data, older<br />
classes tend to be much more stable and show less structural<br />
change.<br />
• PC3: Cohesion (LCOM) and number of <strong>in</strong>stance variables<br />
(INST), as classes with large numbers of <strong>in</strong>stance variables<br />
tend to have lower LCOM values.<br />
• PC4: The sum of the number of unique methods that call the<br />
methods <strong>in</strong> the class (FIN)<br />
• PC5: The number of ancestors classes (NSUP) and its change<br />
(dNSUP). This <strong>in</strong>dicates a shallow <strong>in</strong>heritance hierarchy <strong>in</strong><br />
the system, and that the classes are seldom moved with<strong>in</strong> an<br />
<strong>in</strong>heritance hierarchy (both are close to zero).<br />
• PC6: The number of modifier methods (MOD) (and to some<br />
extent, <strong>Fault</strong>Corrections)<br />
• PC7: The number of descendent classes (NSUB) and its<br />
change (dNSUB). As for PC5, this <strong>in</strong>dicates a shallow<br />
<strong>in</strong>heritance hierarchy, and that the classes are seldom moved<br />
with<strong>in</strong> an <strong>in</strong>heritance hierarchy (both are close to zero).<br />
• PC8: Number of methods called <strong>in</strong> class hierarchy (HIER)<br />
3.2 Univariate Analysis<br />
From Table 2 we can see that code quality measures (violations,<br />
duplication, and style errors) are all significantly related to the<br />
probability of fault correction (p-value < 0.05) and the<br />
relationship is <strong>in</strong> the expected direction: poor code quality leads<br />
to <strong>in</strong>creased probability of correction (odds-ratio 6 > 1).<br />
6 It is the number by which we would multiply the odds for a class<br />
to conta<strong>in</strong> a fault for each one-unit <strong>in</strong>crease <strong>in</strong> the <strong>in</strong>dependent
Table 2. Summary of univariate results<br />
Variable Odds-ratio p-value<br />
Violations 1.8 0.0037<br />
Duplications 2.8 0.0101<br />
StyleErrors 1.4 0.0387<br />
Functions 3.2 0.0001<br />
Ncss 3.1
Y<br />
50<br />
40<br />
30<br />
20<br />
10<br />
0<br />
Y<br />
0 .25 .5 .75 1<br />
CutOff<br />
FalsePos<br />
FalseNeg<br />
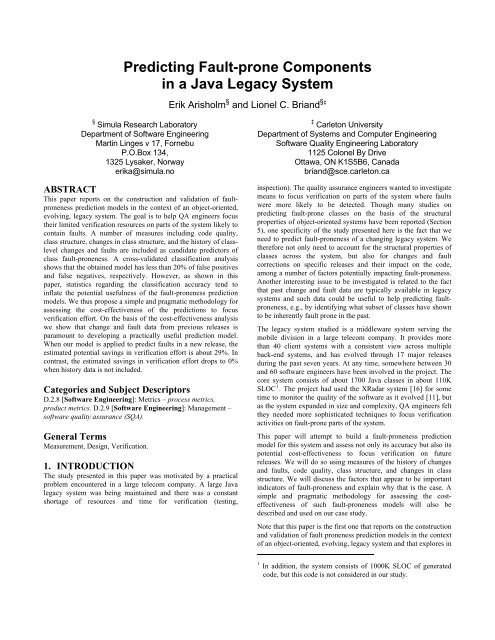
Figure 2. Leave-one-out cross validation false positives and<br />
false negatives on release R3<br />
variables and this probably expla<strong>in</strong>s such a result. A number of<br />
code measures are thus selected regard<strong>in</strong>g <strong>in</strong>heritance (NSUP,<br />
NSUB, HIER) and cohesion (LCOM). Furthermore, variables<br />
captur<strong>in</strong>g change and error history before the development of the<br />
analyzed release (n1ChangeCount, n1<strong>Fault</strong>Corrections) are also<br />
selected.<br />
There are many ways to look at the goodness of fit of a logistic<br />
regression model [6]. One practical way is to use the probability<br />
predictions of the model to classify classes as faulty or not and<br />
check the false positives and false negatives. This is illustrated <strong>in</strong><br />
Figure 1 for different probability thresholds. We can see that<br />
when us<strong>in</strong>g a balanced probability threshold value for<br />
classification (around 0.5), we have less than 9% and 5% of false<br />
positives and false negatives, respectively. In other words, when<br />
predict<strong>in</strong>g classes as fault-<strong>prone</strong> there is a 9% chance of be<strong>in</strong>g<br />
wrong and waste verification resources. Similarly, there is a 5%<br />
chance of miss<strong>in</strong>g a faulty class and not detect the faults it<br />
conta<strong>in</strong>s.<br />
In order to obta<strong>in</strong> a more realistic assessment of the fault<strong>prone</strong>ness<br />
prediction accuracy, we use a Leave-one-out cross<br />
validation procedure, leav<strong>in</strong>g one observation out and build<strong>in</strong>g a<br />
model on the rema<strong>in</strong><strong>in</strong>g observations, do<strong>in</strong>g so iteratively for all<br />
observations. From Figure 2, we can see that when us<strong>in</strong>g a<br />
balanced threshold value (around 0.5), we have less than 20% of<br />
false positives and false negatives, respectively. This is a sharp<br />
<strong>in</strong>crease compared to Figure 1 but the results are still reasonably<br />
accurate.<br />
3.4 Cost-Benefit Analysis<br />
The cross validation results presented above provide <strong>in</strong>sights on<br />
the accuracy of our fault-<strong>prone</strong>ness models if all releases were<br />
alike <strong>in</strong> terms of change process, changes, personnel, and so on.<br />
However, we know this is never the case. In this case study, we<br />
were <strong>in</strong>formed that process changes were tak<strong>in</strong>g place across<br />
releases. So, from a practical perspective we wanted to answer the<br />
follow<strong>in</strong>g questions:<br />
• how useful is such a prediction model when predict<strong>in</strong>g future<br />
releases?<br />
• what is the cost-benefit of us<strong>in</strong>g such a model to focus<br />
verification?<br />
We built a prediction model us<strong>in</strong>g R3 fault corrections as<br />
dependent variable and R2 data for the <strong>in</strong>dependent variables.<br />
Then we applied the model to predict R4, the latest release for<br />
which we have fault correction data. S<strong>in</strong>ce we are look<strong>in</strong>g at ways<br />
to get <strong>in</strong>sights <strong>in</strong>to the cost-effectiveness of us<strong>in</strong>g such model we<br />
have to def<strong>in</strong>e surrogates measures for verification cost.<br />
Depend<strong>in</strong>g on the specific verification undertaken on classes<br />
predicted as fault <strong>prone</strong>, one may want to use a different size<br />
measure that would be proportional to the cost of verification. In<br />
Figure 3, we plot the number of classes predicted as fault <strong>prone</strong> as<br />
well as the cumulative number of l<strong>in</strong>es of code (Ncss), methods<br />
(Functions), and control flow complexity (Ccn) they conta<strong>in</strong>. We<br />
compute this for different threshold probability cutoff values, as<br />
for the computation of false positives and false negatives. From<br />
Figure 3 we can see that at a cutoff value of 0.5, more than 70%<br />
of the faults are found <strong>in</strong> less than 30% of the classes. Those<br />
classes, however, represent roughly 50% of the l<strong>in</strong>es of code,<br />
control flow complexity, and methods. So depend<strong>in</strong>g on whether<br />
you <strong>in</strong>tend to apply, for example, test criteria such as Block<br />
coverage, Edge coverage, or simply <strong>in</strong>spect class <strong>in</strong>terfaces [15],<br />
one may want to use a different size measure that is a proper<br />
surrogate of the effort of a specific verification activity. In our<br />
case the measurement happens to be very consistent for all our<br />
size measures, except the number of classes which shows lower<br />
percentages. This is not surpris<strong>in</strong>g as larger classes tend to be<br />
more fault-<strong>prone</strong> than smaller classes.<br />
Go<strong>in</strong>g back to our example, assum<strong>in</strong>g the number of l<strong>in</strong>es of code<br />
is an appropriate size measure that is proportional to the<br />
verification effort of the predicted fault-<strong>prone</strong> classes, a random<br />
selection of classes on which to apply a specific verification<br />
strategy (e.g., test or <strong>in</strong>spection) would require the verification of<br />
70% of the code to detect a maximum of 70% of the faults. Us<strong>in</strong>g<br />
our model we br<strong>in</strong>g this percentage down to 50% of the code, thus<br />
potentially reduc<strong>in</strong>g the verification effort by 29%. An alternative<br />
to us<strong>in</strong>g a model would be to ask the ma<strong>in</strong>ta<strong>in</strong>ers of the system to<br />
subjectively select classes to verify. However, <strong>in</strong> the context<br />
where this study took place, no ma<strong>in</strong>ta<strong>in</strong>er seems to have the<br />
adequate overview of the system and release changes to order or<br />
classify parts of the system accord<strong>in</strong>g to their fault-<strong>prone</strong>ness. We<br />
believe that this is a common problem when the system be<strong>in</strong>g<br />
ma<strong>in</strong>ta<strong>in</strong>ed is large and <strong>in</strong>volve a large number of developers.<br />
In order to assess the results presented above, we should compare<br />
them aga<strong>in</strong>st a basel<strong>in</strong>e captur<strong>in</strong>g the best we could achieve. In<br />
release R4, fault-<strong>prone</strong> classes represent 13% of the l<strong>in</strong>es of code.<br />
We therefore see that, despite the estimated potential sav<strong>in</strong>gs <strong>in</strong><br />
verification effort, there exists substantial room for improvement<br />
<strong>in</strong> our prediction model.<br />
As discussed above, a specificity of legacy systems is that we<br />
have access to change and fault history data from previous<br />
releases. When predict<strong>in</strong>g the fault-<strong>prone</strong>ness of a given release<br />
we can attempt to make use of change and fault data from past<br />
releases to improve our models. As discussed <strong>in</strong> 3.3, recall that
1<br />
0.75<br />
1<br />
0.75<br />
1<br />
Y<br />
0.5<br />
Cost Effectiveness Area<br />
Y<br />
0.5<br />
2<br />
0.25<br />
0.25<br />
0<br />
0<br />
0 .25 .5 .75 1<br />
cutoff<br />
0 .25 .5 .75 1<br />
cutoff<br />
Figure 3. Cost-effectiveness of fault-<strong>prone</strong>ness prediction<br />
model<br />
two covariates captur<strong>in</strong>g fault corrections and changes <strong>in</strong> release<br />
R1 were selected <strong>in</strong> the prediction model along with other<br />
<strong>in</strong>dependent variables based on R2 data. Now an <strong>in</strong>terest<strong>in</strong>g,<br />
practical question is to determ<strong>in</strong>e how important such history data<br />
is for build<strong>in</strong>g prediction models for legacy systems <strong>in</strong> terms of<br />
cost-effectiveness. Though our history data here is limited to one<br />
past release (R1), what is the consequence of not us<strong>in</strong>g such<br />
<strong>in</strong>formation? Answer<strong>in</strong>g such a question could help us provide<br />
practical advice to practitioners regard<strong>in</strong>g whether to collect and<br />
use such history data to build similar prediction models. Figure 4<br />
shows the same cost-effectiveness curves as <strong>in</strong> Figure 3 but on a<br />
basis of build<strong>in</strong>g a model without history data. From this figure,<br />
the results clearly show that the size curves (except for the class<br />
percentage curve, for reasons already discussed above) across<br />
different thresholds are not very much above (and often below)<br />
the model fault percentage curve. Based on the assumptions listed<br />
earlier, this implies that such a model is not likely to be of<br />
practical usefulness as its cost-effectiveness to drive verification<br />
is questionable. Though additional studies with longer fault and<br />
change history are needed, it seems of practical importance to<br />
exploit such history data to build high cost-effectiveness<br />
prediction models.<br />
For the sake of compar<strong>in</strong>g the cost-effectiveness of models, it<br />
would be convenient to have an assessment that is <strong>in</strong>dependent<br />
from a specific probability threshold. This can be achieved by<br />
comput<strong>in</strong>g the surface area between the <strong>Fault</strong> correction curve<br />
and any appropriate size curve (e.g., Ncss) across probability<br />
thresholds. For example, <strong>in</strong> Figure 3, the area labeled “Cost<br />
Effectiveness Area” would quantify the cost effectiveness of our<br />
model <strong>in</strong> a way that can be easily compared to other models. The<br />
larger this area, the more cost-effective the fault-<strong>prone</strong>ness model<br />
across thresholds. From Figure 4, we can see that the fault<br />
correction and Ccn curves cross each other at threshold 0.5. In<br />
general, when a size curve lies above the fault correction curve,<br />
the surface area should count negatively towards costeffectiveness<br />
(area “2” <strong>in</strong> Figure 4) whereas when it lies below<br />
the fault correction curves (area “1” <strong>in</strong> Figure 4), then there is a<br />
positive contribution.<br />
Figure 4. Cost-effectiveness of fault-<strong>prone</strong>ness prediction<br />
model, without historical data<br />
4. THREATS TO VALIDITY<br />
The design of case studies is complex and many issues may affect<br />
the validity of results [17]. Construct validity concerns<br />
establish<strong>in</strong>g correct operational measures for the concepts be<strong>in</strong>g<br />
studied. Many of our <strong>in</strong>dependent variables are structural<br />
measures collected us<strong>in</strong>g the XRadar and JHawk tools. The<br />
descriptions of the measures as provided <strong>in</strong> the tools are very<br />
<strong>in</strong>formal and not sufficiently precise to determ<strong>in</strong>e exactly how the<br />
tools collect the measures, which would be important to provide<br />
an accurate assessment of their construct validity, as advocated <strong>in</strong><br />
[3], for example. In any case, the repeatability of the<br />
measurements, also referred to as reliability <strong>in</strong> [17], is probably<br />
more important than construct validity <strong>in</strong> our case, as the goal is<br />
to build a prediction model rather than discover<strong>in</strong>g cause-effect<br />
relationships.<br />
The change and fault data <strong>in</strong> this study are related to the number<br />
of changes and number of faults corrected at the class-level <strong>in</strong> a<br />
given release. The reliability of the measures depends on how<br />
consistently the developers reported changes and fault corrections<br />
<strong>in</strong> their configuration management system. Due to the extensive<br />
use of the XRadar system <strong>in</strong> the releases be<strong>in</strong>g studied and due to<br />
the efforts of a dedicated release manager [11], we have good<br />
reasons to believe that the reported data are fairly accurate.<br />
However, some classes changed names or package location from<br />
release to release, and <strong>in</strong> such cases history data was lost. We<br />
expect to fix this problem <strong>in</strong> the future and thus improve our<br />
predictions.<br />
There is no concept of fault severity <strong>in</strong> our models, and such a<br />
dist<strong>in</strong>ction would be important to improve the value of the<br />
prediction model [1]. It also concerns both <strong>in</strong>ternal validity and<br />
external validity, as the distribution of fault severity may change<br />
over time <strong>in</strong> the given project, and may be entirely different <strong>in</strong><br />
other projects, respectively. Future prediction models should thus<br />
account for the severity of faults.<br />
5. RELATED WORK<br />
There is a lot of research on fault-<strong>prone</strong>ness models <strong>in</strong> OO<br />
systems. A survey is provided <strong>in</strong> [2]. In summary, structural
properties of software, such as cyclomatic complexity or<br />
coupl<strong>in</strong>g, do seem to have an impact on fault <strong>prone</strong>ness. Due to<br />
space constra<strong>in</strong>ts, the rema<strong>in</strong>der of this section focuses on<br />
provid<strong>in</strong>g an <strong>in</strong>-depth discussion of research that has attempted to<br />
build fault-<strong>prone</strong>ness prediction models <strong>in</strong> the context of evolv<strong>in</strong>g<br />
software systems for which change and/or fault history data were<br />
available.<br />
Instead of us<strong>in</strong>g product measures such as l<strong>in</strong>es of code or<br />
cyclomatic complexity, one study took a slightly different<br />
approach, and attempted to build change risk prediction models<br />
on the basis of simple change data [12]. The results suggest that<br />
the risk of perform<strong>in</strong>g a given change, <strong>in</strong> the sense that the change<br />
will cause a future software failure, can be successfully modeled<br />
on the basis of simple change measures such as the size, duration,<br />
diffusion and type of change. The f<strong>in</strong>al risk prediction model also<br />
<strong>in</strong>cluded developer experience (measured as the number of deltas<br />
previously performed by a given developer on the system before<br />
the given change) as a covariate.<br />
A study on fault <strong>prone</strong>ness prediction <strong>in</strong> a large, evolv<strong>in</strong>g system<br />
was reported <strong>in</strong> [13]. The dependent variable was the modulelevel<br />
cumulative number of faults (from the <strong>in</strong>itial build to the last<br />
build). The <strong>in</strong>dependent variables were based on 12 different size<br />
and control-flow measures, but the measures were not used<br />
directly. Instead, pr<strong>in</strong>cipal component regression [6] was<br />
performed. More specifically, the 12 <strong>in</strong>itial measures were<br />
transformed <strong>in</strong>to three new variables on the basis of three<br />
identified pr<strong>in</strong>cipal components. The advantage of such an<br />
approach is that the derived measures are uncorrelated, which <strong>in</strong><br />
turn makes it simpler to <strong>in</strong>terpret the <strong>in</strong>dividual contribution of<br />
each measure. But as previously discussed, the drawback is that it<br />
often leads to suboptimal prediction models [2].<br />
F<strong>in</strong>ally, for each of the three variables, the sum (across all builds)<br />
of the absolute values of the differences between all pairs of<br />
successive builds was computed. These sums of differences,<br />
denoted as code churn <strong>in</strong> [13], formed the <strong>in</strong>dependent variables.<br />
The first <strong>in</strong>dependent variable (ma<strong>in</strong>ly represent<strong>in</strong>g size changes<br />
<strong>in</strong> the modules across the builds) was found to be a significant<br />
predictor of the cumulative number of faults <strong>in</strong> a module. The<br />
result<strong>in</strong>g multiple pr<strong>in</strong>cipal regression model had an adjusted R-<br />
Sq [6] equal to 0.61, suggest<strong>in</strong>g that the model potentially could<br />
have practical value as a management tool to help identify fault<strong>prone</strong><br />
modules. There are several similarities and differences<br />
between the study reported <strong>in</strong> [13] and our paper. The code churn<br />
measures <strong>in</strong> [13] are similar to the structural change measures<br />
used as candidate <strong>in</strong>dependent variables <strong>in</strong> this paper (e.g,<br />
dLCOM), although we used the changes <strong>in</strong> the <strong>in</strong>dividual<br />
measures s<strong>in</strong>ce the previous release <strong>in</strong>stead of the cumulative<br />
changes <strong>in</strong> the pr<strong>in</strong>cipal component-based measures as<br />
<strong>in</strong>dependent variables. Thus the results are difficult to compare<br />
directly. However, two of the structural change measures (dLOC<br />
and dFOUT) were significant <strong>in</strong> the univariate case (Table 2),<br />
suggest<strong>in</strong>g that changes <strong>in</strong> structural properties do affect fault<br />
<strong>prone</strong>ness, thus confirm<strong>in</strong>g results <strong>in</strong> [13]. However, they were<br />
not significant <strong>in</strong> the multiple regression model (Table 3), that is,<br />
when also account<strong>in</strong>g for other measures such as the structural<br />
properties (<strong>in</strong> release n) and change and fault history, <strong>in</strong> which<br />
case the measures of structural change no longer seem to be<br />
significant predictors of fault-<strong>prone</strong>ness <strong>in</strong> our case. No attempts<br />
was made to perform a cross-validation or evaluate the costbenefits<br />
of the model on new releases <strong>in</strong> [13], so no further direct<br />
comparisons of the two studies are possible.<br />
A study of fault-<strong>prone</strong>ness <strong>in</strong> a very large and long-lived software<br />
system was reported <strong>in</strong> [7]. The dependent variable was the<br />
number of fault <strong>in</strong>cidences with<strong>in</strong> a two-year period. The<br />
<strong>in</strong>dependent variables consisted of various product and process<br />
measures collected from repositories just before that two-year<br />
period. The product measures <strong>in</strong>cluded module-level size and<br />
complexity measures, e.g., l<strong>in</strong>es of code and cyclomatic<br />
complexity. The process measures <strong>in</strong>cluded the number of past<br />
faults <strong>in</strong> a module, the number of changes or deltas to a module<br />
over its entire history, and the age of the code. Thus, the variables<br />
used <strong>in</strong> [7] are similar <strong>in</strong> type to the ones used <strong>in</strong> our study.<br />
However, the goals were different as the ma<strong>in</strong> focus <strong>in</strong> [7] was to<br />
identify the reasons for faults whereas the ma<strong>in</strong> goal <strong>in</strong> this paper<br />
is to build an optimal prediction model. This has an impact on the<br />
type of statistical analyses performed. For example, [7] did not<br />
attempt to evaluate the accuracy or cost-effectiveness of the<br />
obta<strong>in</strong>ed models by apply<strong>in</strong>g them to predict future faults, though<br />
this was vital <strong>in</strong> our case. Despite the differences, a very<br />
important result <strong>in</strong> [7] was that process measures based on the<br />
change and fault history were much better explanatory variables<br />
of the faults than were the product measures. This is supported by<br />
a study reported <strong>in</strong> [18], which among others concludes that<br />
modules with large numbers of faults <strong>in</strong> the past are likely to also<br />
conta<strong>in</strong> faults <strong>in</strong> the future. As can be seen when compar<strong>in</strong>g<br />
Figure 3 and Figure 4, our results support the conclusions <strong>in</strong> [7,<br />
18] <strong>in</strong> the context of predict<strong>in</strong>g future faults. The <strong>in</strong>clusion of<br />
change and fault history data is essential <strong>in</strong> order to build<br />
practically useful fault-<strong>prone</strong>ness prediction models for evolv<strong>in</strong>g<br />
legacy-systems. In [7], the best model was a so-called weighted<br />
time damp model, which allowed different weight to the change<br />
history data, depend<strong>in</strong>g on how old the changes were. The impact<br />
of changes on fault-<strong>prone</strong>ness was downweighed by a factor of<br />
about 50 percent per year. In our case, the history data available<br />
to build our prediction model was only based on the two prior<br />
releases, so it was feasible to simply assign time-related weights<br />
by hav<strong>in</strong>g different coefficients for n1ChangeCount,<br />
n1<strong>Fault</strong>Corrections, ChangeCount and <strong>Fault</strong>Corrections,<br />
respectively.<br />
In [14], a case study on model<strong>in</strong>g fault-<strong>prone</strong>ness over a sequence<br />
of four releases was presented. The system was composed of 800<br />
KLOC of C code. The data was based on change reports as no<br />
design or code was available to the researchers. The <strong>in</strong>dependent<br />
variables thus only <strong>in</strong>cluded measures such as the number of<br />
times a component was changed together with other components,<br />
number of files fixed <strong>in</strong> a given component and the number of<br />
l<strong>in</strong>es of code added and deleted <strong>in</strong> a component, for a given<br />
release. A component was def<strong>in</strong>ed as a collection of files <strong>in</strong> the<br />
same directory, and it was assumed that the directory structure<br />
reflected the functional architecture. The relative size of the<br />
directories was not known. The components <strong>in</strong> the system were<br />
classified as fault-<strong>prone</strong> if the number of faults exceeded a given<br />
threshold value. One objective of the paper was to compare<br />
different statistical techniques (classification trees and<br />
discrim<strong>in</strong>ant analysis with or without the use of PCA to determ<strong>in</strong>e<br />
the set of candidate variables) for build<strong>in</strong>g fault-<strong>prone</strong>ness models<br />
over a sequence of releases. Amongst others, they built fault<strong>prone</strong>ness<br />
classification trees (for each release) and evaluated the<br />
stability of the classification trees over successive releases. The
esults suggest that PCA comb<strong>in</strong>ed with classification trees is a<br />
viable approach for model<strong>in</strong>g fault <strong>prone</strong>ness as a software<br />
system evolves. However, due to the limitations <strong>in</strong> the data, it<br />
would not be possible to assess the cost-effectiveness of the<br />
obta<strong>in</strong>ed models on future releases.<br />
On the basis of results summarized <strong>in</strong> [2], it appears that structural<br />
properties of software are useful predictors of fault <strong>prone</strong>ness.<br />
However, even simple measures of the size, diffusion, and type of<br />
changes may be useful predictors of fault-<strong>prone</strong>ness, as illustrated<br />
<strong>in</strong> [12]. This study also suggests that the experience of the<br />
developer perform<strong>in</strong>g changes should ideally be considered.<br />
Measures of the cumulated difference <strong>in</strong> structural properties over<br />
time can also be significant predictors of fault <strong>prone</strong>ness [13].<br />
However, on the basis of results <strong>in</strong> [7] and <strong>in</strong> this paper, it appears<br />
that whenever historic data of changes and faults are available,<br />
they should also be <strong>in</strong>cluded as candidate predictors of fault<br />
<strong>prone</strong>ness, because they will probably result <strong>in</strong> practically useful<br />
improvements <strong>in</strong> prediction accuracy. If history data from many<br />
releases are available, a weighted time damp model [7] seems to<br />
be a viable approach for prediction purposes.<br />
To summarize, our study differs from exist<strong>in</strong>g work <strong>in</strong> several<br />
ways. It takes place <strong>in</strong> the context of an object-oriented legacy<br />
system and goes beyond predict<strong>in</strong>g the fault-<strong>prone</strong>ness of classes<br />
to look <strong>in</strong>to the cost-effectiveness of predictions when us<strong>in</strong>g them<br />
to drive verification effort.<br />
6. CONCLUSIONS<br />
The ma<strong>in</strong> goal of this paper is to report on a study performed <strong>in</strong> a<br />
large telecom company and which focuses on predict<strong>in</strong>g fault<strong>prone</strong><br />
parts of an object-oriented, legacy system after a new<br />
release is completed. The goal is to help QA eng<strong>in</strong>eers focus their<br />
limited verification resources on parts of the system likely to<br />
conta<strong>in</strong> faults. Though many studies exist on the topic of<br />
predict<strong>in</strong>g fault <strong>prone</strong>ness, this is the first study do<strong>in</strong>g so <strong>in</strong> the<br />
context of an object-oriented, evolv<strong>in</strong>g legacy software system.<br />
Such systems are bound to become <strong>in</strong>creas<strong>in</strong>gly more important<br />
<strong>in</strong> the future.<br />
We make use of a variety of measures as <strong>in</strong>dependent variables<br />
rang<strong>in</strong>g from structural measures, structural impact measures,<br />
code quality measures, change and fault measures, and history<br />
data from previous releases. Us<strong>in</strong>g logistic regression on logtransformed<br />
variables we build a multivariate prediction model to<br />
predict the probability of fault correction across classes, assess its<br />
goodness of fit, and its prediction capability on the release<br />
subsequent to the release on which the prediction model was built.<br />
Us<strong>in</strong>g a novel, simple, and pragmatic approach, we then assess<br />
the potential cost-effectiveness of us<strong>in</strong>g such a model to focus<br />
verification effort. This is rarely done <strong>in</strong> studies predict<strong>in</strong>g fault<strong>prone</strong>ness<br />
but we believe this is essential to get a realistic estimate<br />
of how useful such models can be <strong>in</strong> practice.<br />
A Leave-one-out cross validation yields less than 20% of false<br />
negatives and false positives when select<strong>in</strong>g a balanced fault<br />
correction probability threshold. The cost-effectiveness analysis<br />
suggests that, if such a prediction model would be used to focus<br />
verification, given a certa<strong>in</strong> number of assumptions, it could result<br />
<strong>in</strong>to a cost reduction of about 29%.<br />
However, these results show there is substantial room for<br />
improvement <strong>in</strong> terms of false negatives and false positives.<br />
Given the limitations of our data this is not surpris<strong>in</strong>g.<br />
Nevertheless, our study shows that build<strong>in</strong>g such fault-<strong>prone</strong>ness<br />
models is promis<strong>in</strong>g as it could potentially save verification effort<br />
<strong>in</strong> the context of a constantly chang<strong>in</strong>g legacy system. It also<br />
suggests that us<strong>in</strong>g history change and fault data about previous<br />
releases is paramount to develop<strong>in</strong>g a useful prediction model on<br />
a given release.<br />
Future work will <strong>in</strong>clude collect<strong>in</strong>g additional data on other<br />
releases and collect more precise change and fault data regard<strong>in</strong>g<br />
the size and the cause of changes. Thus, we hope to develop more<br />
accurate prediction models lead<strong>in</strong>g to <strong>in</strong>creased costeffectiveness.<br />
7. ACKNOWLEDGMENTS<br />
Thanks to Kristoffer Kvam and Paul Skrede who made the data<br />
available to us. Thanks also to Valery Buzungu who assisted with<br />
the data extraction and to Hans Christian Benestad who helped us<br />
with the JHawk tool. The research was partly f<strong>in</strong>anced by the<br />
Research Council of Norway through the research project<br />
EVISOFT.<br />
8. REFERENCES<br />
[1] B. Boehm, "Value-Based Software Eng<strong>in</strong>eer<strong>in</strong>g," ACM<br />
Software Eng<strong>in</strong>eer<strong>in</strong>g Notes, 28(2), 2003, 1–12.<br />
[2] L. C. Briand and J. Wuest, "Empirical Studies of Quality<br />
Models <strong>in</strong> Object-Oriented <strong>System</strong>s," Advances <strong>in</strong><br />
Computers, 59, 2002, 97–166.<br />
[3] L. C. Briand, S. Morasca, and V. R. Basili, "Property-based<br />
Software Eng<strong>in</strong>eer<strong>in</strong>g Measurement," IEEE Trans. on<br />
Software Eng., 22(1), 1996, 68–85.<br />
[4] M. Cartwright and M. Shepperd, "An Empirical<br />
Investigation of an Object-Oriented Software <strong>System</strong>,"<br />
IEEE Trans. on Software Eng., 26(8), 2000, 786–796.<br />
[5] S. R. Chidamber, D. P. Darcy, and C. F. Kemerer,<br />
"Managerial Use of Metrics for Object-Oriented Software:<br />
An Exploratory Analysis," IEEE Trans. on Software Eng.,<br />
24(8), 1998, 629–637.<br />
[6] R. J. Freund and W. J. Wilson, Regression Analysis:<br />
statistical model<strong>in</strong>g of a response variable: Academic Press,<br />
1998.<br />
[7] T. L. Graves, A. F. Karr, J. S. Marron, and H. Siy,<br />
"<strong>Predict<strong>in</strong>g</strong> <strong>Fault</strong> Incidence Us<strong>in</strong>g Software Change<br />
History," IEEE Trans. on Software Eng., 26(7), 2000, 653–<br />
661.<br />
[8] R. Harrison, S. Counsell, and R. Nithi, "Experimental<br />
Assessment of the Effect of Inheritance on the<br />
Ma<strong>in</strong>ta<strong>in</strong>ability of Object-Oriented <strong>System</strong>s," Journal of<br />
<strong>System</strong>s and Software, 52(2-3), 2000, 173–179.<br />
[9] K. F. Hirji, C. R. Mehta, and N. R. Patel, "Comput<strong>in</strong>g<br />
Distributions for Exact Logistic Regression," JASA, 82,<br />
1987, 1110–1117.<br />
[10] JHawk, http://www.virtualmach<strong>in</strong>ery.com/jhawkprod.htm.<br />
[11] K. Kvam, R. Lie, and D. Bakkelund, "<strong>Legacy</strong> system<br />
exorcism by Pareto's pr<strong>in</strong>ciple," proc. OOPSLA'05, pp.<br />
250–256.<br />
[12] A. Mockus and D. M. Weiss, "<strong>Predict<strong>in</strong>g</strong> Risk of Software<br />
Changes," Bell Labs Technical Journal, April-June 2000,<br />
169–180.<br />
[13] A. P. Nikora and J. C. Munson, "Develop<strong>in</strong>g fault predictors<br />
for evolv<strong>in</strong>g software systems," proc. METRICS'03, 2003,<br />
pp. 338–350.
[14] M. C. Ohlson, A. Amschler Andrews, and C. Wohl<strong>in</strong>,<br />
"Modell<strong>in</strong>g fault-<strong>prone</strong>ness statistically over a sequence of<br />
releases: a case study," Journal of Software Ma<strong>in</strong>tenance<br />
and Evolution: Research and Practice, 13, 2001, 167–199.<br />
[15] J. Tian, Software Quality Eng<strong>in</strong>eer<strong>in</strong>g. Wiley, 2005.<br />
[16] XRadar, http://xradar.sourceforge.net/.<br />
[17] R. K. Y<strong>in</strong>, Case Study Research, Design and Methods, 3rd<br />
edition. Thousand Oaks, CA.: Sage Publications, 2003.<br />
[18] T. J. Yu, V. Y. Shen, and H. E. Dunsmore, "An analysis of<br />
several software defect models," IEEE Trans. on Software<br />
Eng., 14( 9), 1988, 1261–1270.<br />
Appendix A – Pr<strong>in</strong>cipal Component Analysis of the <strong>in</strong>dependent variables on R2<br />
Table 4. Pr<strong>in</strong>cipal Component Analysis, us<strong>in</strong>g the VariMax rotation, eigenvalues >= 1.0<br />
Rotated Factor Pattern<br />
Variable PC1 PC2 PC3 PC4 PC5 PC6 PC7 PC8<br />
LogViolations 0.79 -0.16 0.22 0.10 0.12 0.01 -0.02 -0.11<br />
LogDuplications 0.68 -0.25 0.19 0.03 0.25 -0.07 0.12 0.08<br />
LogStyleErrors 0.67 -0.30 0.15 -0.02 -0.08 -0.04 -0.30 -0.02<br />
LogFunctions 0.85 -0.05 0.20 0.00 -0.07 -0.23 0.19 -0.14<br />
LogNcss 0.93 -0.01 0.25 -0.04 -0.04 0.06 0.06 0.03<br />
Log<strong>Java</strong>docs 0.84 -0.01 0.14 -0.07 -0.07 -0.18 0.18 -0.09<br />
LogCcn 0.94 0.01 0.14 -0.04 -0.06 -0.06 0.09 -0.04<br />
LogLCOM 0.09 0.03 0.89 0.03 -0.06 0.13 -0.07 0.04<br />
LogEXT 0.93 0.12 -0.04 -0.09 -0.06 0.22 -0.04 0.04<br />
LogHIER -0.10 0.06 0.01 -0.10 0.11 -0.03 0.06 0.80<br />
LogLOC 0.79 -0.01 0.26 0.32 0.16 0.02 0.10 -0.01<br />
LogINST 0.45 -0.02 0.80 0.12 0.03 0.03 0.12 -0.05<br />
LogMOD 0.19 0.04 0.24 -0.10 0.12 0.79 0.00 0.06<br />
LogINTR 0.23 0.06 0.35 -0.37 -0.08 -0.14 0.34 -0.40<br />
LogPACK 0.83 0.04 -0.14 -0.35 -0.01 -0.20 -0.11 0.03<br />
LogRFC 0.97 0.07 0.03 -0.04 -0.08 0.02 0.02 -0.01<br />
LogMPC 0.94 0.11 -0.04 -0.10 -0.06 0.20 -0.05 0.03<br />
LogFIN -0.08 -0.02 0.15 0.76 -0.25 -0.13 -0.10 -0.16<br />
LogFOUT 0.88 0.12 -0.05 -0.20 -0.01 0.22 -0.14 0.09<br />
LogNSUP -0.12 -0.06 -0.10 0.01 0.83 0.14 0.07 0.18<br />
LogNSUB -0.10 -0.18 0.01 -0.17 -0.05 0.17 0.66 0.40<br />
LogdFOUT 0.50 0.64 -0.03 -0.27 -0.01 0.08 -0.01 0.03<br />
LogdLCOM 0.04 0.86 0.15 0.02 0.01 0.06 0.05 0.09<br />
LogdNSUP 0.11 0.03 0.06 -0.43 0.72 -0.05 -0.06 -0.04<br />
LogdLOC 0.70 0.30 0.13 0.15 0.27 -0.09 0.17 -0.11<br />
LogdMOD -0.04 0.94 -0.03 0.00 -0.01 0.04 0.05 -0.04<br />
LogdNSUB 0.15 0.25 0.01 0.02 0.07 -0.02 0.77 -0.13<br />
Log<strong>Fault</strong>Corrections 0.45 -0.11 0.15 -0.15 0.04 -0.50 -0.21 0.30<br />
LogChangeCount 0.71 0.08 0.09 -0.40 0.07 -0.19 -0.04 -0.15<br />
LogPrevVersionCount 0.08 -0.94 0.06 -0.02 0.02 0.05 -0.04 0.05<br />
Logn1<strong>Fault</strong>Corrections 0.45 -0.15 0.03 0.05 0.03 -0.40 -0.10 0.44<br />
Logn1ChangeCount 0.61 -0.51 0.03 0.03 0.08 -0.24 0.05 0.17<br />
Variance Expla<strong>in</strong>ed 11.88 3.63 2.06 1.55 1.55 1.53 1.50 1.46<br />
Cumulative 0.39 0.50 0.57 0.63 0.68 0.72 0.75 0.79