The America's Cup: Economic Impacts of a Match - Bay Area Council
The America's Cup: Economic Impacts of a Match - Bay Area Council
The America's Cup: Economic Impacts of a Match - Bay Area Council

Create successful ePaper yourself
Turn your PDF publications into a flip-book with our unique Google optimized e-Paper software.
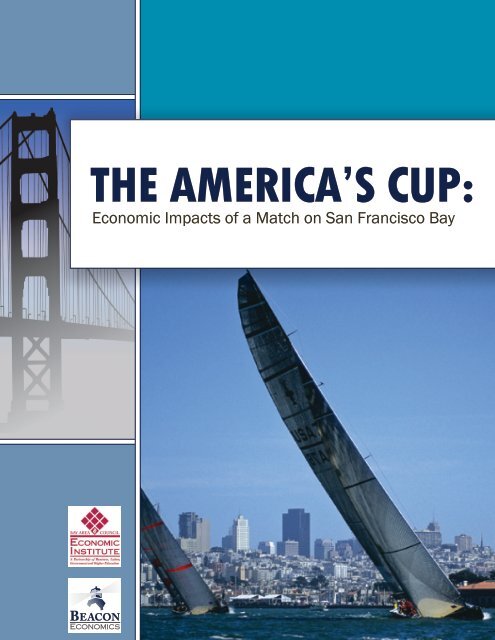
THE AMERICA’S CUP:<br />
<strong>Economic</strong> <strong>Impacts</strong> <strong>of</strong> a <strong>Match</strong> on San Francisco <strong>Bay</strong>
<strong>The</strong> <strong>America's</strong> <strong>Cup</strong>:<br />
<strong>Economic</strong> <strong>Impacts</strong> <strong>of</strong> a <strong>Match</strong><br />
on San Francisco <strong>Bay</strong><br />
This publication was prepared by:<br />
<strong>Bay</strong> <strong>Area</strong> <strong>Council</strong> <strong>Economic</strong> Institute (BACEI)<br />
Beacon <strong>Economic</strong>s<br />
For further information about this publication please contact:<br />
Sean Randolph, President & CEO<br />
<strong>Bay</strong> <strong>Area</strong> <strong>Council</strong> <strong>Economic</strong> Institute<br />
Jon Haveman, Founding Principal<br />
Beacon <strong>Economic</strong>s<br />
201 California Street, Suite 1450 1299 Fourth Street, Suite 400<br />
San Francisco, California 94111 San Rafael, California 94901<br />
415.981.7117 415.457.6006<br />
Sean@<strong>Bay</strong><strong>Area</strong><strong>Council</strong>.org<br />
Jon@BeaconEcon.com<br />
Reproduction <strong>of</strong> this document or any portion therein is prohibited without the expressed written permission <strong>of</strong> BACEI and Beacon<br />
<strong>Economic</strong>s. Copyright ©2010 by BACEI and Beacon <strong>Economic</strong>s LLC.<br />
Cover photo Copyright ©www.h2oshots.com circa 2003, Moët <strong>Cup</strong> San Francisco.
Contents<br />
Executive Summary 1<br />
Introduction 3<br />
What is the <strong>America's</strong> <strong>Cup</strong>? 4<br />
Details <strong>of</strong> an <strong>America's</strong> <strong>Cup</strong> Defense 7<br />
Tourism <strong>Impacts</strong> 9<br />
San Francisco 10<br />
Regional <strong>Impacts</strong> 12<br />
Port <strong>of</strong> San Francisco 14<br />
Estimating the Potential <strong>Economic</strong> <strong>Impacts</strong> 15<br />
Participating Agents 16<br />
<strong>The</strong> <strong>Economic</strong> Impact 23<br />
Implications for New Tax Revenues for the San Francisco General Fund 25<br />
Employment Effects by Occupation 26<br />
Results for the <strong>Bay</strong> <strong>Area</strong>, California, and the United States 27<br />
Comparison to Valencia and Auckland 31<br />
<strong>America's</strong> <strong>Cup</strong> <strong>Economic</strong>s: Costs and Caveats 32<br />
Sensitivity Analysis 33<br />
Summary 36<br />
Appendix A: Detailed Results by Agent 38<br />
Appendix B: IMPLAN Input-Output Methodology 53<br />
Appendix C: Acknowledgements 55
Executive Summary<br />
<strong>The</strong> <strong>America's</strong> <strong>Cup</strong> is the world's third-largest sporting competition, after the Olympics and soccer's World <strong>Cup</strong>.<br />
Securing hosting rights to the <strong>Cup</strong> is therefore a prestigious and economically significant prize for any community.<br />
<strong>The</strong> economic benefits <strong>of</strong> bringing the <strong>America's</strong> <strong>Cup</strong> to San Francisco would come primarily through<br />
expenditures by racing syndicates, and through spending on hotels, restaurants, and retail and other services<br />
by both domestic and overseas visitors and <strong>Bay</strong> <strong>Area</strong> residents. If the competition were to run for three months,<br />
this could lead to an additional 2.6 million spectators. While these impacts would be primarily concentrated in<br />
San Francisco, nearby counties such as Alameda, Marin, Napa, Sonoma, and San Mateo would also benefit from<br />
increased visitor and maritime activity.<br />
This report endeavours to provide estimates <strong>of</strong> the economic impact <strong>of</strong> an <strong>America's</strong> <strong>Cup</strong> match on the San Francisco<br />
<strong>Bay</strong>. Economists have paved the way by providing estimates <strong>of</strong> the economic impacts <strong>of</strong> previous <strong>America's</strong><br />
<strong>Cup</strong>s, including an analysis <strong>of</strong> the economic impacts <strong>of</strong> the 32nd <strong>America's</strong> <strong>Cup</strong> <strong>of</strong> 2007 in Valencia, Spain. Starting<br />
with that study as a rough guide, this analysis makes a number <strong>of</strong> assumptions: that infrastructure cost and<br />
spending will be several billion dollars less; that spectator attendance will be considerably larger; that the media's<br />
presence will be larger; and that the presence <strong>of</strong> super yachts will likely be smaller.<br />
From this, we estimate that the increase in overall economic activity in San Francisco due to hosting an <strong>America's</strong><br />
<strong>Cup</strong> could be on the order <strong>of</strong> $1.4 billion. This is three times the estimated impact <strong>of</strong> hosting the Super Bowl<br />
($300-$500 million). <strong>The</strong> potential increase in employment surrounding the event could be on the order <strong>of</strong> 8,840<br />
jobs. This increase in output and employment would likely yield a benefit to state and local government c<strong>of</strong>fers <strong>of</strong><br />
nearly $85 million. Additional taxes alone to the City's General Fund are expected to net more than $13 million,<br />
based on more than $24 million in revenue, and an estimated $11 million in tourism related costs.<br />
Looking beyond the <strong>Bay</strong> <strong>Area</strong>, California's economy would see increased economic activity <strong>of</strong> $1.4 billion. <strong>The</strong><br />
U.S. economy as a whole would see increased economic activity <strong>of</strong> $1.9 billion. This increase would support the<br />
creation <strong>of</strong> 11,978 jobs.<br />
<strong>The</strong> figures produced here are likely to be compared to previous estimates indicating that hosting the <strong>Cup</strong> on the<br />
<strong>Bay</strong> would result in economic benefits to the region on the order <strong>of</strong> $9.9 billion. We have consciously made an<br />
effort to be conservative in our analysis and to evaluate economic impacts for which there is a factual basis and<br />
1
which would be unique to the venue <strong>of</strong> the San Francisco <strong>Bay</strong>, and by focusing on direct quantifiable benefits as<br />
opposed to more indirect benefits.<br />
At this stage, it is important to recognize that a number <strong>of</strong> important parameters related to the race, such as how<br />
many participants, whether or not there will be a Defender Series, the format <strong>of</strong> each series, how many races per<br />
day, and the like, are still uncertain. As a result, the findings in this analysis are only indications based on the best<br />
information currently available. <strong>The</strong>re is further uncertainty in that the <strong>America's</strong> <strong>Cup</strong> has never been raced in<br />
a location quite like San Francisco. An <strong>America's</strong> <strong>Cup</strong> in the natural amphitheater that is the San Francisco <strong>Bay</strong><br />
would likely be extremely successful from a spectator perspective. Being more accessible than races on the open<br />
seas, the competition would likely be witnessed by historically large crowds <strong>of</strong> spectators.<br />
<strong>The</strong> positive exposure provided by extensive national and global media coverage, with San Francisco, Alameda,<br />
and Marin counties as the backdrop, can also be expected to generate longer-term visitor and other economic<br />
benefits for San Francisco and the <strong>Bay</strong> <strong>Area</strong>, extending well beyond the duration <strong>of</strong> the race. A local successful defense<br />
<strong>of</strong> the <strong>America's</strong> <strong>Cup</strong> will likely lead to additional such events in the future. San Diego, for example, was the<br />
host to three successive <strong>America's</strong> <strong>Cup</strong>s, in 1988, 1992, and 1995. Over the long-term, hosting the next <strong>America's</strong><br />
<strong>Cup</strong> has potential benefits that significantly exceed those presented here.<br />
2
Introduction<br />
<strong>The</strong> <strong>America's</strong> <strong>Cup</strong> is the world's third-largest sporting competition currently in existence. This is true whether<br />
measured by number <strong>of</strong> spectators or by the amount <strong>of</strong> economic activity generated by spectators and those directly<br />
involved in the competition. <strong>The</strong> top two are: 1) the Olympics, and 2) soccer's World <strong>Cup</strong>. 1 Securing hosting<br />
rights to the <strong>America's</strong> <strong>Cup</strong> is therefore a prestigious and economically significant prize for any community. If<br />
chosen to host the next <strong>America's</strong> <strong>Cup</strong> race, San Francisco and the <strong>Bay</strong> <strong>Area</strong> stand to benefit significantly, through<br />
direct expenditures on goods and services related to the race, near-term visitor activity and related spending, and<br />
long-term media exposure.<br />
Estimates <strong>of</strong> the expenditures related to previous <strong>America's</strong> <strong>Cup</strong>s indicate that hundreds <strong>of</strong> millions <strong>of</strong> dollars are<br />
spent in the local economy by race participants. <strong>The</strong> teams <strong>of</strong> competitors, or syndicates as they are usually called,<br />
will take up residence in the area sometimes up to two years in advance <strong>of</strong> the competition. <strong>The</strong>ir several hundred<br />
staff members and their families generally live in the area, adding to local economic activity. <strong>The</strong> media and event<br />
organizers can also be relied upon to add significant demand to the local economy. Infrastructure improvements<br />
made by local governments, marinas, and yacht clubs that would not have otherwise occurred also increase local<br />
output and employment. And the myriad spectators <strong>of</strong> these events will provide a boost to the local economy.<br />
<strong>The</strong>se benefits manifest themselves in a variety <strong>of</strong> ways. First, local businesses see an increase in demand for goods<br />
and services. This increased demand drives an increase in revenues. Second, there is an increase in employment at<br />
these businesses as they require more workers to provide these goods and services. Third, increased employment<br />
and sales lead to more state and local tax revenues. San Francisco is heavily reliant on revenues from tourism,<br />
and hosting an <strong>America's</strong> <strong>Cup</strong> would yield a significant increase in tourism-related revenues during the three to<br />
four months <strong>of</strong> the event, and perhaps for several years following as worldwide broadcasts <strong>of</strong> the event serve as<br />
marketing for the city and the broader region.<br />
We have consciously made an effort to be conservative in our analysis. This conservative approach reduces the<br />
estimates <strong>of</strong> the impact, but given the size <strong>of</strong> the numbers, it still presents a very compelling case for substantial<br />
local economic benefits. When the results <strong>of</strong> these other studies are similarly limited, the indicated economic<br />
benefits are comparable.<br />
1 <strong>The</strong> 2000 Olympic Games were reported to have an economic impact <strong>of</strong> some $10 billion. According to the FIFA website, the 2006 World<br />
<strong>Cup</strong> recorded <strong>of</strong>ficial attendance statistics <strong>of</strong> 3.4 million people, or 52,491 per match.<br />
3
What is the <strong>America's</strong> <strong>Cup</strong>?<br />
<strong>The</strong> <strong>America's</strong> <strong>Cup</strong> is the world's greatest sailing competition and the oldest active trophy<br />
in international sports, with a history extending back to 1851. <strong>The</strong> <strong>Cup</strong> was originally<br />
awarded to the victor <strong>of</strong> a special race <strong>of</strong> 'yachts <strong>of</strong> all nations' in conjunction with the great<br />
exhibition <strong>of</strong> 1851. This race was around the Isle <strong>of</strong> Wight for the Royal Yacht Squadron 100<br />
Guinea <strong>Cup</strong>, a cup <strong>of</strong> 100 GB pounds in value. This victor was an American syndicate sailing<br />
a schooner named America. <strong>The</strong> schooner's name is the original source <strong>of</strong> the <strong>Cup</strong>'s<br />
current moniker: <strong>America's</strong> <strong>Cup</strong>. <strong>The</strong> <strong>Cup</strong> was donated to the New York Yacht Club in 1857<br />
along with a Deed <strong>of</strong> Gift by the syndicate's surviving members. This Deed <strong>of</strong> Gift remains<br />
the ultimate source <strong>of</strong> the <strong>Cup</strong>'s fundamental rules, including that it be held as a perpetual<br />
challenge trophy for syndicates from competing nations.<br />
For much <strong>of</strong> the <strong>Cup</strong>'s history, there was only a single challenger and a single defender participating in the challenge.<br />
Today, ten or more vessels typically compete over a period <strong>of</strong> several months prior to the defense, with<br />
related competitions and regattas taking place around the world in the years prior to the defense. <strong>The</strong> competition<br />
is held in three to four year intervals, with the winner <strong>of</strong> each <strong>Cup</strong> gaining the right to determine nearly<br />
everything in the following competition. In particular, the defender determines where the next race series will<br />
be held, the parameters <strong>of</strong> the series, and restrictions on boat design.<br />
<strong>The</strong> most recent races have taken place in Valencia (Spain),<br />
Auckland (New Zealand), San Diego (California), and Fremantle<br />
(Australia). Racing syndicates (the label given to each group<br />
supporting a challenging or defending vessel), relocate their<br />
crews, support staffs, and their families to the venue chosen<br />
for the race as far as two years in advance, building facilities to<br />
house the vessels, support team, and sponsor activity. <strong>The</strong> time<br />
on location is spent testing and perfecting boat design and developing<br />
the skills and local knowledge required to sail the vessel to perfection. Local knowledge extends from<br />
<strong>The</strong> Yacht America<br />
winds (their consistency and magnitude) to tides, and other peculiar features <strong>of</strong> sailing at the chosen venue. 2<br />
2 For instance kelp (seaweed) in San Diego.<br />
4
<strong>The</strong> race brings with it the potential for local expenditures by the participating syndicates, but more importantly<br />
it brings the spending and exposure that come with large numbers <strong>of</strong> domestic and international visitors and<br />
significant media coverage. <strong>The</strong>re is reason to believe that were the race to be held on the San Francisco <strong>Bay</strong>, the<br />
near- and long-term economic benefits would be greater than has been the case at other venues. For the first time<br />
the race would be taking place within a major urban area that is already a major tourist and business destination.<br />
Most importantly, if it were to take place on the <strong>Bay</strong>, the opportunities for spectators would be far greater than<br />
is usually the case.<br />
Historically the races have all taken place<br />
on the open seas, as much as 20 miles <strong>of</strong>fshore,<br />
limiting public access and participation.<br />
Spectators must watch either on a television<br />
screen on land or from a boat among<br />
the spectator fleet. In the case <strong>of</strong> San Francisco,<br />
the race would take place in a natural<br />
amphitheater bounded by San Francisco, the<br />
Marin Headlands, Alcatraz, and Angel Island,<br />
expanding viewing opportunities and potentially<br />
drawing in millions <strong>of</strong> residents and visitors. <strong>The</strong> more intimate setting <strong>of</strong>fers an opportunity to popularize<br />
the event, drawing in a larger and more diverse set <strong>of</strong> viewers, increasing business activity in surrounding communities,<br />
and generating long-term benefits through the global exposure that would come from media coverage<br />
showcasing San Francisco, Marin County, and the <strong>Bay</strong> <strong>Area</strong> as a backdrop. This translates into economic opportunity<br />
– on a potentially large scale – for the region. Improving the race's exposure increases the likelihood that<br />
<strong>Cup</strong> activity will catalyze other long- and short-term spending, expanding the economic impacts well beyond the<br />
immediate financial effects <strong>of</strong> the race itself.<br />
Although the original <strong>America's</strong> <strong>Cup</strong> was won by a schooner, since 1992, most <strong>America's</strong> <strong>Cup</strong> related matches have<br />
taken place in <strong>America's</strong> <strong>Cup</strong> Class yachts. <strong>The</strong>se yachts, though not identical, all conform to a particular set <strong>of</strong><br />
rules. <strong>The</strong> formula has been revised over the years, with the most recent revision specifying:<br />
Length: 25 meters<br />
Weight: 24 tonnes<br />
5
Height <strong>of</strong> the mast: 35 meters<br />
Weight <strong>of</strong> the bulb: 19 tonnes<br />
Sail surface area: 325 meters squared upwind and 75 meters squared downwind<br />
Crew: 17<br />
<strong>The</strong>se rules provide for a significant amount <strong>of</strong> latitude in design resulting in sometimes significant differences<br />
in boat speed. As a result, technology plays an increasing role in the development <strong>of</strong> <strong>America's</strong> <strong>Cup</strong> yachts. Despite<br />
the fact that the 33rd <strong>America's</strong> <strong>Cup</strong> included highly unconventional sailboats, it has yet to be determined<br />
whether the next <strong>America's</strong> <strong>Cup</strong> will repeat this or return to a more traditional design.<br />
<strong>America's</strong> <strong>Cup</strong> Class Yachts 3 33rd <strong>America's</strong> <strong>Cup</strong> Trimaran 3<br />
3 <strong>The</strong>se pictures were taken by Gilles Martin-Raget and were downloaded from the BMW/Oracle website: http://bmor-photo.com.<br />
6
Details <strong>of</strong> an <strong>America's</strong> <strong>Cup</strong> Defense<br />
Evaluating the economic implications for the local economy <strong>of</strong> hosting an <strong>America's</strong> <strong>Cup</strong> depends crucially on<br />
the extent <strong>of</strong> racing that takes place. <strong>The</strong> 2007 <strong>America's</strong> <strong>Cup</strong> involved local racing over several years prior to the<br />
<strong>Cup</strong>, in addition to intensive local racing in the form <strong>of</strong> a challenger series in the two months just prior to the <strong>Cup</strong>.<br />
In contrast, the 2010 <strong>America's</strong> <strong>Cup</strong> in Valencia only involved two races over the course <strong>of</strong> three days, a notable<br />
anomaly. This significantly limited the economic benefits <strong>of</strong> the event.<br />
<strong>The</strong> <strong>America's</strong> <strong>Cup</strong> started out as a fleet regatta – races in which multiple competitors would participate simultaneously.<br />
After the first defense, however, for the next nearly 100 years, a defense included just a single challenger<br />
and a single defender. More recently, a challenge has generally included racing that occurs in the years immediately<br />
prior to the actual defense. <strong>The</strong> most recent, more or less typical, <strong>America's</strong> <strong>Cup</strong> defense occurred in<br />
Valencia in 2007. Racing associated with the defense occurred in 13 separate Acts, or regattas, prior to the series<br />
that formally selected the challenger for the eventual <strong>America's</strong> <strong>Cup</strong> <strong>Match</strong>. Act 1 occurred in September 2004,<br />
nearly three years prior to the actual defense. <strong>The</strong>se Acts ensure intense competition in the years leading up to<br />
the defense and also circulate the <strong>America's</strong> <strong>Cup</strong> around different venues, broadening the geographic range <strong>of</strong><br />
the excitement surrounding the event.<br />
It seems likely that the format <strong>of</strong> the next defense will be comparable to that <strong>of</strong> the 2007 defense, the 32nd <strong>America's</strong><br />
<strong>Cup</strong>. As such, the components <strong>of</strong> the defense will likely include:<br />
Early regattas between potential challengers<br />
A Challenger Selection Series<br />
A Defender Series<br />
<strong>The</strong> <strong>America's</strong> <strong>Cup</strong> Defense<br />
<strong>The</strong> early regattas are a series <strong>of</strong> races composed <strong>of</strong> match racing between potential <strong>America's</strong> <strong>Cup</strong> challengers.<br />
<strong>The</strong>se races take place in <strong>America's</strong> <strong>Cup</strong> Class yachts. This class was created in 1990 and has been featured in<br />
most <strong>America's</strong> <strong>Cup</strong>s since then. Preliminary races such as these started in early 2009, in Nice, France. <strong>The</strong>re<br />
are currently five regattas scheduled around the world, with three having been completed. It is anticipated that<br />
more preliminary regattas will be scheduled, and the City <strong>of</strong> San Francisco has invited the World Sailing Teams<br />
Association to consider the city as a venue for a sailing regatta in the fall <strong>of</strong> 2011.<br />
7
It seems likely that if chosen as the ultimate venue for the defense, San Francisco would also be host to several<br />
regattas in 2011 and 2012 prior to the challenger series, though this remains uncertain. Were this to happen, the<br />
economic impact <strong>of</strong> hosting the defense would be enhanced not only because <strong>of</strong> the fact <strong>of</strong> the other two races<br />
but also because having experienced the city during an earlier regatta, spectators would likely return, bolstering<br />
the size <strong>of</strong> the spectator pool during both the challenger series and ultimately the <strong>America's</strong> <strong>Cup</strong> defense.<br />
<strong>The</strong> Challenger Selection Series has been a staple <strong>of</strong> the modern <strong>America's</strong> <strong>Cup</strong> defense. With more than one challenging<br />
syndicate, a means for selecting a single most worthy challenger must be put in place. This has in all but<br />
two <strong>of</strong> the last nine <strong>America's</strong> <strong>Cup</strong>s been the function <strong>of</strong> the Louis Vuitton <strong>Cup</strong> (LVC). It is a near certainty that a<br />
challenger series <strong>of</strong> match races would take place on the <strong>Bay</strong> in the months before the <strong>America's</strong> <strong>Cup</strong> races begin.<br />
Since 1983, there have been between 7 and 13 challengers participating in the Challenger Selection Series. In 2007,<br />
there were 11 challengers, and racing lasted for nearly two months, between April 16 and June 6. <strong>The</strong> racing consisted<br />
<strong>of</strong> two round robin series <strong>of</strong> match races (races between only two competitors). Combining the results from<br />
these races with points accumulated during the previous Acts, four teams were invited into the semifinals, from<br />
which the ultimate challenger, Emirates Team New Zealand, was selected to challenge Alinghi in the <strong>America's</strong><br />
<strong>Cup</strong>.<br />
Table 1: Recent History <strong>of</strong> <strong>America's</strong> <strong>Cup</strong> Timing<br />
Defender Series Challenger Series <strong>America's</strong> Total<br />
Year Location Dates # Participants Dates # Participants <strong>Cup</strong> Duration<br />
1983 Fremantle − − − − 9/14-9/26 12 Days<br />
1987 Fremantle 8/18-1/20 8 10/5-1/23 13 1/31-2/4 5.5 Months<br />
1988 San Diego − − − − 9/7-9/9 3 Days<br />
1992 San Diego 1/14-4/30 5 1/25-4/30 7 5/9-5/16 5 Months<br />
1995 San Diego 1/15-4/23 3 1/12-4/21 7 5/5-5/13 5 Months<br />
2000 Auckland − − 10/18-2/6 11 2/20-3/2 5.5 Months<br />
2003 Auckland − − 10/1-1/19 9 2/15-3/2 5 Months<br />
2007 Valencia − − 4/16-6/2 11 6/23-7/7 3 Months<br />
2010 Valencia − − − − 2/12-2/14 3 Days<br />
<strong>The</strong> defender <strong>of</strong> the <strong>America's</strong> <strong>Cup</strong> is not necessarily the syndicate that won the previous <strong>America's</strong> <strong>Cup</strong> <strong>Match</strong>.<br />
By the Deed, the yacht club that holds the <strong>Cup</strong> makes the selection <strong>of</strong> the yacht that will ultimately sail against<br />
the defender. This is <strong>of</strong>ten accomplished by including a Defender Series in the mix <strong>of</strong> sailing in addition to the<br />
Challenger Selection Series and the defense. A Defender Series is not necessarily a staple <strong>of</strong> <strong>America's</strong> <strong>Cup</strong> activities.<br />
However, it is possible that the Golden Gate Yacht Club would host such a series, if only to afford their boat<br />
8
an opportunity for greater race experience with which to defeat the selected challenger. <strong>The</strong> timing and duration<br />
<strong>of</strong> such a series, were it to happen, is not currently known, but it would likely happen concurrently with and be<br />
<strong>of</strong> similar length to the challenger series − this has been the case with previous Defender Series. In the past, the<br />
modal number <strong>of</strong> syndicates participating in a Defender Series has been four: three syndicates in addition to the<br />
previous <strong>America's</strong> <strong>Cup</strong> winner. <strong>The</strong>re is no reason to believe that things will be any different this time around.<br />
Such a series would only serve to augment the economic benefits <strong>of</strong> hosting the <strong>America's</strong> <strong>Cup</strong>.<br />
Relative to the Challenger Selection Series and Defender Series, the <strong>America's</strong> <strong>Cup</strong> matches between challenger<br />
and defender is <strong>of</strong> comparatively short duration. In 2007, the <strong>America's</strong> <strong>Cup</strong> was raced between June 23 and July<br />
3, a period <strong>of</strong> 11 days. In 2003, the race lasted for just over two weeks, while in 1995 and 2000 racing continued<br />
for 13 days. As the <strong>America's</strong> <strong>Cup</strong> has in recent tradition consisted <strong>of</strong> one team winning 5 out <strong>of</strong> 9 races, the duration<br />
<strong>of</strong> the <strong>Cup</strong> is indeterminate, but seems to last for roughly two weeks. Duration depends on the presence <strong>of</strong><br />
appropriate conditions as well as ultimately the number <strong>of</strong> races needed to establish a winner.<br />
If things play out in San Francisco as they generally did in 2007 and over the course <strong>of</strong> the last 30 years, it seems<br />
reasonably clear that the <strong>Bay</strong> would see perhaps a month <strong>of</strong> racing in each <strong>of</strong> the years leading up to the <strong>America's</strong><br />
<strong>Cup</strong> and between three and four months <strong>of</strong> racing in the final year, culminating in the <strong>America's</strong> <strong>Cup</strong> defense.<br />
Tourism <strong>Impacts</strong><br />
Expenditures by the direct participants in the competition are the primary driver <strong>of</strong> economic benefits arising<br />
from the <strong>America's</strong> <strong>Cup</strong>. At the same time, the tourism impact is also likely to be significant. As an <strong>America's</strong> <strong>Cup</strong><br />
on the <strong>Bay</strong> would likely be headquartered in San Francisco, so too most <strong>of</strong> the economic benefits would accrue<br />
to the city. Other parts <strong>of</strong> the region are likely to experience an increase in tourism as well. In particular, many<br />
visitors to San Francisco will visit other locations around the <strong>Bay</strong> <strong>Area</strong> and Northern California. It is also possible<br />
that San Francisco may not have the hotel capacity to accommodate all tourists, or some may just prefer to stay<br />
in Marin County, the East <strong>Bay</strong>, or the South <strong>Bay</strong>.<br />
9
San Francisco<br />
<strong>The</strong> benefits to San Francisco's visitor industry would come in several forms:<br />
Hotels. As <strong>of</strong> October 2009, there were 32,976 hotel rooms available in San Francisco. During the likely months <strong>of</strong><br />
the <strong>America's</strong> <strong>Cup</strong>, June through September, occupancy rates in the city are at their very highest. Between 2005<br />
and 2009, occupancy rates averaged roughly 85%. This implies the availability <strong>of</strong> some 4,800 rooms for <strong>America's</strong><br />
<strong>Cup</strong> spectators. Using typical room occupancy data <strong>of</strong> 1.77 individuals per room, this suggests the availability <strong>of</strong><br />
hotel lodging for roughly 8,500 spectators on any given night during the <strong>America's</strong> <strong>Cup</strong>. Over the course <strong>of</strong> three<br />
months, assuming full occupancy, this suggests that at an average room rate <strong>of</strong> $180, the hotel industry could<br />
potentially receive an addition to normal revenues <strong>of</strong> up to $77.8 million.<br />
This calculation appears to provide an upper bound on the addition to revenues as it assumes that all hotel rooms<br />
would be occupied. However, it is frequently the case that room rates increase significantly during major events<br />
in the city. During periods <strong>of</strong> peak occupancy, such as special events, hotels are <strong>of</strong>ten able to command rates that<br />
are significantly higher than during less busy times <strong>of</strong> the year. Although the extent to which rates may increase<br />
is uncertain, the calculation above nonetheless provides an indication <strong>of</strong> the type <strong>of</strong> benefit that local hotels stand<br />
to gain. It should be noted that if the <strong>America's</strong> <strong>Cup</strong> were to run for three months, this would imply the accommodation<br />
<strong>of</strong> an additional 764,848 visitor days. <strong>The</strong> number <strong>of</strong> additional visitor days in Valencia in 2007 was<br />
significantly more than this, suggesting that hotels will likely have very high occupancy rates during the event<br />
and that the estimate above may not be too far <strong>of</strong>f the mark.<br />
That the available hotel rooms may be insufficient to accommodate<br />
all <strong>of</strong> the potential <strong>Cup</strong> spectators suggests that many would<br />
be encouraged to find lodging outside <strong>of</strong> the city or in private<br />
homes or residences. Both are quite probable, with hotels and inns<br />
in the North, East, and South <strong>Bay</strong> all likely benefitting from the influx<br />
<strong>of</strong> spectators.<br />
Another possibility for providing additional lodging is the use <strong>of</strong><br />
cruise ships as floating hotels, a concept that has been implemented at other large-scale events, including previous<br />
<strong>America's</strong> <strong>Cup</strong> races and the Sydney and Barcelona Olympics. Although dock space is limited at the Port <strong>of</strong><br />
San Francisco, smaller cruise ships can accommodate 900 to 1,000 guests, and larger vessels up to 5,400. Adding<br />
10
one or two cruise ships could absorb a significant portion, if not all, <strong>of</strong> the excess demand for hotel space in San<br />
Francisco.<br />
<strong>The</strong> race would occur during the shoulder season, as vessels transition from summer service in Alaska (mid-May<br />
to mid-September) to winter service in the Caribbean. While some ships are based in San Francisco, most are<br />
based in Vancouver. It is therefore feasible for ships heading south from Vancouver to stop in San Francisco to<br />
address <strong>America's</strong> <strong>Cup</strong> demand. As passenger counts drop <strong>of</strong>f toward the end <strong>of</strong> Alaska’s high season (around mid-<br />
August), attractive passenger loads in San Francisco could induce cruise lines to reposition their vessels earlier<br />
(in late August or early September) and stay longer. Vessels unable to be accommodated at San Francisco’s cruise<br />
terminal could potentially berth at alternative space on the waterfront, or anchor out on the <strong>Bay</strong> with shore access<br />
provided by tender. Typically, ships serving the market in this way would be chartered for the purpose.<br />
Serving the hotel market with cruise ships does come with a significant caveat. Although the Port <strong>of</strong> San Francisco<br />
estimates that every cruise ship visit brings between $500,000 and $1 million in revenue to the city, hotel<br />
services provided by the cruise lines may supplant services in the <strong>Bay</strong> <strong>Area</strong>, rather than supplement them, as<br />
general cruise operations do. For example, a visitor staying in a cruise ship and potentially eating on a cruise ship<br />
would have obtained those services on land if the cruise ship were not available. <strong>The</strong> cruise lines are likely to use<br />
their own employees to staff the vessels and may not obtain provisions from local suppliers. Although the staff<br />
would increase economic activity locally, their purchases would not likely <strong>of</strong>fset the reduced demand for hotel<br />
and restaurant services that result from the presence <strong>of</strong> floating hotels.<br />
Restaurants. Waterfront restaurants should particularly benefit from <strong>Cup</strong> activity, but to the extent that visitors<br />
stay multiple days, restaurants elsewhere in San Francisco and the region should also see gains. A recent study by<br />
American Express found that 53 to 54 cents, or roughly half <strong>of</strong> every visitor dollar spent by their cardholders in<br />
San Francisco, is spent on restaurants. While Amex cardholders may be more affluent at the margins, this factor<br />
may be equalized by the fact that the <strong>Cup</strong> will draw a significant number <strong>of</strong> international visitors, who spend more<br />
per capita than domestic ones. As a general expectation, restaurants will capture half <strong>of</strong> any increase in visitor<br />
spending in the city.<br />
Retail. Waterfront retail should particularly benefit from <strong>Cup</strong> activity, but as with restaurants, to the extent that<br />
visitors stay multiple days, retail at Union Square and elsewhere in the region should also receive a boost.<br />
11
Harbor Cruises. Spectators will book cruise vessels to watch the race. This will happen through organized cruises<br />
or charters. Vessel operators will benefit from the fact that races will be held during the day, which is normally a<br />
slack time (most <strong>Bay</strong> cruises take place at night).<br />
Pier 39. Historical data from Pier 39 (based on on-site ATM use,<br />
garage occupancy, restaurant covers, and <strong>Bay</strong> cruise passengers)<br />
indicates that visitor and local spending increases during<br />
major events, such as the All-Star Game on July 10, 2007, the<br />
1994 World <strong>Cup</strong> at Stanford, and Fleet Week. Evidence from<br />
Fleet Week indicates that activity at Pier 39 during the week<br />
<strong>of</strong> activities is about 25% higher than would otherwise be expected.<br />
4 This is a large increase, but it is undoubtedly constrained<br />
by the fact that restaurants, <strong>Bay</strong> cruise vessels, and parking ramps all have limited capacity. <strong>The</strong> <strong>America's</strong><br />
<strong>Cup</strong> can be expected to generate a similar surge in economic activity, but over a more extended period <strong>of</strong><br />
time.<br />
Airports. San Francisco International Airport (SFO) is the primary point <strong>of</strong> access for foreign travelers and many<br />
domestic visitors coming to watch <strong>America's</strong> <strong>Cup</strong> related matches. For California visitors who fly in from elsewhere<br />
in the state, the Oakland Airport (OAK) is an important alternative. Over the course <strong>of</strong> the three to four<br />
months <strong>of</strong> the <strong>America's</strong> <strong>Cup</strong> activities, it is possible that in excess <strong>of</strong> 450,000 spectators would fly into the area<br />
through either SFO or OAK. Although this is a relatively small number compared to the annual passenger volumes<br />
through these airports, it would represent a nearly 10% increase in deplanements at SFO during the peak season.<br />
Regional <strong>Impacts</strong><br />
<strong>The</strong> economic benefits <strong>of</strong> visitor and other activity related to the <strong>Cup</strong>,<br />
while concentrated in San Francisco, will extend to the entire <strong>Bay</strong> region<br />
and beyond, as visitors and their families visit the area for extended periods.<br />
This would apply to hotels in surrounding counties – particularly<br />
Marin, Solano, Contra Costa, Alameda, and San Mateo – that would absorb<br />
overflow hotel demand, and restaurants. Many visitors to the region,<br />
4 This comparison is relative to other weeks in October and the same week in years where there was no Fleet Week.<br />
12
when not watching the races or shopping and sightseeing in San Francisco, can be expected to enjoy nearby sites<br />
such as Sausalito, Muir Woods, and the Napa and Sonoma valleys. Some smaller number <strong>of</strong> visitors are also likely<br />
to visit destinations that are nearby but require an overnight stay, such as Monterey/Carmel, Lake Tahoe, and<br />
Yosemite. California Travel & Tourism Commission data shows that 30% <strong>of</strong> visitors to San Francisco visit other<br />
destinations in the region.<br />
As an example, the <strong>Bay</strong> <strong>Area</strong>'s Wine Region, primarily Napa<br />
and Sonoma counties, stands to benefit significantly from the<br />
<strong>America's</strong> <strong>Cup</strong>. Over the 3 to 4 month period during the challenger<br />
series, a Defender Series, and the defense, it is plausible<br />
that this region could see a net increase in local expenditures<br />
on the order <strong>of</strong> $68 million. This is based on figures <strong>of</strong> daily<br />
spending <strong>of</strong> $314 per day for those staying overnight and $187<br />
for those visiting for the day. 5 Spectators included in this estimate<br />
include roughly 50% <strong>of</strong> the local visitors discussed below and all <strong>of</strong> the non-local visitors. It is assumed that<br />
20% will visit wine country, and that 20% <strong>of</strong> those will choose to spend the night. <strong>The</strong>se percentages are likely<br />
low, as it is estimated that 20 to 25% <strong>of</strong> visitors to San Francisco from out <strong>of</strong> the <strong>Bay</strong> <strong>Area</strong> customarily visit Napa<br />
County, while a slightly lower percent also visit Sonoma County. All told, this spending could create as many as<br />
814 jobs and generate in excess <strong>of</strong> $8 million in state and local tax revenues.<br />
Twenty to twenty-five percent <strong>of</strong> visitors to San Francisco also visit Marin County. Those visiting for a day spend<br />
$135 to $150 per person in the local economy, while those staying overnight spend $320 to $400 per person per day.<br />
If the annual Oracle convention in San Francisco is an indication, Marin can be expected to particularly benefit<br />
from the <strong>America's</strong> <strong>Cup</strong>. Oracle World each year draws 40,000 attendees, many <strong>of</strong> whom can’t be accommodated<br />
in San Francisco. 35 to 40% stay elsewhere in the region, with Marin County being a primary beneficiary due to<br />
its proximity, as well as parking, rates, and overall setting.<br />
While the primary economic benefit to the region outside <strong>of</strong> San Francisco would come through visitor spending,<br />
it is also possible that not all syndicates will choose to locate their facilities in San Francisco. This might particularly<br />
be the case in the <strong>Cup</strong>'s early stages, when syndicates might seek a more secluded location where their<br />
evolving technology would be less visible to competitors. While this would apply to a handful <strong>of</strong> syndicates at<br />
5 This is an average <strong>of</strong> figures obtained for Napa and Sonoma counties individually.<br />
13
most, a number <strong>of</strong> locations around the <strong>Bay</strong> could <strong>of</strong>fer attractive venues, including Alameda (adjacent to the<br />
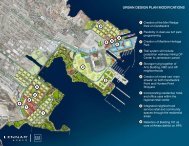
aircraft carrier Hornet) or Richmond. In Richmond's case, the Craneway Pavilion, a 1931 Ford plant recently renovated<br />
as a 525,000 square-foot structure housing <strong>of</strong>fices and large public spaces, fronts 600 feet <strong>of</strong> dock capacity<br />
facing toward San Francisco.<br />
Port <strong>of</strong> San Francisco<br />
Bringing the <strong>Cup</strong> to San Francisco presents a major<br />
opportunity for the Port. At the front end, the Port<br />
will incur up-front costs. On balance, however, the<br />
net gains to the Port promise to be substantial. This<br />
could take two primary forms: visitor revenue and infrastructure.<br />
Revenue. Approximately 80% <strong>of</strong> all visitors to the city utilize facilities on Port-owned property (e.g., the Ferry<br />
Building, Fisherman's Wharf, boat charters, water taxis, and parking), from which the Port earns tenant revenue.<br />
Infrastructure. As with all <strong>America's</strong> <strong>Cup</strong>s, facilities will have to be developed to house the racing syndicates in<br />
the period leading up to and during the race. <strong>The</strong>y are likely to be housed on rehabilitated pier structures along<br />
<strong>The</strong> Embarcadero. Rehabilitation <strong>of</strong> the specific pier or piers selected for the site (most likely Piers 30-32 and<br />
50) may help address a specific challenge faced by the Port <strong>of</strong> San Francisco − a $2 billion capital expenditure<br />
requirement to address accumulated deferred maintenance, prevent the further deterioration <strong>of</strong> the structures,<br />
and enable the constructive reuse <strong>of</strong> some <strong>of</strong> its aging piers. <strong>The</strong> estimated cost to bring Piers 30-32 up to code is<br />
between $40 million and $60 million. <strong>The</strong> estimated cost <strong>of</strong> bringing Pier 50 up to code is also in the $40 million<br />
to $60 million range.<br />
From an investment standpoint, the <strong>Cup</strong> could present the Port with a unique opportunity to engage private capital,<br />
through the organizing committee, in the redevelopment <strong>of</strong> one or more piers, along the lines <strong>of</strong> the model<br />
used to develop AT&T Park. Securing private investment to preserve and renovate the piers used for the <strong>Cup</strong> could<br />
alleviate the pressure on the Port’s capital budget, thereby freeing resources for other priorities. Given the economic<br />
benefits at stake, some level <strong>of</strong> public financing may be appropriate as well. Whatever financing method is<br />
ultimately chosen, the <strong>America's</strong> <strong>Cup</strong> would fast forward the renovation and development <strong>of</strong> the piers in question.<br />
14
Other infrastructure expenditures may come from the <strong>America's</strong> <strong>Cup</strong> organizing committee. <strong>The</strong>se could involve<br />
developments on other existing piers as well as landside.<br />
While probably not economically viable for exclusive use as a sailing center, the syndicate facilities have the potential<br />
for mixed-purpose reuse, for sailing and other maritime-oriented purposes, following the race.<br />
Estimating the Potential <strong>Economic</strong> <strong>Impacts</strong><br />
An <strong>America's</strong> <strong>Cup</strong> defense has substantial implications for the local economy. Estimating these impacts in advance<br />
<strong>of</strong> the event can only be undertaken with enormous speculation. This speculation applies to not only the format<br />
<strong>of</strong> the defense, but the likely spending by those directly involved, and the relative attraction <strong>of</strong> the location for<br />
spectators.<br />
<strong>The</strong> experience <strong>of</strong> Valencia in 2007 is taken as a starting point for this analysis. In December 2007, the Instituto<br />
Valenciano de Investigaciones <strong>Economic</strong>as (IVIE) released its final report with estimates <strong>of</strong> the economic impact<br />
on the City <strong>of</strong> Valencia resulting from the 32nd <strong>America's</strong> <strong>Cup</strong> defense earlier that year. Although a San Francisco<br />
defense would likely differ in significant ways from the Valencia event, there are sufficient similarities to warrant<br />
using evidence on expenditures for Valencia as a baseline for developing an estimate <strong>of</strong> impacts for San Francisco.<br />
In what follows, analysis does just that, modifying the actual experience <strong>of</strong> Valencia in subtle ways that reflect<br />
the potential differences.<br />
Much will be the same in San Francisco as it was in Valencia. In particular, the contributors to economic activity<br />
and their basic actions will be similar in nature, but potentially different in magnitude. Notably, it is likely that<br />
spectator volumes will be different, both in their number and in their expenditure patterns. Though not a significant<br />
destination in itself, Valencia benefited from its European location and its proximity to a large number<br />
<strong>of</strong> major population centers. Attendance was also supported by a stronger European sailing culture. While the<br />
West Coast lacks a comparably dynamic sailing scene and a comparably large cachement area from which to draw<br />
spectators, the San Francisco <strong>Bay</strong> has a number <strong>of</strong> inherent advantages that suggest that visitor numbers and<br />
expenditures will be considerably larger:<br />
A population <strong>of</strong> 7 million in the <strong>Bay</strong> <strong>Area</strong> (compared to 2.3 million in Valencia). resulting in stronger<br />
local attendance.<br />
15
Proximity to major West Coast cities, such as Los Angeles, San Diego, Seattle, and Vancouver, allows<br />
for easy access by air.<br />
<strong>The</strong> <strong>Bay</strong> <strong>Area</strong> and San Francisco's reputation as a leading international destination, will likely to<br />
attract more visitors for longer stays. 6<br />
<strong>The</strong> diversity <strong>of</strong> attractions in the <strong>Bay</strong> <strong>Area</strong> (Pier 39, Fisherman's Wharf, Alcatraz, Sausalito, Muir<br />
Woods, the Napa and Sonoma valleys, Monterey and Carmel, Lake Tahoe, and Yosemite), its food<br />
scene, and the rich range <strong>of</strong> cultural options (major museums, opera, ballet, and theater) also increase<br />
the likelihood that visitors, including more families and spouses than would otherwise be<br />
the case, will book longer stays.<br />
<strong>The</strong> international nature <strong>of</strong> the race also suggests that compared to other major sporting or entertainment events<br />
the <strong>Cup</strong> will attract a large number <strong>of</strong> foreign visitors, who historically stay longer and spend more per capita.<br />
Most overseas visitors would arrive and depart through SFO, which handles 67% <strong>of</strong> all passengers traveling by air<br />
through the <strong>Bay</strong> <strong>Area</strong>, and 96.9% <strong>of</strong> international passengers. SFO's status as a major international air hub, and its<br />
extensive network <strong>of</strong> direct connections to a large number <strong>of</strong> global destinations, will increase the likelihood <strong>of</strong><br />
strong international participation. SFO ranks seventh among U.S. airports in total number <strong>of</strong> international passengers,<br />
and together with Los Angeles is one <strong>of</strong> only two major international air gateways in California, reflecting<br />
the strength <strong>of</strong> the <strong>Bay</strong> <strong>Area</strong> as an international tourism and business destination. In addition to major domestic<br />
carriers with international operations (United maintains a major hub at SFO), the airport is served by 25 foreign<br />
flag carriers, providing convenient service and multiple options to travelers from Europe, Asia, the Middle East,<br />
Australia/Oceania, Canada, Mexico, the Caribbean, and South America.<br />
This section provides a discussion <strong>of</strong> the primary participating groups and their likely spending patterns. This is<br />
followed by a base estimate <strong>of</strong> the Defense's likely economic impact.<br />
Participating Agents<br />
This section evaluates the implications <strong>of</strong> expenditures by nine agents or groups, all <strong>of</strong> which participate in one<br />
way or another in an <strong>America's</strong> <strong>Cup</strong>. <strong>The</strong>se agents are listed in Table 2 and the patterns and magnitude <strong>of</strong> their<br />
expenditures are described in this section.<br />
6 <strong>The</strong> readers <strong>of</strong> Conde Nast Traveler voted San Francisco Best U.S. City in the magazine's 2009 Readers Choice Awards. <strong>The</strong> city has<br />
been ranked number one nationally for 19 out <strong>of</strong> 20 years, and sequentially for the last 17. San Francisco has been ranked either number<br />
one or number two on Travel and Leisure's list <strong>of</strong> Top Ten Cities in the United States and Canada every year since the poll began in 1996.<br />
16
Table 2: Participating Agents<br />
Agent<br />
Syndicates<br />
Sponsors<br />
Local Spectators<br />
Non-Local Spectators<br />
Media<br />
Local Governments<br />
<strong>The</strong> <strong>Cup</strong> Management Committee<br />
Super Yachts<br />
Other Groups<br />
Syndicates. Each <strong>of</strong> the boats that sail in either the challenger series, a Defender Series, or the defense is backed<br />
by a syndicate. That is, a group that has secured sufficient funding to mount a campaign. Campaigns are long and<br />
extremely expensive. <strong>The</strong>ir costs include, but are not limited to, the design and development <strong>of</strong> not just one but<br />
<strong>of</strong>ten several sailboats, the salary and living expenses for crew and support staff for several years, and sometimes,<br />
the construction <strong>of</strong> a structure in the host city on the water to house and maintain the sailboats. It is estimated<br />
that the syndicates in Valencia spent some 355 million euros ($540 million in today's dollars) locally in 2007.<br />
Table 3: Syndicate Spending Comparison (in millions)<br />
Category<br />
Valencia San Francisco SF 2013/14 +<br />
in 2010$ in 2013 Defender Series<br />
Accommodations 56.8 56.8 71.0<br />
Food and Drink 8.1 8.1 10.1<br />
Transport 9.5 9.5 11.9<br />
Retail 5.4 5.4 6.8<br />
Leisure 2.7 2.7 3.4<br />
Construction 256.9 20.0 25.0<br />
Marine Sector 148.7 20.0 25.0<br />
Media 31.1 31.1 38.9<br />
Services 5.4 5.4 6.8<br />
Not Classified 16.2 16.2 20.3<br />
Total 540.9 165.2 219.0<br />
In Valencia, there were 11 challengers and a single defender, or 12 different syndicates, who spent on average $45<br />
million locally. It is expected that the number <strong>of</strong> challenging syndicates will be similar in San Francisco, but that<br />
the addition <strong>of</strong> a Defender Series could be expected to increase the overall number <strong>of</strong> syndicates by as many as<br />
four. Previous Defender Series have had either three or four domestic syndicates in addition to the <strong>Cup</strong> defender.<br />
17
This analysis assumes that three additional domestic challengers participate in the Defender Series, for a total <strong>of</strong><br />
15 syndicates.<br />
<strong>The</strong> assumption regarding syndicate spending during a San Francisco-based <strong>Cup</strong> is that it would be comparable to<br />
Valencia, except in two respects. First, there was a significant investment in infrastructure in Valencia. It is not<br />
anticipated that each syndicate will make a massive investment in individual hospitality suites in San Francisco.<br />
In particular, there is likely to be insufficient space for such structures on the piers. Instead, smaller structures,<br />
catering to the storage, maintenance, and repair <strong>of</strong> the sailboats would likely be constructed on the piers, the<br />
construction <strong>of</strong> which could cost as much as $25 million − significantly less than the $257 million that was spent<br />
in Valencia.<br />
Second, it is unlikely that the large expenditures in the marine sector that are recorded for Valencia would occur<br />
in San Francisco. Accordingly, $25 million in spending, rather than the $149 million spent in Valencia, has been<br />
allocated to this sector. It is likely that most <strong>of</strong> these expenses would be sourced from outside <strong>of</strong> the <strong>Bay</strong> <strong>Area</strong>.<br />
Nonetheless, there would be significant expenditures in the local marine sector. In particular, the maintenance<br />
and repair <strong>of</strong> the 15 to 20 hard bottom inflatable boats, or tenders, per team would likely be undertaken by local<br />
suppliers <strong>of</strong> marine services. In the end, syndicate spending remains significant, at $219 million, but is much less<br />
than is estimated to have occurred in Valencia.<br />
Sponsors. Corporate sponsors <strong>of</strong> <strong>America's</strong> <strong>Cup</strong> teams/syndicates can be expected to invite major clients to San<br />
Francisco for a range <strong>of</strong> hosted activities, including hospitality at the syndicates' VIP centers and cruises to watch<br />
the races, generating spending on food, transportation, and hotels. Bigger syndicates typically secure larger sponsors.<br />
Large sponsors may invest several million dollars each, while smaller sponsors should be in the range <strong>of</strong> one<br />
million. <strong>The</strong>se funds will not be directly accounted for in the impact analysis as a significant portion is not spent<br />
locally. <strong>The</strong> sponsorship funds spent locally are accounted for in the expenditures <strong>of</strong> individual syndicates.<br />
In Valencia, on days with major activity, large syndicates such as Oracle hosted as many as 200 guests, while lesser<br />
syndicates hosted smaller groups averaging approximately 40. <strong>The</strong>se expenditures are implicitly included in the<br />
analysis as a part <strong>of</strong> syndicate spending.<br />
<strong>Cup</strong> Management. A defender-run entity will likely be created to manage commercial aspects <strong>of</strong> the race, including<br />
vessel berths, branding, and television rights. Much <strong>of</strong> this activity will not accrue benefits directly to<br />
the region. However, a significant amount will still be spent locally. It was estimated that 95 million euros ($145<br />
18
million in inflation-adjusted dollars) were spent in Valencia. It is expected that expenditures in San Francisco<br />
would be comparable. Expenditures would differ in one important aspect: Much <strong>of</strong> the port structure spending<br />
that in Valencia '07 was the responsibility <strong>of</strong> the individual syndicates will likely be centralized in San Francisco.<br />
In particular, this organization may take on the responsibility <strong>of</strong> providing infrastructure for common spaces,<br />
including a hospitality suite.<br />
Media. Members <strong>of</strong> the press from all over the world are present for an <strong>America's</strong> <strong>Cup</strong>. Spending on lodging,<br />
transportation, and other expenses are reported to have amounted to some 11.5 million euros in Valencia, or<br />
some $13.8 million in today's dollars. <strong>The</strong>re is no reason to believe that media expenditures will be less than this<br />
in San Francisco. Rather, it is likely that they will be more. Given the venue, the San Francisco <strong>Bay</strong> amphitheater,<br />
broadcasting the races is likely to be significantly more desirable for media around the world. As such, 25%<br />
increase in media expenditures is built into the analysis.<br />
In Valencia, it was estimated that 1,870 people were media accredited during the LVC and that each person stayed<br />
an average <strong>of</strong> 37 days. Similarly, during the <strong>America's</strong> <strong>Cup</strong> <strong>Match</strong>, some 1,460 were accredited, staying an average<br />
<strong>of</strong> 8 days. In total, this represents 80,130 days that individual members <strong>of</strong> the media were in place. For the San<br />
Francisco defense, this analysis assumings that 25% more media will be on hand. This assumption is largely based<br />
on the notion that the <strong>Bay</strong> is a much better stage for the event and that media coverage will be more pr<strong>of</strong>itable,<br />
resulting in a larger media presence.<br />
<strong>The</strong>re is past precedent for media coverage <strong>of</strong> such an event in San Francisco. During the Moët <strong>Cup</strong> in September<br />
2003, some 177 journalists from 27 nations covered the races, including 20 television channels from the United<br />
States and abroad. Although the numbers are much smaller for the Moët <strong>Cup</strong> than was the case for the <strong>America's</strong><br />
<strong>Cup</strong> <strong>Match</strong> in Valencia, it must be remembered that the Moët <strong>Cup</strong> was an exhibition race with very little at stake<br />
other than the pride <strong>of</strong> the participants.<br />
Super Yachts. It has traditionally been the case that where the <strong>America's</strong> <strong>Cup</strong> goes, a fleet <strong>of</strong> super yachts follows.<br />
Super Yachts are typically in excess <strong>of</strong> 150 feet in length, with three decks, and sleeping quarters for 10 to 12<br />
people. <strong>The</strong>y are fully crewed and are generally positioned somewhere in the world where their owners will want<br />
to be spending time. For many owners, this tends to be in the vicinity <strong>of</strong> an <strong>America's</strong> <strong>Cup</strong> defense, when they<br />
occur. It is estimated that at least 40 different super yachts spent some 3,327 total days present in Valencia over<br />
the course <strong>of</strong> Acts held in Valencia, the Louis Vuitton <strong>Cup</strong>, and <strong>America's</strong> <strong>Cup</strong> <strong>Match</strong>. Of these, the super yachts<br />
were in Valencia 1,920 days during the Louis Vuitton and <strong>America's</strong> <strong>Cup</strong> <strong>Match</strong>.<br />
19
For San Francisco, this analysis assumes the occurrence <strong>of</strong> the Challenger Selection Series, a Defender Series, and<br />
the <strong>America's</strong> <strong>Cup</strong> <strong>Match</strong>. San Francisco is not likely to be the draw for super yachts that Valencia was. Valencia is<br />
on the Mediterranean, in close proximity to a great many super yachts. San Francisco, in contrast, is an infrequent<br />
destination for super yachts, partly owing to the weather and partly owing to the distance to other likely points<br />
<strong>of</strong> interest for owners. Accordingly, it is assumed that expenditures in support <strong>of</strong> super yachts will be half <strong>of</strong> what<br />
they were in Valencia.<br />
Table 4: Comparison <strong>of</strong> Super Yacht Expenditures ($)<br />
Category Valencia San Francisco<br />
Marine Sector 10, 923, 769 6, 203, 184<br />
Retail 7, 135, 153 4, 051, 776<br />
Accommodations 1, 673, 269 950, 184<br />
Ground Transport 128, 203 72, 801<br />
Air Transport 70, 733 40, 166<br />
Concierge 828, 898 470, 699<br />
Leisure 1, 286, 450 730, 524<br />
Other 57, 470 32, 635<br />
Total 22, 103, 944 12, 551, 969<br />
Adjusting for a defender's series, which did not occur in Valencia, overall super yacht expenditures would be<br />
expected to be on the order <strong>of</strong> $12.5 million.<br />
Spectators. Large numbers <strong>of</strong> sailing fans flock to the venue <strong>of</strong> an <strong>America's</strong> <strong>Cup</strong> defense. <strong>The</strong>se spectators naturally<br />
come from both the local region and from locations around the world. Here, a distinction is drawn between<br />
local and non-local depending on the driving distance. Local spectators throughout the analysis are those within<br />
driving range <strong>of</strong> San Francisco and non-local spectators are those flying in for the events.<br />
Non-Local Visitors. Spectators flying into the <strong>Bay</strong> <strong>Area</strong>, both domestic and international, represent<br />
a significant source <strong>of</strong> spending. This analysis assumes that the number <strong>of</strong> spectators will be<br />
20% greater than was the case in Valencia, and that they will add some 450,000 additional visitors<br />
to San Francisco during the summer <strong>of</strong> 2013 or 2014. It is assumed that expenditures <strong>of</strong> this group<br />
are equivalent to those <strong>of</strong> the foreign visitors in Valencia, but that the pattern <strong>of</strong> spending is distributed<br />
across expenditure categories in the same way as has been observed for those flying in to<br />
visit San Francisco.<br />
20
It is quite likely that hosting the <strong>Cup</strong> in 2013 or 2014 will lead to additional tourism activity in the<br />
several years following the <strong>America's</strong> <strong>Cup</strong>, but evidence on this phenomenon is highly speculative.<br />
Accordingly, there is no attempt to measure it here.<br />
Local Visitors. In this study, "local" visitors are those who are within driving distance <strong>of</strong> San Francisco<br />
<strong>Bay</strong>. This assumption is made largely because the data on spending patterns and on arrivals<br />
at San Francisco Airport (SFO) do not distinguish between foreign and domestic arrivals. <strong>The</strong> only<br />
distinction possible is between those coming by ground transportation and those arriving by air.<br />
<strong>The</strong> San Francisco <strong>Bay</strong> region has a population <strong>of</strong> approximately 7 million people. In 2007, the population<br />
base surrounding Valencia, and the rest <strong>of</strong> Spain, contributed in excess <strong>of</strong> 1 million visitor<br />
days. It is anticipated that the <strong>Bay</strong> <strong>Area</strong> and broader California will contribute significantly more<br />
spectators than did Valencia and Spain. This is anticipated first because the population here is in<br />
such close proximity to the events, and second because incomes are significantly higher in the <strong>Bay</strong><br />
<strong>Area</strong> and California than they are in Valencia and throughout Spain. Higher incomes facilitate the<br />
attendance at such spectator events, if even for a day or several days.<br />
Accordingly, local visitors will make up the bulk <strong>of</strong> the spectators for the <strong>America's</strong> <strong>Cup</strong>, as they<br />
have frequently in the past. It should be noted that an individual visitor day contributed by a local<br />
resident drives significantly less economic activity per day than does that <strong>of</strong> a spectator who has<br />
traveled from afar. It is estimated that local visitors spend on average 42% <strong>of</strong> the amount spent by<br />
non-local visitors. <strong>The</strong> difference is largely due to lower expenditures on accommodations.<br />
It is common to discount spending by truly local participants. In particular, it is likely that spending<br />
by residents <strong>of</strong> San Francisco would have occurred anyway. <strong>The</strong>se expenditures are excluded<br />
from the analysis. Similar assumptions are made for the <strong>Bay</strong> <strong>Area</strong>, California, and U.S. model results<br />
presented below. In addition, spectators who are in San Francisco for other reasons must have<br />
their expenditures discounted. As no data are available locally to facilitate these adjustments, it is<br />
assumed that the patterns <strong>of</strong> local spectators and those in San Francisco for other purposes are in<br />
the same proportion as was the case for Valencia.<br />
21
Although the discounting is taken from the analysis <strong>of</strong> Valencia, the spending patterns <strong>of</strong> spectators<br />
in San Francisco are assumed to more closely reflect the usual spending patterns <strong>of</strong> local<br />
(ground) versus non-local (air) arriving spectators.<br />
Additional Visitor Spending. In addition to visitors simply coming to San Francisco to watch the<br />
matches, spectators will come for other reasons and extend their visits. <strong>The</strong>y will also make side<br />
trips to other regional destinations around the <strong>Bay</strong> <strong>Area</strong>. <strong>The</strong>se expenditures are relatively minimal<br />
and are incorporated at exactly the same rate <strong>of</strong> increase in spending as was experienced in<br />
Valencia.<br />
Local Governments. <strong>The</strong> estimated economic impact <strong>of</strong> the <strong>America's</strong> <strong>Cup</strong> in Valencia '07 was on the order <strong>of</strong><br />
5.77 billion euros, or $8.6 billion in today's currency. 7 <strong>The</strong> bulk <strong>of</strong> this impact was generated by public expenditures.<br />
<strong>The</strong> holding <strong>of</strong> the <strong>America's</strong> <strong>Cup</strong> was seen as an opportunity and a justification to build up Valencia's port<br />
area to be a more significant tourist destination. To that end, the local, regional, and federal governments made<br />
infrastructure investments amounting to more than 2 billion euros, or $3.2 billion in today's currency. <strong>The</strong>se expenditures<br />
accounted for nearly 80% <strong>of</strong> the total impact. <strong>The</strong> absence <strong>of</strong> such enormous government spending in<br />
San Francisco implies a much smaller overall impact − and cost − <strong>of</strong> the event.<br />
Such expenditures are neither needed nor anticipated in San Francisco. <strong>The</strong> vast majority <strong>of</strong> the required infrastructure<br />
is already present. Where investments are likely to be made is in shoring up piers at the San Francisco<br />
Port to provide boat storage and maintenance facilities for the syndicates. Such expenditures are likely to be on<br />
the order <strong>of</strong> $100 million.<br />
Additional Spending. An additional category is added here to incorporate spending that could occur during the<br />
events related to the <strong>America's</strong> <strong>Cup</strong>, but is not included in the other categories listed above. This primarily involves<br />
the spending <strong>of</strong> the owners <strong>of</strong> vessels actively participating in the spectator fleet, including local privately<br />
owned sailboats and powerboats as well as the Hornblower and other ferries and vessels that will be plying the<br />
waters carrying passengers as they watch the matches. It is estimated that during the three months <strong>of</strong> sailing,<br />
some $20 million in spending in the marine services sector could accrue.<br />
7 This is an adjustment <strong>of</strong> approximately 150%, incorporating differences in the prevailing exchange rate and inflation between 2007<br />
and 2010.<br />
22
<strong>The</strong> <strong>Economic</strong> Impact<br />
This section provides a summary <strong>of</strong> economic impact by participant category. Expenditures <strong>of</strong> the magnitude<br />
being discussed in this report have the potential to generate significant increases in economic output, local employment,<br />
and government tax revenues. <strong>The</strong>se effects are measured as having three separate impacts. First, there<br />
is a direct effect: how many jobs and how much in tax revenues are directly linked to these expenditures. Second,<br />
there is an indirect effect: when a restaurant sells 100 orders <strong>of</strong> clam chowder in a bread bowl, this stimulates<br />
activity directly at the restaurant, but indirectly at the bakeries that provide the bread bowls. Finally, there is<br />
an induced effect that results from the employees at the restaurant and at the bakery spending their increased<br />
salaries. 8 A summary <strong>of</strong> the economic impacts on the city <strong>of</strong> San Francisco and the county is presented here; the<br />
impact <strong>of</strong> spending by each <strong>of</strong> the agents is presented in Appendix A.<br />
<strong>The</strong> groups contributing expenditures come from the eight separate sources above. Combining the expenditures<br />
<strong>of</strong> the various groups participating in or watching the Challenger Selection Series, a Defender Series, and <strong>America's</strong><br />
<strong>Cup</strong> matches, something on the order <strong>of</strong> $791 million could be spent (Table 5). This spending translates into<br />
a total effect on output (the value <strong>of</strong> goods and services purchased) in San Francisco alone <strong>of</strong> $1.4 billion.<br />
Table 5: Summary <strong>of</strong> <strong>Impacts</strong> by Agents ($)<br />
Agents<br />
Output Employment State and Local Taxes<br />
Direct Total Direct Total Direct Total<br />
<strong>Cup</strong> Management 195, 209, 743 375, 107, 605 1, 069.6 2, 004.5 5, 958, 929 19, 132, 953<br />
Syndicates 215, 750, 002 367, 908, 027 1, 527.8 2, 285.8 12, 975, 508 22, 807, 510<br />
Local Visitors 150, 385, 104 252, 078, 310 1, 686.3 2, 180.8 13, 139, 999 19, 907, 632<br />
Infrastructure 100, 000, 000 158, 879, 003 463.9 770.5 2, 365, 924 6, 575, 387<br />
NonLocal Visitors 86, 144, 734 144, 331, 099 897.3 1, 182.6 7, 766, 267 11, 601, 341<br />
Media 25, 664, 760 44, 751, 286 170.7 265.6 1, 911, 107 3, 156, 750<br />
Super Yachts 11, 280, 566 18, 549, 197 64.7 99.7 778, 184 1, 257, 411<br />
Miscellaneous 5, 000, 000 8, 047, 683 15.7 30.0 115, 081 331, 835<br />
Side Trips 997, 871 1, 672, 720 9.9 12.3 88, 790 132, 592<br />
Extended Visits 650, 070 1, 089, 705 6.5 7.6 57, 843 86, 377<br />
Total 791, 082, 851 1, 372, 414, 635 5, 912.3 8, 839.4 45, 157, 632 84, 989, 787<br />
Along with these expenditures, the equivalent <strong>of</strong> almost 9,000 year-long, full-time positions would be created and<br />
$85 million in additional state and local tax revenues would be collected.<br />
8 see Appendix B for more on the model and methods used.<br />
23
Table 6: Summary <strong>of</strong> <strong>Impacts</strong> by Industry ($)<br />
Top 10 Industries<br />
Output<br />
Employment<br />
Direct Total Direct Total<br />
Construction Of Other New Nonresidential Structures 233, 757, 818 233, 757, 818 1, 084.5 1, 084.5<br />
Accommodations 156, 329, 540 157, 006, 043 973.4 977.5<br />
Food Svcs. And Drinking Places 90, 140, 057 113, 348, 453 1, 201.5 1, 511.1<br />
Advertising And Related Svcs. 69, 785, 559 84, 294, 066 397.5 480.3<br />
Retail Trade 55, 047, 639 85, 585, 428 484.5 753.6<br />
Leisure 40, 022, 940 51, 462, 945 443.1 570.0<br />
Marine Sector 38, 249, 646 38, 250, 690 113.8 113.8<br />
Transit And Ground Passenger Transportation 32, 625, 534 33, 092, 947 743.7 754.1<br />
Other Support Svcs. 28, 200, 057 30, 416, 886 142.0 153.2<br />
Facilities Support Svcs. 21, 432, 045 21, 484, 897 197.1 197.5<br />
Total 791, 082, 851 1, 372, 414, 635 5, 912.3 8, 839.4<br />
By industry, the clear winner is "construction <strong>of</strong> other new nonresidential structures", which would experience a<br />
boost in output <strong>of</strong> $234 million and an increase in employment <strong>of</strong> some 1,276 jobs. <strong>The</strong>se gains come from spending<br />
by syndicates ($27.7 million), <strong>Cup</strong> management ($106.1 million), and local governments ($100 million) in the form<br />
<strong>of</strong> infrastructure investments. "Accommodations" would see a significant increase in demand <strong>of</strong> $156 million. <strong>The</strong><br />
largest contributors are again syndicates ($80.4 million), local spectators ($39.9 million), and non-local spectators<br />
($31.1 million). Although non-local visitors are much more likely to spend on accommodations, the sheer number<br />
<strong>of</strong> local visitors causes their contribution to be larger.<br />
Of the participants in the <strong>America's</strong> <strong>Cup</strong> <strong>Match</strong> and<br />
the events leading up to the defense, each category<br />
contributes significantly. Figure 1 illustrates that<br />
the <strong>Cup</strong> management and syndicates each provide<br />
roughly 27% <strong>of</strong> the total increase in local economic<br />
output. Combining local and non-local spectators,<br />
another 28% <strong>of</strong> expenditures are accounted for. Local<br />
infrastructure spending and the media are the<br />
remaining significant sources <strong>of</strong> benefit.<br />
<strong>Cup</strong> Management<br />
Syndicates<br />
Local Visitors<br />
Infrastructure<br />
Non-Local Visitors<br />
Media<br />
Super Yachts<br />
Miscellaneous<br />
Side Trips<br />
Extended Visits<br />
0 10 20 30<br />
Agent Share <strong>of</strong> Direct Expenditures (%)<br />
Figure 1: Distribution <strong>of</strong> Sources <strong>of</strong> Expenditures<br />
24
Implications for New Tax Revenues for the San<br />
Francisco General Fund<br />
In Table 5, the results indicate that direct spending as a result <strong>of</strong> the <strong>America's</strong> <strong>Cup</strong> will generate $45 million in<br />
state and local sales taxes. Factoring in the indirect and induced effects, the total tax revenues for state and local<br />
governments are nearly $85 million. Although the model results provided above do not distinguish between state<br />
and local taxes, the city's additional tax revenues can be calculated for some major revenue sources. In particular,<br />
retail sales taxes, payroll taxes, and the hotel or transient occupancy tax are likely to generate significant<br />
revenues.<br />
In Table 6, the revenues for accommodations are in excess <strong>of</strong> $156 million. In San Francisco, the transient occupancy<br />
tax (TOT) is 14%. This implies total additional revenues for the city from hotel stays <strong>of</strong> $12.4 million (Table<br />
7). Payroll taxes are the second largest category <strong>of</strong> revenues, with an estimated increase to the city <strong>of</strong> $8.3 million.<br />
<strong>The</strong>se taxes are collected at a rate <strong>of</strong> 1% from for-pr<strong>of</strong>it businesses in the city with payrolls above $250,000.<br />
Though data on the size <strong>of</strong> the businesses that would experience an increase in payroll are not available, the city<br />
uses a standard multiplier <strong>of</strong> 85% <strong>of</strong> anticipated payroll increases. That is, it is expected that 85% <strong>of</strong> any increase<br />
in city payrolls would be subject to the payroll tax. This multiplier is also used here. <strong>The</strong> numbers presented in the<br />
table are equal to .0085 times the increase in expected employee income. 9 Sales tax revenues in this category are<br />
from restaurant and retail sales. Although expenditures in this category are larger, $182 million, the tax rate is<br />
only 1.75%. In addition, it is assumed that 15% <strong>of</strong> expenditures at restaurants are for tips, which are not subject to<br />
sales taxes. Accordingly, sales tax revenues attributable to the <strong>America's</strong> <strong>Cup</strong> will be on the order <strong>of</strong> $3.2 million.<br />
<strong>The</strong> total impact identified here is approximately $24 million.<br />
It is also important to acknowledge the increasd demand for city services that comes with events such as Fleet<br />
Week or an <strong>America's</strong> <strong>Cup</strong> defense. <strong>The</strong>se services are necessary to ensure that spectators have a safe and enjoyable<br />
experience while in the city. Chief among these are police and transportation services. It is also reasonable<br />
to assume that while in the city, many tourists would avail themselves <strong>of</strong> the many cultural and recreational<br />
opportunities, which imposes a further cost to the city.<br />
9 Although the present model provides estimates <strong>of</strong> compensation, on average wages, or payroll, is 70% <strong>of</strong> compensation. This adjustment<br />
is also made.<br />
25
In its 2008-09 budget, the city <strong>of</strong> San Francisco spent some $1.1 billion providing police, transportation, and cultural/recreational<br />
services. 10 <strong>The</strong>re are no standard estimates for the amount <strong>of</strong> this spending that is attributable<br />
to tourism services. However, in 2009, there were on average 131,722 visitors in San Francisco each day. 11 With an<br />
estimated population <strong>of</strong> 808,000, visitors make up 16% <strong>of</strong> those who might potentially demand these city services.<br />
Assuming that tourists use these services more intensively than the local population, it is assumed that 20% <strong>of</strong> the<br />
$1.1 billion, or $220 million in spending is related to tourism in San Francisco. Estimate suggest that the <strong>America's</strong><br />
<strong>Cup</strong> will lead to an approximately 5% increase in tourism related spending. If this is equivalent to a 5% increase in<br />
tourism, this suggests an increase in city costs <strong>of</strong> 5% <strong>of</strong> $220 million, or $11 million. Given this rough calculation,<br />
it appears that the city's general fund stands to benefit (net) by as much as $13 million. 12<br />
Table 7: City Tax Revenues Attributable to the <strong>America's</strong> <strong>Cup</strong><br />
Revenue Source Direct Total<br />
Transient Occupancy Tax (Hotel) 12, 340, 581 12, 414, 895<br />
Payroll Taxes 5, 036, 226 8, 328, 286<br />
Retail Sales Taxes 2, 304, 167 3, 183, 803<br />
Total 19, 680, 974 23, 926, 984<br />
Employment Effects by Occupation<br />
All <strong>of</strong> this economic activity generates demand for a significant number <strong>of</strong> workers, nearly 9,000 in total. 13 <strong>The</strong><br />
jobs will be distributed widely across occupations. Food care and serving-related occupations benefit most, accounting<br />
for nearly 25% <strong>of</strong> all jobs created. <strong>The</strong> jobs created range from high-wage to low-wage jobs, with an<br />
average annual wage for the jobs created <strong>of</strong> $59,724. This is substantially below the average wage in San Francisco<br />
<strong>of</strong> more than $75,000. <strong>The</strong> largest category <strong>of</strong> jobs created is in the "food preparation and serving-related category".<br />
<strong>The</strong>se are among the lowest-paying jobs in the city, with average wages <strong>of</strong> just $27,827. Other occupations<br />
experiencing an increase in demand are "<strong>of</strong>fice and administrative support" and "sales and related" occupations.<br />
<strong>The</strong> <strong>of</strong>fice support jobs again pay substantially below local average wages.<br />
10 This breaks down into $786 million on public protection, $196 million on the Municipal Transportation Agency (MTA), and $104 million<br />
on culture and recreation. <strong>The</strong> figure for the MTA surely overstates the net cost to the city as what fares are collected <strong>of</strong>fset these<br />
expenses.<br />
11 http://www.sfcvb.org/media/downloads/research/2009_spending.pdf<br />
12 This number is too high if there are capital expenses or other non-operating expenses that must be incurred by the city to accommodate<br />
this increase in tourism.<br />
13 Note that this total does not include the jobs <strong>of</strong> those working directly for the syndicates as crew, mechanics, or in other technical<br />
capacities. <strong>The</strong>se jobs are not likely to come from the local economy. It does include those providing food services and other local services<br />
directly to the syndicates.<br />
26
Table 8: Summary <strong>of</strong> Occupational <strong>Impacts</strong><br />
Average Annual<br />
Top 10 Occupations Employment Wages ($)<br />
Architecture and Engineering 106 77, 138<br />
Arts, Design, Entertainment, Sports, and Media 270 64, 903<br />
Building and Grounds Cleaning and Maintenance 378 29, 635<br />
Business and Financial Operations 523 79, 305<br />
Community and Social Services 43 49, 404<br />
Computer and Mathematical 304 83, 837<br />
Construction and Extraction 777 56, 255<br />
Education, Training, and Library 156 53, 840<br />
Farming, Fishing, and Forestry 5 38, 443<br />
Food Preparation and Serving-Related 2, 099 27, 827<br />
Healthcare Practitioners and Technical 105 78, 065<br />
Healthcare Support 44 37, 480<br />
Installation, Maintenance, and Repair 150 51, 740<br />
Legal 133 123, 958<br />
Life, Physical, and Social Science 79 77, 026<br />
Management 601 131, 587<br />
Office and Administrative Support 1, 221 44, 107<br />
Personal Care and Service 248 32, 656<br />
Production 107 37, 624<br />
Protective Service 142 39, 707<br />
Sales and Related 1, 058 65, 135<br />
Transportation and Material Moving 289 34, 251<br />
All Occupations 8, 839 59, 724<br />
Results for the <strong>Bay</strong> <strong>Area</strong>, California, and the United States<br />
In the results presented above, only the local economic impacts on San Francisco have been estimated. When considering<br />
such a small part <strong>of</strong> the economy, the economic multipliers are smaller than if the entire state or nation<br />
were to be considered. <strong>The</strong> subregional multipliers are lower because <strong>of</strong> leakage. Leakage has no impact on the<br />
direct economic impacts, as those are the result <strong>of</strong> local expenditures. However, indirect and induced impacts<br />
are significantly affected by leakage because intermediate inputs, or purchases that come about as a result <strong>of</strong> the<br />
direct expenditures, may result in indirect effects outside <strong>of</strong> the local area. For example, cruise ships that dock<br />
at the Port <strong>of</strong> San Francisco may re-provision at the port, but from the contents <strong>of</strong> containers that are shipped<br />
to the port from outside <strong>of</strong> the region. <strong>The</strong>refore, the indirect effects and some <strong>of</strong> the induced effects will accrue<br />
outside <strong>of</strong> the city and county.<br />
27
In order to better account for this leakage, the effects <strong>of</strong> the three months leading up to the <strong>America's</strong> <strong>Cup</strong> on the<br />
broader <strong>Bay</strong> <strong>Area</strong>, California, and the United States are also evaluated. <strong>The</strong>se results, comparable to Table 6, are<br />
presented below. As the geography gets bigger, the economic benefits increase.<br />
As discussed above, expenditures <strong>of</strong> local spectators in the San Francisco analysis are discounted by excluding<br />
the spending <strong>of</strong> those who live in San Francisco and those who came to San Francisco for other reasons − their<br />
expenditures would have happened regardless <strong>of</strong> the <strong>America's</strong> <strong>Cup</strong>. Similarly, when the analysis is expanded to<br />
successively larger geographies, spectator expenditures must be further discounted. <strong>The</strong> pattern <strong>of</strong> discounting<br />
used in this report is presented below. It is assumed that <strong>of</strong> the local visitors (those who drove to San Francisco),<br />
50% are from the broader <strong>Bay</strong> <strong>Area</strong>. <strong>The</strong>refore, 50% <strong>of</strong> the local spectator expenditures were discounted for the<br />
<strong>Bay</strong> <strong>Area</strong> impact analysis.<br />
Table 9: Assumptions Regarding Spectator Spending<br />
(Percentage that is included in the analysis.)<br />
Type San Francisco <strong>Bay</strong> <strong>Area</strong> California United States<br />
Local 100 50 0 0<br />
Non-Local 100 100 90 50<br />
In particular, it is assumed that half <strong>of</strong> the local visitors are from the <strong>Bay</strong> <strong>Area</strong> (the nine-county region) and that<br />
the other half is from the rest <strong>of</strong> California. Accordingly, their expenditures are completely ignored in the results<br />
pertaining to California. Similarly, the results incorporate the assumption that 10% <strong>of</strong> the non-local visitors,<br />
those arriving by air, are from California and that 40% are from the rest <strong>of</strong> the United States, with foreign visitors<br />
making up the remaining 50%.<br />
Table 10 summarizes the differences and the subsequent tables provide more detail. Each row <strong>of</strong> the table presents<br />
the economic impact on the respective region. <strong>The</strong> total effect in San Francisco is $1.372 billion, while the overall<br />
effect in the United States is $1.851 billion.<br />
Note that as broader geographies are considered, the direct effects decline. This is a result <strong>of</strong> the assumptions<br />
above regarding spectator expenditures. <strong>The</strong>se declines are significant, with direct expenditures for the country<br />
as a whole being nearly $200 million less than when only the city and county <strong>of</strong> San Francisco is considered. 14<br />
14 This is because visitors to San Francisco from Illinois provide spending in San Francisco that wouldn't otherwise occur, but it is assumed<br />
that if they had not come to San Francisco, they would have travelled to some other U.S. destination. <strong>The</strong>refore, the spending <strong>of</strong><br />
all U.S. spectators is excluded from the analysis <strong>of</strong> the United States, where some $200 million <strong>of</strong> it is included as new spending when only<br />
San Francisco is considered.<br />
28
Nonetheless, because <strong>of</strong> reduced leakage, the total effect on output increases with the size <strong>of</strong> the geography. When<br />
the entire country is considered, the total impact includes a 35% increase in output and employment relative to<br />
looking at San Francisco in isolation. Taxes collected also increase, but at a slower rate. This is because spectators<br />
generate significant tax revenues, while other agents generate less in the way <strong>of</strong> taxes per dollar spent. 15<br />
Table 10: Summary <strong>of</strong> <strong>Impacts</strong> Across Regions<br />
Agents<br />
Output ($) Employment State and Local Taxes ($)<br />
Direct Total Direct Total Direct Total<br />
San Francisco 791, 082, 851 1, 372, 414, 635 5, 912.3 8, 839.4 45, 157, 632 84, 989, 787<br />
<strong>Bay</strong> <strong>Area</strong> 715, 931, 256 1, 389, 152, 152 5, 473.5 8, 813.5 41, 834, 573 86, 851, 593<br />
California 632, 083, 271 1, 427, 385, 764 4, 806.0 9, 213.9 33, 220, 020 85, 076, 668<br />
United States 597, 625, 374 1, 851, 978, 699 4, 956.7 11, 978.0 25, 105, 087 92, 652, 707<br />
Table 11: <strong>Bay</strong> <strong>Area</strong> Summary <strong>of</strong> <strong>Impacts</strong> by Industry<br />
Top 10 Industries<br />
Output ($)<br />
Employment<br />
Direct Total Direct Total<br />
Construction <strong>of</strong> other new nonresidential structures 233, 757, 818 233, 757, 818 1, 148.1 1, 148.1<br />
Accommodations 136, 454, 961 137, 043, 627 1, 037.9 1, 042.3<br />
Advertising and related svcs. 69, 785, 559 76, 132, 808 460.4 499.7<br />
Food svcs. and drinking places 63, 425, 957 83, 949, 204 942.0 1, 246.3<br />
Retail Trade 43, 021, 166 77, 864, 208 432.9 779.5<br />
Marine Sector 38, 249, 645 38, 311, 745 126.0 126.2<br />
Leisure 29, 799, 897 40, 258, 258 329.4 444.5<br />
Other support svcs. 28, 200, 057 30, 133, 259 139.9 149.0<br />
Transit and ground passenger transportation 26, 312, 134 27, 254, 942 460.7 477.2<br />
Facilities support svcs. 21, 432, 045 21, 598, 937 203.0 204.5<br />
Total 715, 931, 256 1, 389, 152, 157 5, 473.4 8, 797.4<br />
15 In particular, note from Table 10 that although direct spending by the <strong>Cup</strong> management organization is projected to be 30% higher<br />
than local visitors in San Francisco, local visitors actually generate more state and local taxes.<br />
29
Table 12: California Summary <strong>of</strong> <strong>Impacts</strong> by Industry<br />
Top 10 Industries<br />
Output ($)<br />
Employment<br />
Direct Total Direct Total<br />
Construction <strong>of</strong> other new nonresidential structures 233, 757, 818 233, 757, 818 1, 275.7 1, 275.7<br />
Accommodations 113, 432, 308 114, 706, 553 960.0 970.7<br />
Advertising and related svcs. 69, 785, 559 77, 185, 882 454.1 502.4<br />
Marine Sector 38, 249, 645 38, 362, 418 125.0 125.3<br />
Food svcs. and drinking places 34, 411, 252 58, 928, 919 552.0 943.1<br />
Retail Trade 29, 509, 450 74, 220, 317 335.6 820.7<br />
Other support svcs. 28, 200, 057 30, 272, 090 168.7 181.0<br />
Facilities support svcs. 21, 432, 045 21, 661, 074 227.2 229.7<br />
Transit and ground passenger transportation 19, 354, 407 20, 453, 285 322.4 340.6<br />
Leisure 18, 458, 714 31, 266, 067 176.6 296.6<br />
Total 632, 083, 271 1, 427, 385, 770 4, 806.3 9, 197.3<br />
Table 13: United States Summary <strong>of</strong> <strong>Impacts</strong> by Industry<br />
Top 10 Industries<br />
Output ($)<br />
Employment<br />
Direct Total Direct Total<br />
Construction <strong>of</strong> other new nonresidential structures 233, 757, 818 233, 757, 818 1, 536.7 1, 536.7<br />
Accommodations 101, 025, 439 109, 036, 618 918.2 990.7<br />
Advertising and related svcs. 69, 785, 559 79, 029, 676 470.8 531.7<br />
Marine Sector 38, 249, 646 39, 215, 528 128.1 131.3<br />
Other support svcs. 28, 200, 057 31, 889, 020 181.7 204.6<br />
Food svcs. and drinking places 25, 224, 162 56, 748, 974 441.9 992.2<br />
Retail Trade 23, 649, 550 83, 494, 926 314.4 1, 087.0<br />
Facilities support svcs. 21, 432, 045 21, 917, 097 252.9 258.4<br />
Business support svcs. 18, 348, 169 23, 561, 984 222.7 282.3<br />
Transit and ground passenger transportation 16, 788, 602 18, 594, 886 307.4 340.4<br />
Total 597, 625, 374 1, 851, 978, 702 4, 956.3 11, 964.0<br />
30
Comparison to Valencia and Auckland<br />
<strong>The</strong> expenditures assumed for the 34th <strong>America's</strong> <strong>Cup</strong> are broadly consistent with expenditures in the 31st <strong>America's</strong><br />
<strong>Cup</strong> in Auckland and the 32nd in Valencia, which had roughly the same format anticipated for San Francisco.<br />
<strong>The</strong> 2010, or 33rd <strong>America's</strong> <strong>Cup</strong> was a very brief affair, with only two participants and lasting three days, so it is<br />
not included in the comparison here.<br />
In the most inclusive calculations, the spending in Valencia was significantly larger than is anticipated for a San<br />
Francisco <strong>America's</strong> <strong>Cup</strong>. <strong>The</strong>re are three reasons for this difference. First, the absence <strong>of</strong> the enormous infusion<br />
<strong>of</strong> public money for supporting infrastructure explains roughly 75% <strong>of</strong> the difference. <strong>The</strong> Spanish government<br />
made a decision to use the <strong>America's</strong> <strong>Cup</strong> as an impetus for developing the harbor area <strong>of</strong> Valencia into a tourist<br />
destination. Second, there are also smaller infrastructure expenditures assumed on the part <strong>of</strong> the syndicates ($20<br />
million rather than $256 million). A portion <strong>of</strong> the expenditures by syndicates in Valencia has been transferred in<br />
the current analysis to the <strong>Cup</strong> management. As discussed above, rather than being provided by individual syndicates,<br />
hospitality suites and other facilities would likely be provided centrally by the <strong>Cup</strong> management. It should<br />
be noted that these infrastructure expenditures still represent a small fraction <strong>of</strong> what was spent in Valencia.<br />
Finally, there were also significant infrastructure investments made by local yacht clubs. <strong>The</strong>se are included in<br />
the other expenditures. 16 Table 14: <strong>America's</strong> <strong>Cup</strong> Expenditures ($ millions)<br />
Agents<br />
Auckland Valencia San Francisco<br />
2003 2007 2013/14<br />
Syndicates 163.6 557.4 215.8<br />
Superyachts 110.8 39.4 11.3<br />
<strong>Cup</strong> Management 19.2 149.2 195.2<br />
Media 18.8 25.7 25.7<br />
Government 5.1 3, 237.8 100.0<br />
International Visitors 33.1 194.2 86.1<br />
Domestic Visitors 0.0 - 150.4<br />
Other - 140.2 5.0<br />
Total 350.7 4, 343.9 789.5<br />
Total w/o Government 345.6 1, 106.1 689.5<br />
16 Estimates <strong>of</strong> spending for Auckland are from "<strong>The</strong> <strong>Economic</strong> Impact <strong>of</strong> the 2003 <strong>America's</strong> <strong>Cup</strong> Defence", produced by Market <strong>Economic</strong>s<br />
Ltd for the New Zealand Ministry <strong>of</strong> Tourism, October 2003. <strong>The</strong> estimates <strong>of</strong> spending for Valencia are from "<strong>Economic</strong> Impact<br />
<strong>of</strong> the 32nd <strong>America's</strong> <strong>Cup</strong> Valencia 2008", produced by the Instituto Valenciano de Investigaciones <strong>Economic</strong>as, Final report, December<br />
2007.<br />
31
When these adjustments are made, the expected expenditures for San Francisco are comparable to those <strong>of</strong> Valencia.<br />
<strong>The</strong>y remain significantly higher than occurred in Auckland. This is primarily because <strong>of</strong> greater expected<br />
spectator attendance and significantly higher expenditures by the organizing committee.<br />
<strong>America's</strong> <strong>Cup</strong> <strong>Economic</strong>s: Costs and Caveats<br />
Although the economic benefits <strong>of</strong> hosting an <strong>America's</strong> <strong>Cup</strong> in San Francisco are without question substantial,<br />
it is important to keep in mind that hosting such a significant event is not without its impact on local residents<br />
and other visitors to the city. In addition to the jobs, tax revenues, and increased economic activity, a significant<br />
influx <strong>of</strong> visitors, local, domestic, or foreign, brings with it:<br />
added congestion on the streets <strong>of</strong> San Francisco<br />
higher hotel rates<br />
longer lines at local restaurants (though locals know the best places that visitors will never find)<br />
higher airfares to and from San Francisco may result as increased demand crowds the limited capacity<br />
<strong>of</strong> SFO<br />
a tug <strong>of</strong> war over employees (some <strong>of</strong> the jobs created could come at the expense <strong>of</strong> other businesses<br />
in the city)<br />
providing tourism related services is not without cost to the city<br />
In particular, waterfront restaurants and retail may have to contend at peak race times with congestion, street<br />
closures, and loss <strong>of</strong> parking that will disrupt normal business patterns and customer activity. 17 This disruption is<br />
but a fraction <strong>of</strong> the change in activity that can result from hosting such a spectator-intensive event. In particular,<br />
some local residents may find it in their own best interests to be away during the event. Because <strong>of</strong> the significant<br />
increase in visitor volumes to the area, other potential visitors could avoid San Francisco as airfares and hotel<br />
rates would likely be elevated. In sum, it is extremely difficult to gauge the net effect <strong>of</strong> major events on tourism.<br />
<strong>The</strong>re is always a certain amount <strong>of</strong> crowding out <strong>of</strong> non-event related tourism.<br />
Even though there is some potential for disruption, San Francisco's economy has long focused on and benefited<br />
significantly from tourism, including large-scale events. <strong>The</strong> city's residents have tussled with the effects<br />
<strong>of</strong> tourism for a very long time, and most sincerely hope to for a very long time yet to come.<br />
17 To minimize the negative effects, the city should evaluate specific congestion mitigation measures.<br />
32
Another form <strong>of</strong> crowding out that is not captured in the model has to do with the estimated increase in employment.<br />
If the local economy has completely recovered from the recent recession, it may be difficult to find the<br />
employees necessary to provide services to those participating in or watching the <strong>America's</strong> <strong>Cup</strong>. <strong>The</strong> source for<br />
many <strong>of</strong> these employees will be establishments elsewhere in San Francisco. When there is slack in the economy,<br />
this need not occur as there may be sufficient numbers <strong>of</strong> unemployed workers. <strong>The</strong> results presented above are<br />
therefore more applicable during an economic downturn than an economic boom.<br />
<strong>The</strong>re are also other conceptual difficulties associated with estimating the economic impact in advance <strong>of</strong> an<br />
event. In particular, much <strong>of</strong> the activity that is evaluated is highly speculative. <strong>The</strong> results in this report therefore<br />
borrow heavily from the actual expenditures that took place during the previous <strong>America's</strong> <strong>Cup</strong> in Valencia.<br />
However, as discussed above, there are inherent differences between the two locations that make the evaluation<br />
less than certain. <strong>The</strong> results presented here are based on assumptions that are in general conservative relative<br />
to the experience in Valencia.<br />
Another significant caveat is with respect to the methods used. Although the IMPLAN model is standard in the<br />
industry and utilizes the best methods available for assessing the impact prior to an event, there are certain<br />
methodological assumptions that are made that may not be correct. <strong>The</strong>se assumptions, detailed in Appendix B,<br />
have a tendency to lead to estimated impacts that are too high. This is another reason that many <strong>of</strong> the assumptions<br />
underlying the results above are conservative.<br />
For these reasons, the results presented above may be significantly different from the actual experience, either<br />
higher or lower. <strong>The</strong> overall message <strong>of</strong> the results is quite clear and robust to these costs and caveats: an event<br />
such as the <strong>America's</strong> <strong>Cup</strong> will have a significant benefit for the local economy, its businesses and its workers.<br />
Sensitivity Analysis<br />
<strong>The</strong> results presented above are predicated on a particular scenario unfolding for an <strong>America's</strong> <strong>Cup</strong> in the San<br />
Francisco <strong>Bay</strong>. <strong>The</strong>re is currently a great deal <strong>of</strong> uncertainty over several aspects <strong>of</strong> the event. <strong>The</strong> following list<br />
includes particular areas in which it is very difficult to predict how things will unfold and hence their contributions<br />
to the overall economic implications <strong>of</strong> hosting the next <strong>America's</strong> <strong>Cup</strong>:<br />
<strong>The</strong> number <strong>of</strong> <strong>America's</strong> <strong>Cup</strong> related regattas that would occur in San Francisco in the years preceding<br />
the defense.<br />
33
<strong>The</strong> possibility <strong>of</strong> and size <strong>of</strong> a defender series.<br />
<strong>The</strong> number <strong>of</strong> spectators, both local and non-local.<br />
<strong>The</strong> number <strong>of</strong> super yachts on the <strong>Bay</strong> during the <strong>America's</strong> <strong>Cup</strong>.<br />
Given these uncertainties, this section presents results that provide some guidance for how to think about different<br />
scenarios should San Francisco be chosen as the location <strong>of</strong> the next <strong>America's</strong> <strong>Cup</strong> defense. <strong>The</strong> implications<br />
<strong>of</strong> pre-<strong>Cup</strong> regattas are clearly significant, but we are not able to estimate them here with any certainty. A simple<br />
calculation suggests that their impact could be considerable. Lasting perhaps two weeks, pre-<strong>Cup</strong> regattas are<br />
approximately 15% <strong>of</strong> a combined Challenger Series and <strong>America's</strong> <strong>Cup</strong> defense in duration, with implications for<br />
organizers, spectators, media, and super yachts, in particular. Taking 15% <strong>of</strong> these agents' expenditures as estimated<br />
above, these events could easily add in excess <strong>of</strong> $125 million per event. This is a very conservative estimate<br />
as there would clearly be additional expenditures by the syndicates and others.<br />
<strong>The</strong> possibility <strong>of</strong> a defender series has been factored into the results presented above. <strong>The</strong> defender series adds<br />
about 10% to the economic impact. This estimate is quite uncertain as there is no way to know at this time how<br />
many U.S. based challenges to BMW/Oracle there might be. We have assumed 3, but it could be more or less. However,<br />
it can be expected that the introduction <strong>of</strong> an additional syndicate in the defender series would add about<br />
1.5%, or about $20 million, to the overall impact <strong>of</strong> the <strong>America's</strong> <strong>Cup</strong> on the local economy.<br />
Spectators are a significant wild card in the analysis. We have assumed that local spectators would be just over<br />
two times their size in Valencia, 2007 and that non-local spectators would be the same as was experienced in 2007.<br />
Because <strong>of</strong> San Francisco's large base <strong>of</strong> potential spectators and its reputation as a leading tourist destination,<br />
these assumptions are reasonably conservative. We have also assumed that expenditures would be comparable.<br />
If these are under-estimates <strong>of</strong> either the number <strong>of</strong> spectators or their expenditures, which is likely, the local<br />
impact would likely be higher. For local spectators, a 10% increase in either their expenditures or the numbers<br />
would result in an increase in overall output in San Francisco <strong>of</strong> $25.2 million, or 218 jobs. For foreign spectators,<br />
a similar increase <strong>of</strong> 10% would increase output by $14.4 million or 118 jobs.<br />
Finally, we have estimated that the presence <strong>of</strong> super yachts on the <strong>Bay</strong> would be 50% less than was assumed for<br />
Valencia, with total expenditures <strong>of</strong> $11.3 million in San Francisco. In the event that super yachts were to come in<br />
similar numbers to Valencia, the overall impact would be increased by $11.3 million, with the creation <strong>of</strong> another<br />
34
100 jobs. <strong>The</strong> $11.3 million assumes that super yachts would be on the <strong>Bay</strong> for some 960 days. 18 <strong>The</strong> implication is<br />
that each day on the <strong>Bay</strong> results in $11,750 in local spending. 19 For every 100 days that super yachts spend on the<br />
<strong>Bay</strong>, local spending could increase by up to $1.2 million.<br />
Table 15 illustrates the implications for the economic impact <strong>of</strong> the <strong>America's</strong> <strong>Cup</strong> <strong>of</strong> the following:<br />
Two pre-<strong>Cup</strong> regattas on the <strong>Bay</strong>.<br />
A 10% increase in both local and non-local spectators.<br />
A super yacht presence equivalent to that in Valencia.<br />
From this, it is reasonably clear that the impact could be substantially greater than the $1.4 billion presented<br />
above. <strong>The</strong>se three changes result in an increase in expenditures <strong>of</strong> just under $200 million, with an associated<br />
increase in overall impact <strong>of</strong> $326 million, creating an additional 2,000 jobs. It is similarly possible that the impact<br />
could be reduced to the extent that our assumptions are overly aggressive.<br />
Table 15: Expanded Analysis − Summary <strong>of</strong> <strong>Impacts</strong> by Agents ($)<br />
Agents<br />
Output Employment State and Local Taxes<br />
Direct Total Direct Total Direct Total<br />
<strong>Cup</strong> Management 253, 772, 666 487, 639, 886 1, 390.4 2, 605.9 7, 746, 608 24, 872, 839<br />
Syndicates 215, 750, 002 367, 908, 027 1, 527.8 2, 285.8 12, 975, 508 22, 807, 510<br />
Local Visitors 215, 050, 699 360, 471, 984 2, 411.4 3, 118.5 18, 790, 199 28, 467, 913<br />
NonLocal Visitors 123, 186, 969 206, 393, 471 1, 283.2 1, 691.2 11, 105, 762 16, 589, 917<br />
Infrastructure 100, 000, 000 158, 879, 003 463.9 770.5 2, 365, 924 6, 575, 387<br />
Media 33, 364, 189 58, 176, 672 221.9 345.3 2, 484, 439 4, 103, 775<br />
Super Yachts 29, 329, 472 48, 227, 911 168.2 259.2 2, 023, 278 3, 269, 269<br />
Miscellaneous 5, 000, 000 8, 047, 683 15.7 30.0 115, 081 331, 835<br />
Side Trips 997, 871 1, 672, 720 9.9 12.3 88, 790 132, 592<br />
Extended Visits 650, 070 1, 089, 705 6.5 7.6 57, 843 86, 377<br />
Total 977, 101, 938 1, 698, 507, 063 7, 498.9 11, 126.3 57, 753, 432 107, 237, 414<br />
18 If a single super yacht were to be present on the <strong>Bay</strong> for 10 days, that would be equivalent in our analysis to 2 super yachts being<br />
present for 5 days each.<br />
19 This is not strictly correct as there are fixed costs <strong>of</strong> bringing a super yacht to the <strong>Bay</strong>. <strong>The</strong>se estimates are hence over-estimates <strong>of</strong><br />
the increase in local spending associated with an increased super yacht presence.<br />
35
Summary<br />
This report has shown that as the third largest economic prize among sports, and a far larger prize than the Super<br />
Bowl or an all-star game, the <strong>America's</strong> <strong>Cup</strong> brings with it a tremendous economic windfall. Likely lasting three<br />
months or more, the <strong>America's</strong> <strong>Cup</strong> and the racing leading up to the defense, has the potential to increase spending<br />
in San Francisco by nearly $800 million. This increase in spending brings with it a total increase in economic<br />
activity <strong>of</strong> nearly $1.4 billion. <strong>The</strong> job creation potential is significant, up to 9,000 positions, with as much as 30%<br />
<strong>of</strong> these jobs employing low-skilled, low-wage workers.<br />
<strong>The</strong> potential increase in city revenue is also significant. Conservatively estimated at $24 million, the increased<br />
local tax revenues would be a welcome boost to the city's cash-starved c<strong>of</strong>fers. This estimate is conservative in<br />
that it includes only taxes accruing from hotels and restaurants. Other important sources <strong>of</strong> revenue are not included;<br />
in particular, direct business taxes are excluded. All in all, this estimate amounts to roughly a 5% increase<br />
in tourism-related revenues. At the same time, the city will surely incur significant costs through the provision<br />
<strong>of</strong> transportation (MUNI), security, traffic control, and other tourism related services. <strong>The</strong> net effect on the city's<br />
general fund is likely to be positive, and is estimated to be roughly $13 million.<br />
It is also the case that a great deal <strong>of</strong> uncertainty exists surrounding the format <strong>of</strong> an <strong>America's</strong> <strong>Cup</strong> on the <strong>Bay</strong>. It<br />
is possible that the extent <strong>of</strong> racing will be less than that assumed here. This will naturally reduce the economic<br />
impact. However, the bulk <strong>of</strong> the benefits come from the activities <strong>of</strong> the <strong>Cup</strong> management and syndicates. Most<br />
<strong>of</strong> these expenditures will occur regardless <strong>of</strong> the duration or format <strong>of</strong> the event.<br />
Regardless <strong>of</strong> the format chosen, it is clear that any <strong>of</strong> the possible scenarios will result in a significant economic<br />
windfall for a significant number <strong>of</strong> businesses in and around the city <strong>of</strong> San Francisco. In addition, a successful<br />
defense <strong>of</strong> the <strong>America's</strong> <strong>Cup</strong> will likely lead to additional events in the future. Over the long term, hosting the<br />
next <strong>America's</strong> <strong>Cup</strong> has potential benefits that significantly exceed those presented here.<br />
36
Appendix A: Detailed Results by Agent<br />
Of the participants in the <strong>America's</strong> <strong>Cup</strong> <strong>Match</strong> and the events leading up to the defense, each category contributes<br />
significantly. This section provides evidence on the contributions <strong>of</strong> each participating group to the overall economic<br />
impact on the city and county <strong>of</strong> San Francisco.<br />
Syndicates. Each <strong>of</strong> the 15 syndicates is expected to be in residence in San Francisco for a significant portion <strong>of</strong><br />
each year in the years leading up to the <strong>Match</strong>. Syndicates would move into the region full-time roughly 15 months<br />
prior to the <strong>Match</strong>. During this time they will be feeding and housing their crews and staff. This spending alone<br />
makes up more than one-third <strong>of</strong> all syndicate spending. Syndicates are the largest source <strong>of</strong> spending, making up<br />
27% <strong>of</strong> the total. In total, the syndicates are expected to spend in the vicinity <strong>of</strong> $216 million. From this spending,<br />
the total increase in economic activity is on the order <strong>of</strong> $368 million, resulting in the creation <strong>of</strong> 2,287 jobs.<br />
Table 16: Detailed <strong>Impacts</strong> by Syndicates<br />
Output Employment Labor Income<br />
Direct Effects: Expenditure Categories<br />
Accommodations 80, 214, 745 499.4 28, 556, 705<br />
Advertising And Related Svcs. 43, 841, 505 249.8 21, 317, 445<br />
Marine Sector 27, 660, 258 81.6 9, 079, 896<br />
Construction Of Other New Nonresidential Structures 27, 660, 258 128.4 11, 894, 701<br />
Transit And Ground Passenger Transportation 13, 415, 224 305.8 5, 851, 559<br />
Food Svcs. And Drinking Places 11, 479, 008 153.0 4, 923, 853<br />
Retail Trade 7, 606, 570 67.0 3, 244, 239<br />
Leisure 3, 872, 436 42.9 1, 575, 768<br />
Total 215, 750, 002 1, 527.9 86, 444, 166<br />
Total Effects: Top 10 Industries<br />
Accommodations 80, 386, 140 500.5 28, 617, 720<br />
Advertising And Related Svcs. 48, 736, 050 277.8 23, 697, 365<br />
Marine Sector 27, 660, 705 81.6 9, 080, 044<br />
Construction Of Other New Nonresidential Structures 27, 660, 258 128.4 11, 894, 701<br />
Food Svcs. And Drinking Places 17, 705, 172 236.0 7, 594, 531<br />
Retail Trade 14, 885, 186 131.0 6, 348, 606<br />
Transit And Ground Passenger Transportation 13, 535, 248 308.5 5, 903, 912<br />
Real Estate Establishments 11, 396, 970 37.5 1, 784, 314<br />
Imputed Rental Activity For Owner-Occupied Dwellings 10, 646, 622 0.0 0<br />
Telecommunications 7, 126, 612 10.1 1, 327, 924<br />
Total 367, 908, 026 2, 286.6 142, 756, 384<br />
38
Table 16a: Summary <strong>of</strong> Occupational <strong>Impacts</strong> by Syndicates<br />
Average Annual<br />
Top 10 Occupations Employment Wages ($)<br />
Food Preparation and Serving-Related 564 28, 358<br />
Office and Administrative Support 325 41, 744<br />
Sales and Related 303 49, 058<br />
Management 155 125, 049<br />
Business and Financial Operations 138 82, 896<br />
Building and Grounds Cleaning and Maintenance 104 28, 996<br />
Construction and Extraction 100 63, 110<br />
Computer and Mathematical 85 88, 105<br />
Transportation and Material Moving 80 36, 110<br />
Arts, Design, Entertainment, Sports, and Media 77 60, 167<br />
All Occupations 2, 286 53, 127<br />
39
<strong>Cup</strong> Management. <strong>The</strong> <strong>America's</strong> <strong>Cup</strong> organization, if similar to Valencia, is the second largest contributor to<br />
local spending, with 27% <strong>of</strong> the total. Between the syndicates and the organizing committee, they account for<br />
more than half <strong>of</strong> all expenditures related to the <strong>America's</strong> <strong>Cup</strong> Defense. Approximately one-half <strong>of</strong> the organizer<br />
expenses are related to providing business services and advertizing in support <strong>of</strong> the event. <strong>The</strong> other half is<br />
anticipated infrastructure spending. Combined, these expenditures lead directly to nearly $195 million in expenditures,<br />
supporting the creation <strong>of</strong> 1,070 jobs. <strong>The</strong> total effect <strong>of</strong> these expenditures on the local economy is in<br />
excess <strong>of</strong> $375 million, with 2,005 jobs being created.<br />
Table 17: Detailed <strong>Impacts</strong> by <strong>Cup</strong> Management<br />
Output Employment Labor Income<br />
Direct Effects: Expenditure Categories<br />
Construction <strong>of</strong> other new nonresidential structures 106, 097, 561 492.2 45, 624, 977<br />
Other support svcs. 28, 200, 057 142.0 8, 843, 798<br />
Advertising and related svcs. 25, 944, 054 147.8 12, 615, 008<br />
Facilities support svcs. 21, 432, 045 197.1 13, 546, 832<br />
Business support svcs. 13, 536, 027 90.5 6, 720, 001<br />
Total 195, 209, 743 1, 069.6 87, 350, 617<br />
Total Effects: Top 10 Industries<br />
Construction <strong>of</strong> other new nonresidential structures 106, 097, 561 492.2 45, 624, 977<br />
Other support svcs. 28, 924, 975 145.6 9, 071, 140<br />
Advertising and related svcs. 28, 535, 849 162.6 13, 875, 242<br />
Facilities support svcs. 21, 450, 272 197.3 13, 558, 353<br />
Imputed rental activity for owner-occupied dwellings 16, 719, 696 0.0 0<br />
Business support svcs. 14, 410, 662 96.3 7, 154, 217<br />
Real estate establishments 13, 205, 877 43.5 2, 067, 518<br />
Retail Trade 10, 965, 309 96.5 4, 676, 759<br />
Wholesale trade businesses 9, 012, 485 35.1 3, 482, 753<br />
Architectural, engineering, and related svcs. 8, 117, 876 59.5 5, 191, 142<br />
Total 375, 107, 604 2, 005.2 154, 509, 803<br />
40
Table 17a: Summary <strong>of</strong> Occupational <strong>Impacts</strong> by <strong>Cup</strong> Management<br />
Average Annual<br />
Top 10 Occupations Employment Wages ($)<br />
Construction and Extraction 344 63, 549<br />
Office and Administrative Support 334 44, 437<br />
Business and Financial Operations 184 85, 896<br />
Management 179 134, 225<br />
Sales and Related 146 60, 304<br />
Computer and Mathematical 123 89, 544<br />
Food Preparation and Serving-Related 112 28, 375<br />
Building and Grounds Cleaning and Maintenance 69 30, 960<br />
Arts, Design, Entertainment, Sports, and Media 64 66, 072<br />
Legal 63 144, 725<br />
All Occupations 2, 005 68, 146<br />
41
Local Infrastructure. Expenditures by local governments in support <strong>of</strong> the <strong>America's</strong> <strong>Cup</strong> consist entirely <strong>of</strong> infrastructure<br />
development. In particular, the Port <strong>of</strong> San Francisco has piers available for use as a home base for<br />
the syndicates, as a part <strong>of</strong> the <strong>America's</strong> <strong>Cup</strong> Village. This will be a place where the sailing vessels are stored,<br />
maintained, and where crew gather, work out, and prepare for sailing. <strong>The</strong> exact size <strong>of</strong> these expenditures is<br />
currently unknown, but are assumed to be in the neighborhood <strong>of</strong> $100 million. <strong>The</strong>se direct expenditures lead<br />
to an additional $49 million in economic activity in the city and county, creating a total <strong>of</strong> 771 jobs.<br />
Table 18: Detailed <strong>Impacts</strong> by Infrastructure<br />
Output Employment Labor Income<br />
Direct Effects: Expenditure Categories<br />
Construction Of Other New Nonresidential Structures 100, 000, 000 463.9 43, 002, 852<br />
Total 100, 000, 000 463.9 43, 002, 852<br />
Total Effects: Top 10 Industries<br />
Construction Of Other New Nonresidential Structures 100, 000, 000 463.9 43, 002, 852<br />
Architectural, Engineering, And Related Svcs. 6, 855, 464 50.3 4, 383, 867<br />
Imputed Rental Activity For Owner-Occupied Dwellings 4, 712, 358 0.0 0<br />
Retail Trade 3, 866, 164 34.0 1, 648, 938<br />
Wholesale Trade Businesses 3, 712, 189 14.4 1, 434, 525<br />
Real Estate Establishments 3, 344, 170 11.0 523, 565<br />
Telecommunications 2, 240, 810 3.2 417, 537<br />
Monetary Authorities And Depository Credit Intermediation 1, 993, 740 3.3 552, 629<br />
Food Svcs. And Drinking Places 1, 941, 999 25.9 833, 009<br />
Securities, Commodity Contracts, Investments, And Related 1, 698, 678 5.1 1, 030, 374<br />
Total 158, 879, 003 771.3 65, 894, 611<br />
Table 18a: Summary <strong>of</strong> Occupational <strong>Impacts</strong> by Infrastructure<br />
Average Annual<br />
Top 10 Occupations Employment Wages ($)<br />
Construction and Extraction 317 63, 670<br />
Office and Administrative Support 108 44, 412<br />
Management 62 137, 145<br />
Business and Financial Operations 51 85, 935<br />
Sales and Related 43 61, 298<br />
Food Preparation and Serving-Related 29 28, 349<br />
Computer and Mathematical 23 87, 199<br />
Installation, Maintenance, and Repair 21 60, 478<br />
Transportation and Material Moving 20 40, 530<br />
Education, Training, and Library 13 53, 351<br />
All Occupations 770 66, 750<br />
42
Spectators: Spectators collectively make up the single largest contributing force for economic benefit. Combined,<br />
our estimate <strong>of</strong> total spectator spending amounts to roughly $233 million. Although on an individual basis, nonlocal<br />
visitors are the big spenders. This is largely due to hotel expenditures. In total, however, they make up only<br />
37% <strong>of</strong> spectator spending, due to their lower numbers. With expenditures <strong>of</strong> $86 million, their net impact on the<br />
local economy is to raise output by $144 million, and to create nearly 1,200 jobs.<br />
Table 19: Detailed <strong>Impacts</strong> by Non-Local Visitors<br />
Output Employment Labor Income<br />
Direct Effects: Expenditure Categories<br />
Accommodations 31, 017, 159 193.1 11, 042, 208<br />
Food Svcs. And Drinking Places 22, 967, 724 306.2 9, 851, 872<br />
Retail Trade 14, 649, 754 129.0 6, 248, 192<br />
Leisure 11, 095, 583 122.9 4, 515, 003<br />
Transit And Ground Passenger Transportation 6, 414, 513 146.2 2, 797, 933<br />
Total 86, 144, 734 897.3 34, 455, 208<br />
Total Effects: Top 10 Industries<br />
Accommodations 31, 092, 554 193.6 11, 069, 049<br />
Food Svcs. And Drinking Places 25, 308, 064 337.4 10, 855, 747<br />
Retail Trade 17, 180, 839 151.2 7, 327, 713<br />
Leisure 12, 305, 090 136.3 5, 007, 175<br />
Transit And Ground Passenger Transportation 6, 463, 177 147.3 2, 819, 160<br />
Real Estate Establishments 5, 391, 246 17.7 844, 056<br />
Imputed Rental Activity For Owner-Occupied Dwellings 3, 900, 233 0.0 0<br />
Electric Power Generation, Transmission, And Distribution 2, 802, 986 2.7 551, 417<br />
Wholesale Trade Businesses 2, 568, 564 10.0 992, 587<br />
Telecommunications 2, 295, 095 3.2 427, 652<br />
Total 144, 331, 099 1, 183.6 55, 636, 083<br />
Our estimate <strong>of</strong> local visitor spending is $150 million throughout the three phases <strong>of</strong> the defense makes them the<br />
third largest contributor to overall spending. This leads to a total increase in economic activity <strong>of</strong> $252 million<br />
and the creation <strong>of</strong> 2,184 jobs.<br />
43
Table 19a: Summary <strong>of</strong> Occupational <strong>Impacts</strong> by Non-Local Visitors<br />
Average Annual<br />
Top 10 Occupations Employment Wages ($)<br />
Food Preparation and Serving-Related 448 28, 379<br />
Sales and Related 177 45, 551<br />
Office and Administrative Support 140 39, 610<br />
Management 63 115, 764<br />
Building and Grounds Cleaning and Maintenance 61 28, 077<br />
Personal Care and Service 47 31, 265<br />
Business and Financial Operations 45 79, 257<br />
Transportation and Material Moving 41 35, 372<br />
Arts, Design, Entertainment, Sports, and Media 37 54, 356<br />
Computer and Mathematical 21 85, 689<br />
All Occupations 1, 183 43, 677<br />
Table 20: Detailed <strong>Impacts</strong> by Local Visitors<br />
Output Employment Labor Income<br />
Direct Effects: Expenditure Categories<br />
Food Svcs. And Drinking Places 53, 432, 033 712.2 22, 919, 360<br />
Accommodations 39, 795, 517 247.9 14, 167, 332<br />
Retail Trade 24, 073, 212 211.8 10, 267, 344<br />
Leisure 20, 454, 668 226.4 8, 323, 391<br />
Transit And Ground Passenger Transportation 12, 629, 676 288.0 5, 508, 913<br />
Total 150, 385, 104 1, 686.3 61, 186, 339<br />
Total Effects: Top 10 Industries<br />
Food Svcs. And Drinking Places 57, 355, 365 764.6 24, 602, 251<br />
Accommodations 39, 931, 538 248.6 14, 215, 755<br />
Retail Trade 28, 566, 087 251.6 12, 183, 577<br />
Leisure 22, 626, 667 250.6 9, 207, 218<br />
Transit And Ground Passenger Transportation 12, 714, 959 289.7 5, 546, 112<br />
Real Estate Establishments 9, 783, 182 32.1 1, 531, 659<br />
Imputed Rental Activity For Owner-Occupied Dwellings 6, 873, 525 0.0 0<br />
Wholesale Trade Businesses 4, 844, 736 18.9 1, 872, 182<br />
Electric Power Generation, Transmission, And Distribution 4, 737, 851 4.6 932, 053<br />
Telecommunications 3, 959, 845 5.6 737, 851<br />
Total 252, 078, 308 2, 183.8 98, 016, 749<br />
This category <strong>of</strong> visitors, and hence spending, raises the the greatest question regarding numbers. Evidence from<br />
Fleet Week each year suggests that <strong>Bay</strong> <strong>Area</strong> residents are extremely enthusiastic about events on the <strong>Bay</strong>, with<br />
estimates ranging between 1 and 1.3 million spectators populating the <strong>Bay</strong>'s amphitheater. <strong>The</strong>se volumes occur<br />
over a period <strong>of</strong> 3 days, whereas the ACM will occur over a period <strong>of</strong> 3 months. This suggests that local visitors<br />
44
Table 20a: Summary <strong>of</strong> Occupational <strong>Impacts</strong> by Local Visitors<br />
Average Annual<br />
Top 10 Occupations Employment Wages ($)<br />
Food Preparation and Serving-Related 846 28, 381<br />
Sales and Related 322 45, 436<br />
Office and Administrative Support 253 39, 566<br />
Management 115 115, 284<br />
Building and Grounds Cleaning and Maintenance 114 28, 036<br />
Personal Care and Service 89 31, 261<br />
Business and Financial Operations 80 79, 014<br />
Transportation and Material Moving 73 35, 346<br />
Arts, Design, Entertainment, Sports, and Media 67 53, 964<br />
Computer and Mathematical 37 85, 533<br />
All Occupations 2, 181 43, 240<br />
will be much higher in volume than in Valencia. <strong>The</strong> likelihood that the interested portion <strong>of</strong> the population will<br />
keep coming back for multiple races is unknown.<br />
Our assumption is that spectators will have the enthusiasm for the equivalent <strong>of</strong> 2 Fleet Weeks during the 3 months<br />
<strong>of</strong> the <strong>America's</strong> <strong>Cup</strong> and related matches, so our counts involve an estimated 2.3 million local spectator days. This<br />
is also approximately 2.15 times the number <strong>of</strong> local visitors during the 32nd defense in Valencia, 2007. If the number<br />
<strong>of</strong> days <strong>of</strong> racing and the compositon <strong>of</strong> weekend and mid week days is similar, this would imply somethign on<br />
the order <strong>of</strong> 100,000 local spectators for each weekend day and 14,600 for each week day <strong>of</strong> racing. <strong>The</strong>re will, <strong>of</strong><br />
course, be races that attract relatively more spectators than others, finals versus round robin matches, but they<br />
seem reasonable in light <strong>of</strong> the Fleet Week experience.<br />
Were we to use a more conservative estimate, one that assumes that local spectator counts would be similar to<br />
those at Valencia in 2007, we would find that the contribution <strong>of</strong> spectators is much less: by $45 million, or 82%<br />
less, with far fewer jobs created.<br />
Table 21: Direct <strong>Impacts</strong> by Local Visitors: Conservative Estimate<br />
Output Employment Labor Income<br />
Total Effects: Top 10 Industries<br />
Food Svcs. And Drinking Places 16, 121, 734 214.9 6, 915, 324<br />
Accommodations 12, 007, 268 74.8 4, 274, 626<br />
Retail Trade 7, 263, 469 63.9 3, 097, 906<br />
Leisure 6, 171, 667 68.3 2, 511, 368<br />
Transit And Ground Passenger Transportation 3, 810, 678 86.9 1, 662, 172<br />
Total 45, 374, 816 508.8 18, 461, 395<br />
45
Media. Expenditures on the part <strong>of</strong> the media stem primarily from having people on the ground to cover the<br />
events and are the sixth largest contributor to economic impact. We have estimated that media expenditures<br />
would be on the order <strong>of</strong> $25.7 million. This leads to an increase in output <strong>of</strong> $44.8 million overall and to the<br />
creation <strong>of</strong> some 266 jobs.<br />
Table 22: Detailed <strong>Impacts</strong> by Media<br />
Output Employment Labor Income<br />
Direct Effects: Expenditure Categories<br />
Management, Scientific, And Technical Consulting Svcs. 4, 812, 143 22.4 3, 144, 537<br />
Retail Trade 4, 812, 143 42.3 2, 052, 403<br />
Accommodations 3, 742, 777 23.3 1, 332, 441<br />
Leisure 3, 742, 777 41.4 1, 523, 007<br />
Transport By Air 2, 406, 071 8.5 715, 517<br />
Commercial And Industrial Mach. And Equip. Rental And Leasing 2, 138, 730 4.5 525, 345<br />
Food Svcs. And Drinking Places 1, 871, 389 25.0 802, 722<br />
Transport By Water 1, 604, 048 2.4 314, 065<br />
Telecommunications 534, 682 0.8 99, 629<br />
Total 25, 664, 760 170.7 10, 509, 665<br />
Total Effects: Top 10 Industries<br />
Retail Trade 5, 599, 369 49.3 2, 388, 158<br />
Management, Scientific, And Technical Consulting Svcs. 5, 170, 359 24.1 3, 378, 617<br />
Leisure 4, 129, 520 45.8 1, 680, 380<br />
Accommodations 3, 767, 496 23.5 1, 341, 241<br />
Food Svcs. And Drinking Places 2, 681, 606 35.8 1, 150, 259<br />
Transport By Air 2, 423, 990 8.6 720, 845<br />
Commercial And Industrial Mach. And Equip. Rental And Leasing 2, 287, 425 4.8 561, 870<br />
Real Estate Establishments 1, 705, 625 5.6 267, 033<br />
Transport By Water 1, 616, 834 2.4 316, 569<br />
Telecommunications 1, 395, 270 2.0 259, 985<br />
Total 44, 751, 286 266.1 17, 622, 954<br />
46
Table 22a: Summary <strong>of</strong> Occupational <strong>Impacts</strong> by Media<br />
Average Annual<br />
Top 10 Occupations Employment Wages ($)<br />
Food Preparation and Serving-Related 73 28, 363<br />
Sales and Related 38 49, 348<br />
Office and Administrative Support 38 41, 470<br />
Management 18 124, 121<br />
Business and Financial Operations 16 84, 463<br />
Building and Grounds Cleaning and Maintenance 13 28, 842<br />
Computer and Mathematical 10 88, 108<br />
Transportation and Material Moving 9 35, 710<br />
Arts, Design, Entertainment, Sports, and Media 9 58, 689<br />
Personal Care and Service 8 31, 398<br />
All Occupations 266 51, 547<br />
47
Super Yachts. It has been estimated that spending by the owners <strong>of</strong> Super Yachts during the Valencia ACM were<br />
on the order <strong>of</strong> $22 million, making them the seventh largest contributor to economic benefits. <strong>The</strong>se expenditures<br />
were highly concentrated in the local marine sector, but also included a significant component <strong>of</strong> retail<br />
spending. Because the San Francisco <strong>Bay</strong> is generally a less accessible location for owners <strong>of</strong> Super Yachts, we have<br />
assumed that their presence would be lower than at Valencia, by 50%. Expenditures would be similarly lower, but<br />
would nonetheless raise output in San Francsico by $18.6 million, resulting in the creation <strong>of</strong> 100 jobs.<br />
Table 23: Detailed <strong>Impacts</strong> by Super Yachts<br />
Output Employment Labor Income<br />
Direct Effects: Expenditure Categories<br />
Marine Sector 5, 589, 388 16.5 1, 834, 801<br />
Retail Trade 3, 650, 859 32.1 1, 557, 109<br />
Accommodations 856, 165 5.3 304, 798<br />
Leisure 658, 240 7.3 267, 850<br />
Other Personal Svcs. 424, 124 1.9 84, 066<br />
Transit And Ground Passenger Transportation 65, 598 1.5 28, 613<br />
Transport By Air 36, 192 0.1 10, 763<br />
Total 11, 280, 566 64.8 4, 088, 000<br />
Total Effects: Top 10 Industries<br />
Marine Sector 5, 589, 460 16.5 1, 834, 825<br />
Retail Trade 4, 030, 484 35.5 1, 719, 021<br />
Accommodations 865, 054 5.4 307, 962<br />
Leisure 784, 532 8.7 319, 241<br />
Real Estate Establishments 622, 217 2.0 97, 414<br />
Imputed Rental Activity For Owner-Occupied Dwellings 474, 320 0.0 0<br />
Other Personal Svcs. 447, 080 2.0 88, 616<br />
Wholesale Trade Businesses 432, 190 1.7 167, 014<br />
Telecommunications 305, 349 0.4 56, 897<br />
Securities, Commodity Contracts, Investments, And Related 265, 842 0.8 161, 253<br />
Total 18, 549, 197 100.3 6, 785, 573<br />
48
Table 23a: Summary <strong>of</strong> Occupational <strong>Impacts</strong> by Super Yachts<br />
Average Annual<br />
Top 10 Occupations Employment Wages ($)<br />
Sales and Related 22 48, 182<br />
Office and Administrative Support 17 40, 227<br />
Food Preparation and Serving-Related 15 28, 173<br />
Management 7 124, 504<br />
Business and Financial Operations 6 80, 958<br />
Transportation and Material Moving 5 35, 511<br />
Computer and Mathematical 3 85, 470<br />
Building and Grounds Cleaning and Maintenance 3 29, 424<br />
Arts, Design, Entertainment, Sports, and Media 3 60, 405<br />
Education, Training, and Library 2 53, 828<br />
All Occupations 100 53, 196<br />
49
Table 24: Detailed <strong>Impacts</strong> by SideTrips<br />
Output Employment Labor Income<br />
Direct Effects: Expenditure Categories<br />
Accommodations 425, 792 2.7 151, 583<br />
Food Svcs. And Drinking Places 236, 096 3.1 101, 272<br />
Retail Trade 154, 470 1.4 65, 882<br />
Leisure 120, 643 1.3 49, 092<br />
Transit And Ground Passenger Transportation 60, 870 1.4 26, 551<br />
Total 997, 871 9.9 394, 380<br />
Total Effects: Top 10 Industries<br />
Accommodations 426, 649 2.7 151, 888<br />
Food Svcs. And Drinking Places 264, 061 3.5 113, 268<br />
Retail Trade 183, 479 1.6 78, 255<br />
Leisure 134, 376 1.5 54, 680<br />
Transit And Ground Passenger Transportation 61, 434 1.4 26, 797<br />
Real Estate Establishments 60, 929 0.2 9, 539<br />
Imputed Rental Activity For Owner-Occupied Dwellings 44, 882 0.0 0<br />
Electric Power Generation, Transmission, And Distribution 33, 455 0.0 6, 582<br />
Wholesale Trade Businesses 28, 692 0.1 11, 087<br />
Telecommunications 26, 770 0.0 4, 988<br />
Total 1, 672, 720 13.2 640, 633<br />
Table 24a: Summary <strong>of</strong> Occupational <strong>Impacts</strong> by SideTrips<br />
Average Annual<br />
Top 10 Occupations Employment Wages ($)<br />
Food Preparation and Serving-Related 5 28, 384<br />
Sales and Related 2 45, 368<br />
Office and Administrative Support 1 39, 554<br />
Building and Grounds Cleaning and Maintenance 1 27, 944<br />
Management 1 114, 390<br />
Personal Care and Service 1 31, 189<br />
Business and Financial Operations 0 80, 238<br />
Transportation and Material Moving 0 35, 568<br />
Arts, Design, Entertainment, Sports, and Media 0 52, 301<br />
Computer and Mathematical 0 85, 086<br />
All Occupations 12 42, 249<br />
50
Table 25: Detailed <strong>Impacts</strong> by Extended Visits<br />
Output Employment Labor Income<br />
Direct Effects: Expenditure Categories<br />
Accommodations 277, 385 1.7 98, 750<br />
Food Svcs. And Drinking Places 153, 807 2.1 65, 975<br />
Retail Trade 100, 631 0.9 42, 920<br />
Leisure 78, 593 0.9 31, 981<br />
Transit And Ground Passenger Transportation 39, 654 0.9 17, 297<br />
Total 650, 070 6.4 256, 922<br />
Total Effects: Top 10 Industries<br />
Accommodations 277, 943 1.7 98, 949<br />
Food Svcs. And Drinking Places 172, 025 2.3 73, 789<br />
Retail Trade 119, 529 1.1 50, 980<br />
Leisure 87, 539 1.0 35, 621<br />
Transit And Ground Passenger Transportation 40, 022 0.9 17, 457<br />
Real Estate Establishments 39, 693 0.1 6, 214<br />
Imputed Rental Activity For Owner-Occupied Dwellings 29, 239 0.0 0<br />
Electric Power Generation, Transmission, And Distribution 21, 795 0.0 4, 288<br />
Wholesale Trade Businesses 18, 691 0.1 7, 223<br />
Telecommunications 17, 440 0.0 3, 250<br />
Total 1, 089, 705 8.6 417, 345<br />
Table 25a: Summary <strong>of</strong> Occupational <strong>Impacts</strong> by Extended Visits<br />
Average Annual<br />
Top 10 Occupations Employment Wages ($)<br />
Food Preparation and Serving-Related 3 28, 382<br />
Sales and Related 1 44, 126<br />
Office and Administrative Support 1 38, 885<br />
Building and Grounds Cleaning and Maintenance 0 27, 828<br />
Management 0 111, 821<br />
Personal Care and Service 0 31, 182<br />
Transportation and Material Moving 0 35, 579<br />
Arts, Design, Entertainment, Sports, and Media 0 51, 743<br />
Business and Financial Operations 0 75, 853<br />
Installation, Maintenance, and Repair 0 46, 151<br />
All Occupations 8 40, 528<br />
51
Additional Spending. An additional category is added here to incorporate spending that could occur during the<br />
events related to the <strong>America's</strong> <strong>Cup</strong> but are distinct from the other categories listed above. <strong>The</strong> only expenditure<br />
category here regards the spending <strong>of</strong> the owners <strong>of</strong> vessels actively participating in the spectator fleet. This includes<br />
local privately owned sail and power boats as well as Hornblower and other ferry type vessels that will<br />
be plying the waters carrying passengers as they watch the matches. It is estimated that over the course <strong>of</strong> the<br />
events, during the 3 months <strong>of</strong> sailing, some $5 million in spending in the marine services sector might accrue.<br />
Table 26: Detailed <strong>Impacts</strong> by Additional Spending<br />
Output Employment Labor Income<br />
Direct Effects: Expenditure Categories<br />
Marine Sector 5, 000, 000 15.7 1, 629, 049<br />
Total 5, 000, 000 15.7 1, 629, 049<br />
Total Effects: Top 10 Industries<br />
Marine Sector 5, 000, 062 15.7 1, 629, 070<br />
Wholesale Trade Businesses 251, 378 1.0 97, 142<br />
Imputed Rental Activity For Owner-Occupied Dwellings 193, 229 0.0 0<br />
Retail Trade 188, 982 1.7 80, 602<br />
Real Estate Establishments 163, 244 0.5 25, 558<br />
Management Of Companies And Enterprises 146, 403 0.5 78, 442<br />
Securities, Commodity Contracts, Investments, And Related 142, 853 0.4 86, 651<br />
Telecommunications 121, 557 0.2 22, 650<br />
Monetary Authorities And Depository Credit Intermediation 105, 586 0.2 29, 267<br />
All Other Miscellaneous Pr<strong>of</strong>essional, Scientific, And Technical Svcs. 104, 000 0.2 10, 808<br />
Total 8, 047, 684 30.4 2, 792, 006<br />
52
Appendix B: IMPLAN Input-Output Methodology<br />
<strong>The</strong> IMPLAN modeling system combines the U.S. Bureau <strong>of</strong> <strong>Economic</strong> Analysis' Input-Output Benchmarks with<br />
other data to construct quantitative models <strong>of</strong> trade flow relationships between businesses, and between businesses<br />
and final consumers. From this data, we can examine the effects <strong>of</strong> a change in one or several economic<br />
activities to predict its effect on a specific state, regional, or local economy (impact analysis). <strong>The</strong> IMPLAN inputoutput<br />
accounts capture all monetary market transactions for consumption in a given time period. <strong>The</strong> IMPLAN<br />
input-output accounts are based on industry survey data collected periodically by the U.S. Bureau <strong>of</strong> <strong>Economic</strong><br />
Analysis and follow a balanced account format recommended by the United Nations.<br />
IMPLAN's Regional <strong>Economic</strong> Accounts and the Social Accounting Matrices will be used to construct region-level<br />
multipliers that describe the response <strong>of</strong> the relevant regional economy to a change in demand or production<br />
as a result <strong>of</strong> the activities and expenditures related to the <strong>America's</strong> <strong>Cup</strong>. Each industry that produces goods<br />
or services generates demand for other goods and services and this demand is multiplied through a particular<br />
economy until it dissipates through "leakage" to economies outside the specified area. IMPLAN models discern<br />
and calculate leakage from local, regional, and state economic areas based on workforce configuration, the inputs<br />
required by specific types <strong>of</strong> businesses, and the availability <strong>of</strong> both inputs in the economic area. Consequently,<br />
economic impacts that accrue to other regions or states as a consequence <strong>of</strong> a change in demand are not counted<br />
as impacts within the economic area.<br />
<strong>The</strong> model accounts for substitution and displacement effects by deflating industry-specific multipliers to levels<br />
well below those recommended by the U.S. Bureau <strong>of</strong> <strong>Economic</strong> Analysis. In addition, multipliers are applied only<br />
to personal disposable income to obtain a more realistic estimate <strong>of</strong> the multiplier effects from increased demand.<br />
Importantly, IMPLAN's Regional <strong>Economic</strong> Accounts exclude imports to an economic area so the calculation <strong>of</strong><br />
economic impacts identifies only those impacts specific to the economic impact area, in this case as determined<br />
and defined by SCE. IMPLAN calculates this distinction by applying the area's economic characteristics described<br />
in terms <strong>of</strong> actual trade flows within the area.<br />
Impact studies operate under the basic assumption that any increase in spending then has three effects: First,<br />
there is a direct effect on that industry itself. Second, there is a chain <strong>of</strong> indirect effects on all the industries<br />
whose outputs are used by the industry under observation. Third, there are induced effects that arise when employment<br />
increases and household spending patterns are expanded.<br />
It is clear that there are several aspects <strong>of</strong> the overall economic impact. First, there is an effect on value added<br />
− the take-home pay <strong>of</strong> all the people affected will be supplemented by that amount. <strong>The</strong> secondary and tertiary<br />
effects <strong>of</strong> the industry on the rest <strong>of</strong> the local economy are not very large. Second, the employment effect, with<br />
some jobs created in the industry itself, and the others spread throughout the California economy. Third, is the<br />
output, where the difference between value added and output is that the former concentrates on people's paychecks,<br />
whereas the latter includes the costs <strong>of</strong> intermediate inputs. National income accounting avoids double<br />
counting by excluding the costs <strong>of</strong> intermediate inputs.<br />
It is also important to note that capital investments made on different types <strong>of</strong> investment can lead to different<br />
multipliers. Why? A sector can have a large multiplier if it induces economic activity in industries whose employees<br />
have a high propensity to spend from take-home pay. Also, if the sector does not import many materials from<br />
abroad or from out <strong>of</strong> state, then its multiplier effect on the local economy will be high. In essence, some <strong>of</strong> the<br />
spending in the local economy may ``leak out'' into other states and countries. If raw materials are imported, then<br />
53
a shock to a local sector will result in decreased economic activity abroad. <strong>The</strong> same is true if a California business<br />
buys inputs from firms in different states.<br />
In sum, our analysis using input-output accounts is based on three important assumptions. First, there are constant<br />
returns to scale. This means that a 10% cut in spending will be ten times as severe−across every sector in the<br />
economy−as a one percent cut. Second, there are no supply constraints. This means that any marginal increase<br />
in output can be produced without having to worry about bottlenecks in labor markets, commodity markets, or<br />
necessary imports. This assumption is quite realistic in a free-market economy like California's where there is<br />
some unemployment. It is even more reasonable in times <strong>of</strong> high unemployment, such as the present economic<br />
environment because there are many under- and un-utilized resources that can be activated without detracting<br />
from other industries. Third, the flow <strong>of</strong> commodities between industries is fixed. This means that it is not possible<br />
to substitute in the short-run the many different inputs that go into the motion picture industry.<br />
54
Appendix C: Acknowledgements<br />
<strong>The</strong> <strong>Bay</strong> <strong>Area</strong> <strong>Council</strong> <strong>Economic</strong> Institute and Beacon <strong>Economic</strong>s wish to thank the following sponsors whose support<br />
enabled the production <strong>of</strong> this report:<br />
Catholic Healthcare West<br />
Clear Channel Outdoor<br />
Hathaway Dinwiddie Construction<br />
Port <strong>of</strong> San Francisco<br />
Recology<br />
San Francisco International Airport/San Francisco Convention & Visitors Bureau<br />
San Francisco Chamber <strong>of</strong> Commerce<br />
United Airlines<br />
URS Corporation<br />
<strong>The</strong> authors also wish to thank the following individuals who generously gave their time for interviews or provided<br />
data used in this report:<br />
BMW Oracle Racing<br />
Melinda Erkelens, General Counsel<br />
California Travel and Tourism Commission<br />
Caroline Beteta, Executive Director<br />
Dan Mishell, Research Director<br />
Crystal Cruises<br />
Gregg Michel, President<br />
Golden Gate Restaurant Association<br />
Kevin Westlye, Executive Director<br />
Golden Gate Yacht Club<br />
Marcus Young, Commodore<br />
Hornblower Cruises<br />
Terry MacRae, President & CEO<br />
Marin Convention & Visitors Bureau<br />
Mark Essman, President & CEO<br />
55
Moor & South Pier Management Co. LP.<br />
Peter Huynh, Cash Control Manager<br />
Napa Valley Conference and Visitors Bureau<br />
Clay Gregory, President & CEO<br />
Orton Development<br />
J.R. Orton, President<br />
Pier 39<br />
Dann Hovey, Senior Vice President/CFO<br />
Kathy Paver, Senior Vice President <strong>of</strong> Marketing<br />
Beth Schnitzer, Vice President Strategic Alliances<br />
Pineapple Sails<br />
Kame Richards, Owner<br />
Port <strong>of</strong> San Francisco<br />
Monique Moyer, Director<br />
Peter Dailey, Deputy Director, Maritime<br />
Jonathan Stern, Assistant Deputy Director, Waterfront Development<br />
Gerard Roybal, Maritime Marketing Manager<br />
San Francisco Building Construction Trades <strong>Council</strong><br />
Mike Thierault, Secretary-Treasurer<br />
San Francisco Convention & Visitors Bureau<br />
Joe d'Alessandro, President & CEO<br />
San Francisco International Airport<br />
John Martin, Director<br />
John Bergener, Airport Planning Manager<br />
Cindy Nichol, Finance Director<br />
Sign Display & Allied Crafts Local Union 510<br />
Michael Hardeman, Business Representative<br />
Sonoma County<br />
Ben Stone, Director, Sonoma County <strong>Economic</strong> Development Board<br />
Tim Zahner, Director <strong>of</strong> Marketing, Sonoma County Tourism Bureau<br />
URS Corporation<br />
Tom Bishop, Senior Vice President<br />
Marty Czarnecki, Senior Vice President<br />
56
About BACEI and Beacon <strong>Economic</strong>s<br />
About the <strong>Bay</strong> <strong>Area</strong> <strong>Council</strong> <strong>Economic</strong> Institute<br />
<strong>The</strong> <strong>Bay</strong> <strong>Area</strong> <strong>Council</strong> <strong>Economic</strong> Institute is a public-private partnership <strong>of</strong> business, labor, government and higher<br />
education that works to support the vitality and competitiveness <strong>of</strong> the California and the <strong>Bay</strong> <strong>Area</strong> economies.<br />
<strong>The</strong> Association <strong>of</strong> <strong>Bay</strong> <strong>Area</strong> Governments (ABAG) is a founder and key institutional partner.<br />
Through its economic and policy research and partnerships, the <strong>Economic</strong> Institute addresses major issues impacting<br />
the economic competitiveness and development <strong>of</strong> the region and the state, including infrastructure,<br />
globalization, science and technology, and governance. By providing fact-based economic analysis, and by convening<br />
leaders from diverse communities and sectors, the Institute provides the intellectual infrastructure for<br />
strategic planning and major policy initiatives. Its Board <strong>of</strong> Trustees, which oversees the development <strong>of</strong> its products<br />
and initiatives, is composed <strong>of</strong> leaders representing business, labor, government, higher education, science<br />
and philanthropy.<br />
Contact<br />
Sean Randolph<br />
President & CEO<br />
(415) 981-7117<br />
Sean@<strong>Bay</strong><strong>Area</strong><strong>Council</strong>.org<br />
About Beacon <strong>Economic</strong>s<br />
Beacon <strong>Economic</strong>s is home to some <strong>of</strong> California's leading economic researchers and advisors. From government<br />
agencies to investment funds, from non-pr<strong>of</strong>it organizations to private enterprise, our analysis has helped today's<br />
leaders make better decisions. Our nationally recognized forecast has been called "eerily accurate" and was among<br />
the first to predict the collapse <strong>of</strong> the housing market and foretell the onset and depth <strong>of</strong> the recent economic<br />
downturn.<br />
Now and in the future, we are committed to equipping our clients with the tools and understanding essential for<br />
survival and success.<br />
Services<br />
<strong>Economic</strong> & Revenue Forecasting<br />
Business, Industry, & Market Analysis<br />
<strong>Economic</strong> Development Analysis<br />
Ports & Infrastructure Analysis<br />
Public Speaking<br />
Expert Testimony<br />
Feasibility Studies<br />
Contact<br />
Sherif Hanna<br />
Managing Principal<br />
(424) 646-4656<br />
Sherif@BeaconEcon.com<br />
Victoria Pike Bond<br />
Director <strong>of</strong> Communications<br />
(415) 457-6030<br />
Victoria@BeaconEcon.com<br />
57
<strong>Bay</strong> <strong>Area</strong> <strong>Council</strong> <strong>Economic</strong> Institute<br />
201 California Street, Suite 1450<br />
San Francisco, CA 94111<br />
(415) 981-7117<br />
(415) 981-6408 Fax<br />
gerrie@bayareacouncil.org<br />
www.bayareaeconomy.org