Sample IB Biology Lab
Sample IB Biology Lab
Sample IB Biology Lab

Create successful ePaper yourself
Turn your PDF publications into a flip-book with our unique Google optimized e-Paper software.
Factors Affecting Muscle Fatigue:<br />
The Effect of External Temperature on the Rate of Index Finger Lifts<br />
Background Information:<br />
Muscle fatigue has many factors that come into play. ATP, adenosine tri-phosphate,<br />
the energy source for all muscles, is required for a muscle contraction to take place. Usually,<br />
ATP is created aerobically, with the presence of O 2 . If O 2 is depleted, the body switches to<br />
anaerobic ATP production. Anaerobic metabolism produces lactic acid as a byproduct. Some<br />
scientists have reason to believe that lactic acid is not the culprit in muscle fatigue though. 3<br />
Calcium, Ca 2+ , however, does affect muscle fatigue. Studies have shown that tiny<br />
leaks of calcium in the muscles stimulates an enzyme which attacks muscle fibers. These<br />
calcium leaks accelerate the onset of muscle fatigue, although it is more prevalent in athletes<br />
who push their muscles regularly, thus not really pertaining to this investigation. 4<br />
ATP is required in the sarcomere of a muscle cell to release the myosin cross head<br />
bridge from the actin molecules. If there is not a sufficient amount of ATP, the myosin<br />
remains attached to the actin, and can no longer swivel. Regardless of whether or not there is<br />
still a presence of calcium, without the ATP, the muscle fatigues. 2<br />
Homeostatic mechanisms in the body take into account the external temperature of the<br />
body, and with a negative feedback response, adjust the body accordingly to prolong life.<br />
Thermoregulation acts when the body is in undesirably low temperatures, senses by receptors<br />
on the skin. Blood vessels constrict so as to keep in as much heat as possible. Sometimes, in<br />
extreme cases, blood flow is reduced to a very minimal level to the body’s extremities, such<br />
as the hands, to save the body’s core systems. Because of this, less oxygen is delivered to<br />
muscles in lower temperatures, thus inducing a switch to anaerobic metabolism quicker than<br />
in higher temperatures. 1<br />
Dr. Funk 4/1/09 1:58 PM<br />
Comment: Background information is<br />
focused on the specific lab topic. It gives<br />
information that is key to understanding what<br />
is going on in the lab better. This information<br />
may also be used in the conclusion to support<br />
or refute the hypothesis.<br />
Research Question: What is the effect of varying external temperatures on the rate of index<br />
finger lifts for a 17-year-old female? How does this speak to muscle fatigue onset?<br />
Hypothesis: If the muscles which raise the index finger are exposed to varying external<br />
temperatures, then the rate of index finger lifts will increase as the temperature of the external<br />
environment rises, because when muscles fall below desired temperatures blood vessels<br />
constrict decreasing the amount of oxygen to the muscles which aids in the production of ATP<br />
and the onset of muscle fatigue, while higher temperatures dilate the blood vessels and allow<br />
more oxygen to reach the muscle enabling higher endurance.<br />
Dr. Funk 4/1/09 1:59 PM<br />
Comment: A focused research question that<br />
includes both the IV and the DV.<br />
Dr. Funk 4/1/09 2:00 PM<br />
Comment: Hypothesis includes a prediction<br />
for specific responses to the IV. In addition, it<br />
has reasoning for why this might be true.<br />
If…then…because.<br />
1
Independent variable: Temperature of external environment<br />
0°C, 10°C, 20°C(control), 30°C, and 40°<br />
Dependant variable: Rate of index finger lifts<br />
Calculated by # of finger lifts (50) / time taken to perform finger lifts(seconds)<br />
Control: Rate of index finger lifts at 20°C, or room temperature.<br />
Constant Variables:<br />
• Type of finger - index: different fingers have different strengths and thus different<br />
finger endurances. Changing fingers skews the results.<br />
• Hand – non-dominant: The dominant hand on a person has greater endurance than the<br />
non-dominant hand, thus changing hands would skew results.<br />
• Person – 17-year-old female: Different people have different finger endurances, thus<br />
not keeping the person performing the finger lifts constant would skew results.<br />
• Surface of action – flat counter: different surfaces could make the finger lifts<br />
easier/harder. Lifts need to remain the same difficulty throughout the lab.<br />
• Height of lift – 5cm: Not lifting high enough would give an underestimate of the time,<br />
while lifting too high would give an overestimate of time.<br />
• Arm position: differing arm positions could alter the amount of blood flow to the<br />
finger, which must remain constant.<br />
• Altitude of action: Oxygen amounts inhaled must remain constant, and changing<br />
altitudes during the lab would skew the data.<br />
Dr. Funk 4/1/09 2:02 PM<br />
Comment: Both the IV and DV are clearly<br />
identified. The range of the IV is also clearly<br />
given.<br />
Dr. Funk 4/1/09 2:02 PM<br />
Comment: Control is clearly identified.<br />
Dr. Funk 4/1/09 2:01 PM<br />
Comment: This section explains the impact<br />
that each of the controlled variables might<br />
have on the results if they are not kept constant<br />
in each trial. Several different factors that<br />
could affect the outcome are considered and<br />
discussed here.<br />
Materials:<br />
Ruler, index finger of the left hand of a 17-year-old female, water, heat source for water, ice,<br />
thermometer (°C), stopwatch, towel, calculator<br />
Procedure * :<br />
Data Collection:<br />
1. Start by performing this procedure in room temperature external conditions, close to<br />
20°C.<br />
2. Have a test subject perform 50 finger lifts with the index finger of their left hand while<br />
another person times them. Record times on data table.<br />
a. Timer must record time every 10 finger lifts until the test subject has reached<br />
50, at which time would be considered the “total time”.<br />
3. Repeat exercise an additional two times.<br />
4. Change the external temperature of the subjects finger by creating a water bath with<br />
the set temperature of either 0°C, 10°C, 30°C or 40°C.<br />
5. Place hand in water bath for 5 minutes, to allow the hand’s muscles, blood vessels,<br />
and skin to adjust.<br />
6. Remove hand from water bath, dry with a towel, and repeat steps 2-3. Remember to<br />
record data every set of 10 finger lifts.<br />
7. Adjust water bath for another temperature and repeat exercise until data has been<br />
collected for all five temperature settings.<br />
Dr. Funk 4/1/09 2:04 PM<br />
Comment: The procedure is specific, written<br />
in third person, and has included the controlled<br />
variables. In addition, there is a good range of<br />
data for the IV being collected (0˚C-40˚C) as<br />
well as multiple trials for each level of the IV.<br />
* This may require a second person to record time values.<br />
2
Data Processing:<br />
1. Calculate the average of each trial by adding up the times and dividing by three to find<br />
the average.<br />
Dr. Funk 4/1/09 2:04 PM<br />
Comment: The formulas for processing data<br />
are clearly given. In addition, the data is<br />
manipulated and processed in a variety of ways<br />
to better understand the results.<br />
2. Calculate † the uncertainty, or standard error, by dividing the sample standard<br />
deviation, S x , of the data by the square root of the number of observations/trials, n.<br />
a. Standard deviation can be calculated as<br />
b. Plug in the standard deviation into the following equation for standard error,<br />
where n is the number of observations/trials:<br />
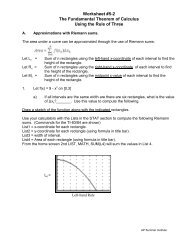
3. From the average values calculated for each trial, translate data into a line graph,<br />
where the Number of Finger Lifts is on the x-axis and the time taken to perform that<br />
Number of Finger Lifts on the y-axis.<br />
a. There should be 5 lines – one for each external environment temperature.<br />
b. Uncertainty values are included as error bars.<br />
4. Calculate the rate of finger lifts by dividing 50 lifts by the average total time for each<br />
temperature setting after adding and subtracting the uncertainty. There should be a<br />
range two values, thus offering a range of rates.<br />
Diagram of height<br />
regulation and finger lift<br />
set-up.<br />
Dr. Funk 4/1/09 2:05 PM<br />
Comment: Diagrams for the experimental<br />
design are provided and clearly labeled.<br />
Diagrams can help to explain any experimental<br />
set-up.<br />
† A calculator will make calculations easier. Enter data for trials in a list, and STAT>CALC>1-Var Stats will<br />
give you the mean and standard deviation of the data in the list.<br />
3
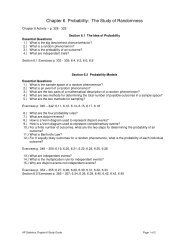
Average Time Elapsed after a Number of Lifts / seconds<br />
# of Lifts 0°C 10°C 20°C 30°C 40°C<br />
10 4.06± .1 3.76± .1 3.66± .3 2.95± .1 2.85± .1<br />
20 7.97 ±.2 7.55± .1 7.13 ±.2 5.99 ±.1 5.64 ±.2<br />
30 11.8 ±.2 11.7 ±.1 10.6 ±.3 9.12 ±.2 8.45 ±.3<br />
40 15.9 ±.4 15.6 ±.3 13.9 ±.3 12.15± .1 11.48± .3<br />
50 19.8 ±.1 19.4 ±.3 17.4 ±.5 15.33 ±.1 14.34 ±.3<br />
Rate (# of<br />
lifts/total time) (2.45, 2.52) (2.54, 2.62) (2.78, 2.95) (3.2 , 3.3) (3.4 , 3.6)<br />
Each value for the averages has its own uncertainty because a standard error method for<br />
calculating uncertainty was used. Because each set of trials has a different standard deviation,<br />
each average also has a slightly different average uncertainty.<br />
The ranges for all 5 external temperatures seems to be about the same, so the spread is<br />
consistent, however the minimum and maximum values differ greatly, especially between 0°C<br />
and 40°C. This shows that higher external temperatures correlate with faster finger lifting<br />
action for the 50 finger lifts.<br />
The rates also correspond to an inclination for faster action at higher temperatures. The<br />
interval is created from the highest and lowest values with the uncertainty calculated in for the<br />
total time. There is no overlap between these intervals, suggesting that there is a significant<br />
different between the external temperatures. Higher rates equate to higher endurance of the<br />
fingers, and less fatigue in the muscles, seen in the higher temperatures like 30°C and 40°C.<br />
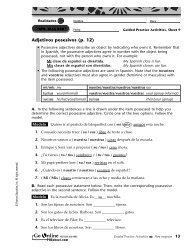
Time Elapsed (seconds)<br />
25<br />
20<br />
15<br />
10<br />
5<br />
0<br />
-5<br />
Average Time Elapsed after a Number of Lifts for each Temperature<br />
0 10 20 30 40 50<br />
Number of Finger Lifts<br />
0°C<br />
10°C<br />
20°C<br />
30°C<br />
40°C<br />
Dr. Funk 4/1/09 2:08 PM<br />
Comment: Raw data is included on a<br />
separate data and should be inserted at this<br />
point in the lab.<br />
A separate table for the processed data is<br />
included. The table has a title and is clearly<br />
labeled. Units are given. In addition,<br />
uncertainties are provided in each box for the<br />
processed data.<br />
Dr. Funk 4/1/09 2:08 PM<br />
Comment: Rates are easy to calculate and<br />
often are very appropriate for explaining the<br />
data. Be sure to include units!<br />
Dr. Funk 4/1/09 2:09 PM<br />
Comment: Data has been clearly analyzed.<br />
Reference to specific data is appropriate.<br />
Dr. Funk 4/1/09 2:10 PM<br />
Comment: The graph is of processed data<br />
only! The title is clear and includes both the IV<br />
and the DV. Axes are labeled and units have<br />
been given. A different color is used to<br />
represent each level of the IV. Error bars are<br />
also included.<br />
4
This graph visually represents the changes in the slopes for each external temperature<br />
as well as a visual comparison for times at each interval of Number of Finger Lifts (10, 20,<br />
30, 40, and 50). Error bars of many of the closer temperatures seem to overlap. This could<br />
Dr. Funk 4/1/09 2:10 PM<br />
Comment: A solid discussion of the graph.<br />
suggest that these data values are not significantly different; if we look at the extremes in<br />
temperature however, there is no overlap. External temperature does seem to have an effect<br />
on the onset of muscle fatigue in the left index finger of a 17-year-old female.<br />
Slopes of Best-Fit Lines for Each External Temperature<br />
0°C 10°C 20°C 30°C 40°C<br />
Slope<br />
(Δtime/Δlifts) 3.94 3.93 3.46 3.06 2.87<br />
Dr. Funk 4/1/09 2:14 PM<br />
Comment: Data was processed in several<br />
ways for this lab. This table shows the slopes<br />
for each line in the graph (with calculations<br />
provided). This data is then included in a graph<br />
which is followed by an explanation of what<br />
this all means and why this calculation was<br />
useful for understanding the data.<br />
Slope (change in time/change in<br />
number of lifts)<br />
4.5<br />
4<br />
3.5<br />
3<br />
2.5<br />
2<br />
1.5<br />
1<br />
0.5<br />
0<br />
Slope Comparison for each External Temperature<br />
0°C 10°C 20°C 30°C 40°C<br />
Temperature<br />
Slope<br />
Comparison<br />
These slopes represent the inverse of the rate. Temperatures with a higher slope signify that<br />
more time was required to complete the finger lifts, thus showing a build-up of fatigue in the<br />
muscles. Lower temperatures such as 0 and 10 seem to have higher slopes of their lines<br />
meaning that muscle fatigue onset quicker than in lower slopes.<br />
5
Conclusion:<br />
The purpose of this investigation was to explore a factor that affected muscle fatigue.<br />
An independent variable of external environment temperature was applied to a dependant<br />
variable of time taken to complete 50 finger lifts. Specifically, the question asked the effect of<br />
external temperature on the rate of index finger lifts in the left hand of a 17-year-old female.<br />
The hypothesis inferred that with an increase in external temperature there would be<br />
an increase in the rate of index finger lifts. From these data, the hypothesis is supported. The<br />
interval created for the rates of finger lifts for each external environment temperature<br />
increased as the temperature increased, thus showing a positive association between the two<br />
variables. Higher rates signified more activity, indicating a higher level of endurance and<br />
ultimately a later onset of muscle fatigue. Conversely, the slopes of the lines, which signified<br />
the change in time divided by 50, decreased as the temperature increased, a negative<br />
relationship, also supporting the hypothesis – a higher slope indicates slower activity,<br />
implying less endurance, implying an earlier onset of muscle fatigue. From the background<br />
information, the hypothesis asserted that this relationship was caused by primarily the effect<br />
temperature has on the blood circulation of the extremities, like the index finger. It is known<br />
that as temperature dips below desired levels the body restricts blood to the extremities, as<br />
their blood vessels constrict. Less oxygen is available to tissue in areas like this, thus<br />
inhibiting adequate muscle function, and inducing an onset of muscle fatigue earlier than<br />
when there are warmer temperatures because of less ATP to the muscles which inhibits the<br />
myosin heads to release from the actin fiber. Warmer temperatures allow adequate blood flow<br />
to all parts of the body, including extremities such as the index finger. This explanation fits<br />
the data observed in this investigation.<br />
Because muscle endurance and ability is so variable between humans, and even within<br />
the same human, this lab cannot really generalize for a whole population. As a matter of fact,<br />
there are numerous limitations and weaknesses in the design of the investigation. The most<br />
significant error to this lab was the treatment of the external environment. Although a water<br />
bath was suitable for exposing the hand to different temperatures very quickly, whenever the<br />
hand was removed from the water bath to perform the activity heat was either lost or gained to<br />
or from the atmosphere. The external temperature did not remain constant throughout the<br />
trials for this reason, and the data becomes questionable as to its ability to show a relationship<br />
Dr. Funk 4/1/09 2:14 PM<br />
Comment: The conclusion begins with a<br />
restatement of the data followed by the initial<br />
hypothesis for the lab.<br />
Dr. Funk 4/1/09 2:15 PM<br />
Comment: A discussion of whether the<br />
hypothesis was supported or refuted includes<br />
reference to specific data.<br />
Dr. Funk 4/1/09 2:16 PM<br />
Comment: The results of this lab are<br />
justified by research from the literature. Did<br />
you get the results that were expected based on<br />
the background information? If not, what<br />
problems existed in the lab or what factors<br />
contributed to the results.<br />
Dr. Funk 4/1/09 2:18 PM<br />
Comment: A discussion of the limitations<br />
and/or weaknesses in the lab. Each limitation is<br />
identified AND discussed. Why is it a<br />
limitation? What could be done differently?<br />
6
etween temperature and muscle fatigue onset. To avoid this weakness in further<br />
investigations, one would suggest using methods to actually change the temperature of the<br />
environment surrounding the place of activity. A ice box cooler, or cold day, could offer<br />
lower temperatures while a sunny hot day could offer the warmer temperatures. Although,<br />
problems remain with that kind of set up – one could not accurately change the temperature of<br />
the environment, rather only use what is available. Also, you could not control temperature<br />
anymore, because one would have to wait for that warm day, or cold day. Adequately<br />
controlling the external atmospheric temperature was a major weakness in this investigation.<br />
Another weakness was the method of counting the number of finger lifts. An arbitrary<br />
method of just counting by listening to when the finger hit the table was used, however I<br />
admit that I may have missed a few, or accidently added a few – human error. Because of this,<br />
I would suggest a method in which a computer records the cumber of finger taps performed.<br />
Perhaps a sensor under your finger could detect the pressure changes when lifting the finger<br />
and replacing it. There was also a weakness in regulating the height of the lift. If the test<br />
subject did not lift to the full height, the data produced an underestimate of the true value,<br />
while lifting too high would produce an overestimate. Fixing this would entail placing a<br />
platform at the specific height of the desired lift, and requiring the test subject to touch the<br />
platform each time. Once again, some sort of computerized pressure sensor would offer more<br />
accurate data.<br />
Finally, because this lab was so specified to the abilities of a single finger on a single<br />
hand of a single 17-year-old female, no generalizations could be made. Perhaps comparisons<br />
of age, gender, altitude, or any other constant variables for this experiment would be<br />
worthwhile. While variables like age and gender could speak to muscle capability, a variable<br />
such as altitude could speak to the oxygen differences in habitants of different altitudes.<br />
Dr. Funk 4/1/09 2:23 PM<br />
Comment: Following each limitation, an<br />
improvement is suggested and discussed for<br />
the next time around.<br />
Dr. Funk 4/1/09 2:23 PM<br />
Comment:<br />
Dr. Funk 4/1/09 2:18 PM<br />
Comment: Several limitations are evaluated.<br />
None of these says, “I messed up!” Do not<br />
include a limitation like this.<br />
Dr. Funk 4/1/09 2:23 PM<br />
Comment: Final thoughts about the lab<br />
would be appropriate here.<br />
Dr. Funk 4/1/09 2:24 PM<br />
Comment: Notice that the entire lab is<br />
written in third person. Do not ever use first or<br />
second person.<br />
7
Works Cited<br />
1 <strong>Biology</strong>Mad A-Level <strong>Biology</strong>. 02 Mar. 2009<br />
.<br />
Dr. Funk 4/1/09 2:25 PM<br />
Comment: Sources are correctly sited,<br />
including the date they were accessed and the<br />
URL.<br />
2 "Human Physiology - Muscle." EKU People. 02 Mar. 2009<br />
.<br />
3 "Lactic Acid Not The Culprit In Muscle Fatigue." Science News, Research And<br />
Discussion. 02 Mar. 2009<br />
.<br />
4 "Muscle Fatigue - What Causes Muscle Fatigue and Muscle Pain During Exercise."<br />
Sports Medicine, Sports Performance, Sports Injury - Information About Sports<br />
Injuries and Workouts for Athletes. 02 Mar. 2009<br />
.<br />
5 "Wikipedia." Standard Deviation. 22 Aug. 2008<br />
.<br />
8